Comments (4)
 SchmidtPaul
commented on July 18, 2024
2
SchmidtPaul
commented on July 18, 2024
2
Hey, just a little reminder that I am still very interested in this. But of course, I understand if you have other priorities.
from fieldhub.
 DidierMurilloF
commented on July 18, 2024
2
DidierMurilloF
commented on July 18, 2024
2
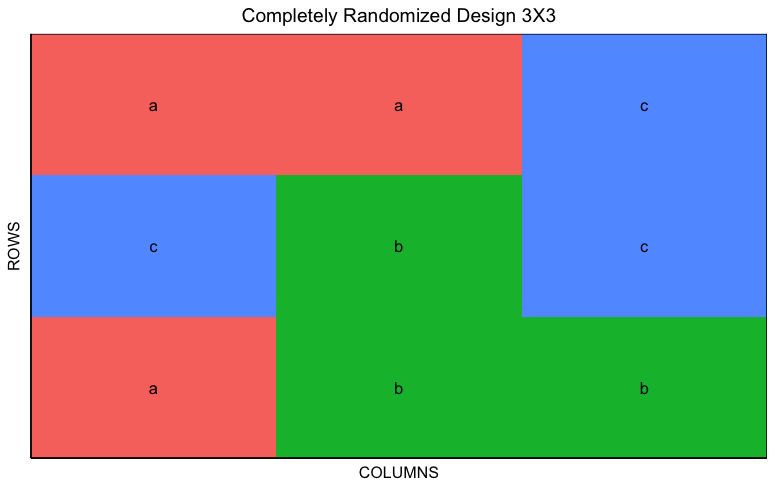
FielDHub now returns the plot using the method plot(). This plot object is a ggplot2 object, so we can modify it as any other ggplot2 figure.
library(FielDHub)
library(ggplot2)
The same example you shared,
x <- CRD(
  t = letters[1:3],
  reps = 3,
  seed = 42
)

y <- plot(x)

p <- y$p
p
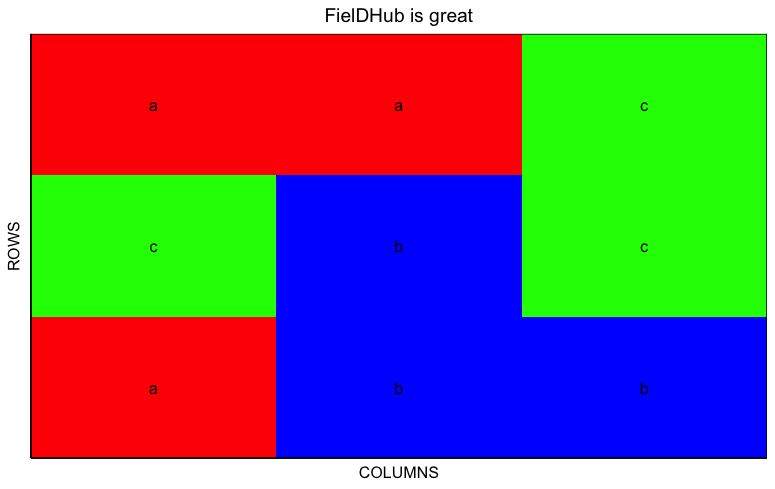
crd_layout <- y$p +
  ggtitle("FielDHub is great") +
  scale_fill_manual(values = c("red", "blue", "green"))

crd_layout
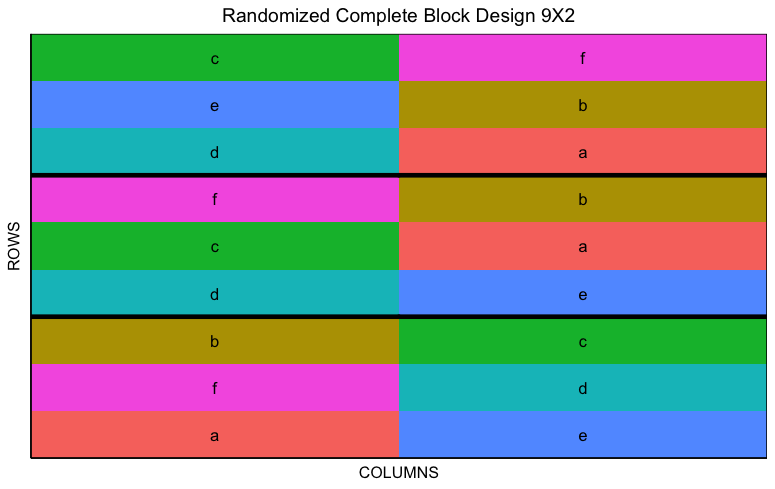
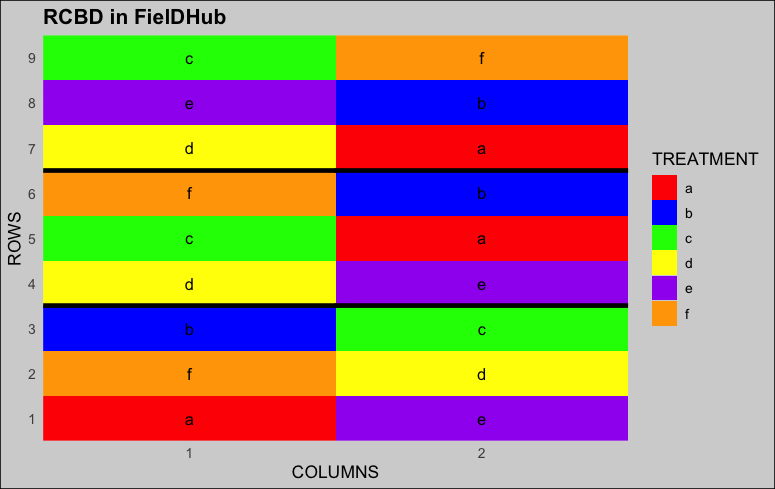
Let us try an RCBD,
v <- RCBD(
  t = letters[1:6],
  reps = 3,
  seed = 42
)

w <- plot(v)
p <- w$p
p
rcbd_layout <- w$p +
  ggtitle("RCBD in FielDHub") +
  scale_fill_manual(values = c("red", "blue", "green", "yellow", "purple", "orange"))

rcbd_layout
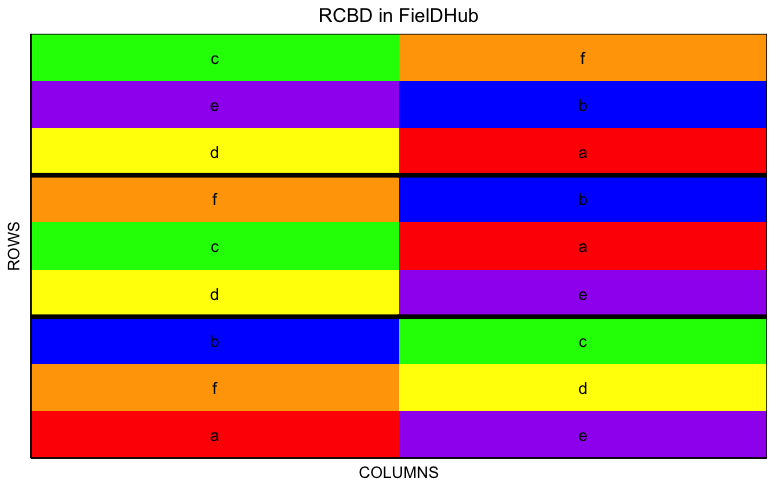
Let's add more features to the plot,
rcbd_layout <- rcbd_layout +
  scale_y_continuous(breaks = function(limits) seq(floor(limits[1]), ceiling(limits[2]), by = 1)) +
  scale_x_continuous(breaks = function(limits) seq(floor(limits[1]), ceiling(limits[2]), by = 1)) +
  theme_minimal() +
  guides(color = "none") +
  theme(plot.background = element_rect(fill = "lightgray"),
        text = element_text(size = 12),
        plot.title = element_text(face = "bold"))
rcbd_layout
I think this way of modifying or customizing the plots is acceptable. What do you think? You can test this version using the GitHub version. I am planning to release a new version of the app to CRAN this weekend.
from fieldhub.
DidierMurilloF
commented on July 18, 2024
1
Hey, @SchmidtPaul, I think that will be such a nice feature. I am going to add that and deploy it to CRAN in the following weeks. Thank you.
from fieldhub.
SchmidtPaul
commented on July 18, 2024
1
Fantastic! Thanks a lot! I immediately applied it to my website - check out the first few examples here.
I am closing this issue now because it has been solved.
One final note, though. I am assuming you switched from desplot::desplot() to desplot::ggdesplot(). While this should generally not be a problem and instead be advantageous since ggplot is better in several aspects, note that desplot::ggdesplot() is not as complete as desplot::desplot() as you can e.g. see in this or this issue. Again, it shouldn't actually cause any problems except in special situations but I am just pointing it out.
Finally, though, I have not tested it but suspect it would not be as easy to change the colors of the yellow and black lines generated by out1= and out2= right? At least I don't know how to change the static color of an existing layer.
from fieldhub.
Related Issues (20)
- Authorship by function HOT 6
- Output treatment for factorial designs HOT 1
- Checks argument HOT 5
- Shiny table output HOT 3
- Shiny development HOT 3
- Add link to repository in JOSS paper and contributing information HOT 2
- Suggestions to improve documentation HOT 2
- add contributing.md file HOT 3
- Error for `alpha_lattice(t = 1:8, k = 2, r = 2)` HOT 1
- Issue when importing entries' list in CRD HOT 1
- Allow Fillers in P-reps design when the number of field plots ends up in a prime number.
- order of replicates in partially_replicated HOT 8
- More options for field layout HOT 3
- Full optimisation row column design
- P-Rep Design HOT 3
- Full Factorial Design Failure in Shiny App with Spaces in 'FACTOR' Column Entries
- Running as Docker image on URL sub-path HOT 6
- Row-column design randomization
- primitive crossprod() function
Recommend Projects
-
 React
React
A declarative, efficient, and flexible JavaScript library for building user interfaces.
-
Vue.js
🖖 Vue.js is a progressive, incrementally-adoptable JavaScript framework for building UI on the web.
-
 Typescript
TypeScript is a superset of JavaScript that compiles to clean JavaScript output.
-
TensorFlow
An Open Source Machine Learning Framework for Everyone
-
Django
The Web framework for perfectionists with deadlines.
-
 Laravel
A PHP framework for web artisans
-
D3
Bring data to life with SVG, Canvas and HTML. 📊📈🎉
-
Recommend Topics
-
javascript
JavaScript (JS) is a lightweight interpreted programming language with first-class functions.
-
web
Some thing interesting about web. New door for the world.
-
server
A server is a program made to process requests and deliver data to clients.
-
Machine learning
Machine learning is a way of modeling and interpreting data that allows a piece of software to respond intelligently.
-
Visualization
Some thing interesting about visualization, use data art
-
Game
Some thing interesting about game, make everyone happy.
Recommend Org
-
Facebook
We are working to build community through open source technology. NB: members must have two-factor auth.
-
Microsoft
Open source projects and samples from Microsoft.
-
Google
Google ❤️ Open Source for everyone.
-
Alibaba
Alibaba Open Source for everyone
-
D3
Data-Driven Documents codes.
-
Tencent
China tencent open source team.
from fieldhub.