Comments (15)
 HanSolo
commented on June 16, 2024
1
HanSolo
commented on June 16, 2024
1
Made some first tests and it looks promising so far...

from charts.
HanSolo
commented on June 16, 2024
1
Yep that's possible as you can see in the travel example. There are flows from China to Japan and vice versa. First I've implemented something like incoming and outgoing before I realized that you only need an outgoing property. To pick up your example the code would like like this:
union.addToOutgoing(fdp, 1_360_000);
fdp.addToOutgoing(union, 500_000);
from charts.
HanSolo
commented on June 16, 2024
1
I've committed already locally and will push the stuff to the repo after I have made some more tests tomorrow morning...only have the early morning hours :)
from charts.
HanSolo
commented on June 16, 2024
1
Added the circular plot to the chart lib...
from charts.
HanSolo
commented on June 16, 2024
Yep should be possible. It would be nice if you could provide some data to create such a chart.
from charts.
 thomasnield
commented on June 16, 2024
thomasnield
commented on June 16, 2024
I'll put something together.
from charts.
HanSolo
commented on June 16, 2024
Awesome...👍🏻
from charts.
thomasnield
commented on June 16, 2024
Here's a start.
| CITY1 | CITY2 | WEIGHT |
|---|---|---|
| Dallas | Phoenix | 0.2 |
| Dallas | Chicago | 0.4 |
| Dallas | Austin | 0.3 |
| Dallas | Albuquerque | 0.1 |
| Phoenix | Chicago | 0.4 |
| Phoenix | Austin | 0.2 |
| Austin | Chicago | 0.1 |
| Austin | Albuquerque | 0.4 |
| Albuquerque | Phoenix | 0.5 |
I envision the API will allow user to establish arbitrary relationships between any two T items with a weight. The hashcode/equals implementation of each T item will trigger a lookup to see if each T item exists already, and then establish the weighted relationship with the other item.
I imagine the onus will be on the user to input the correct weights ahead of time. I suppose the weights don't have to add up to 1 for each T item.
FlowCircleModel model = new FlowCircleModel();

List<WeightedCityPair> weightedCityPairs = ...;

for (wcp: weightedCityPairs) {
	model.add(wcp.getCity1(), wcp.getCity2(), wcp.getWeight());
}
from charts.
thomasnield
commented on June 16, 2024
I looked at a few examples of this chart, and it looks like for a given pair of items A and B, the weight is the same for AB and BA. Direction has no impact, and the length of the ribbon tail is the same on both ends.
Here's a somewhat helpful description.
https://www.r-bloggers.com/circular-migration-flow-plots-in-r/
from charts.
thomasnield
commented on June 16, 2024
@HanSolo oh my gosh this is awesome, I'm so going to play with this.Thanks Gerrit!
from charts.
thomasnield
commented on June 16, 2024
I'm kind of second-guessing what I proposed with the data strucuture. Maybe the tails should be allowed to have different widths on either end, meaning that two values should be associated with each pair possibly...
from charts.
HanSolo
commented on June 16, 2024
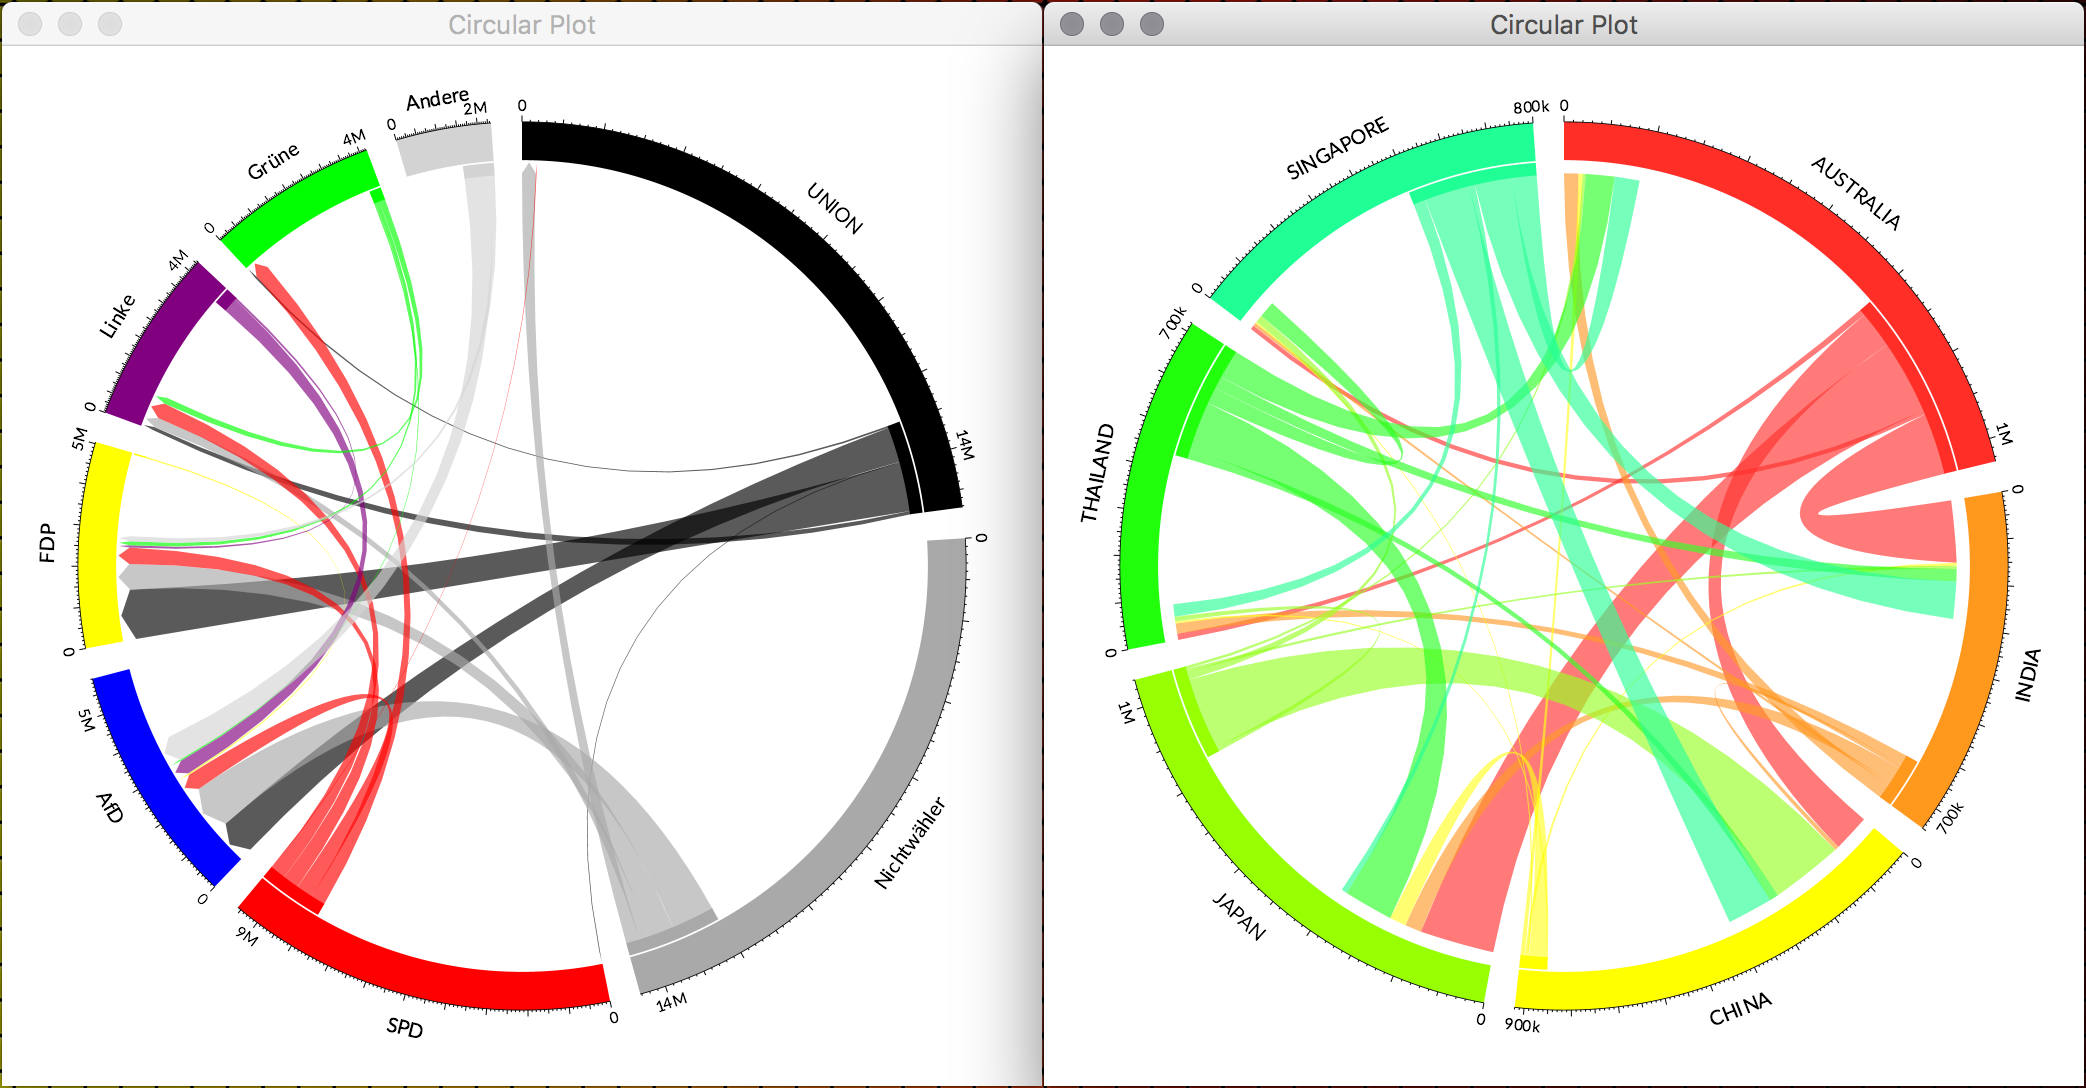
So at the moment this is not possible. I've took a look at different circular plots and in most of them the plot was used to visualize some kind of flow from one section to another. In my current implementation you define the chart items with their values. Then you can add outgoing connections to each chart item with a value. With this approach I've created a chart that visualizes the results of the current election in Germany with each party and it's end result and with the flow of voters from each party to the other parties. The election plot is based on real data. It's a really interesting approach to visualize data.
The second plot shows some fictive data of travellers between countries. So for example it shows how many people traveled from Australia to India, China, Japan, Thailand and Singapore. The value of each segment is the number of all travellers for that country.
Here are the two plots...
from charts.
thomasnield
commented on June 16, 2024
Okay this makes sense. Really interesting examples you whipped up too. I guess my remaining question is this: is it possible to represent flow in both directions for each item? Can I show movement of UNION -> FDP as well as FDP -> UNION? Or does that not make sense for what this graph conventionally achieves?
from charts.
thomasnield
commented on June 16, 2024
Awesome, I'll play with this today!
from charts.
thomasnield
commented on June 16, 2024
Love it, this is perfect :D
from charts.
Related Issues (20)
- Do you have JavaScript Version for this? HOT 1
- README: Image for "Area, line, dot and ring chart" is broken
- Allow to configure the Gradle project without knowledge about credentials
- AreaHeatMap draw method speed up HOT 1
- More features in Parallel Coordinates HOT 1
- Where can I find tutorials to learn how to work with this library HOT 2
- MatrixBuilder is very slow HOT 3
- JFXCentral Badge
- NPE - 17.1.51 - TimeAxis HOT 1
- IndexOutOfBoundsException when sorting by clusters in ArcChart HOT 3
- renderToImage(w,h) HOT 6
- document how to build HOT 2
- eu.hansolo.fx:charts:17.1.21 no longer found in maven central? HOT 2
- LineChart items xySeries couldn't be cleared in a simple way HOT 2
- Axis title font size is not working HOT 1
- Updating Axis range in LineChart HOT 12
- Heatmap's ColorMapping is not available HOT 1
- Axis for heatMap HOT 2
- HeatMap with solid color HOT 5
- Domain and Range markers HOT 6
Recommend Projects
-
 React
React
A declarative, efficient, and flexible JavaScript library for building user interfaces.
-
Vue.js
🖖 Vue.js is a progressive, incrementally-adoptable JavaScript framework for building UI on the web.
-
 Typescript
TypeScript is a superset of JavaScript that compiles to clean JavaScript output.
-
TensorFlow
An Open Source Machine Learning Framework for Everyone
-
Django
The Web framework for perfectionists with deadlines.
-
 Laravel
A PHP framework for web artisans
-
D3
Bring data to life with SVG, Canvas and HTML. 📊📈🎉
-
Recommend Topics
-
javascript
JavaScript (JS) is a lightweight interpreted programming language with first-class functions.
-
web
Some thing interesting about web. New door for the world.
-
server
A server is a program made to process requests and deliver data to clients.
-
Machine learning
Machine learning is a way of modeling and interpreting data that allows a piece of software to respond intelligently.
-
Visualization
Some thing interesting about visualization, use data art
-
Game
Some thing interesting about game, make everyone happy.
Recommend Org
-
Facebook
We are working to build community through open source technology. NB: members must have two-factor auth.
-
Microsoft
Open source projects and samples from Microsoft.
-
Google
Google ❤️ Open Source for everyone.
-
Alibaba
Alibaba Open Source for everyone
-
D3
Data-Driven Documents codes.
-
Tencent
China tencent open source team.
from charts.