Comments (5)
 Padanian
commented on May 18, 2024
2
Padanian
commented on May 18, 2024
2
May I suggest to avoid SaveCSV for every plottable, and just create a JSON or XML with all plottables. It would be much easier to serialize from a Plottable tree class to JSON or XML. Just add one more item in the right click contextmenu of the user control. A JSON telegram can then be parsed by the data-logging program or sent via MQTT to a broker. Parsing an XML or JSON vs CSV does not represent a significant overhead.
from scottplot.
 swharden
commented on May 18, 2024
swharden
commented on May 18, 2024
Actually, maybe a pop-up menu to "select which plottable to export" would be nice, as it would let the user only output a single signal. That way output is always XY.
Edit: I got this started (b73bb9d) and all plottable objects now have a GetCSV() method ready to populate.
from scottplot.
Padanian
commented on May 18, 2024
Feel free to let me know if I can be of any help at any point.
from scottplot.
swharden
commented on May 18, 2024
This turned out to be pretty easy! I implemented SaveCSV (4a04ffc) and added demos to the cookbook: https://github.com/swharden/ScottPlot/tree/master/cookbook#save-scatter-data
I'll figure out the best way to add it to the right-click menu, because it will probably require creation of a pop-up dialog (to select which of multiple plots to save). I'll keep it simple but leave room to add other data format exports later.
from scottplot.
swharden
commented on May 18, 2024
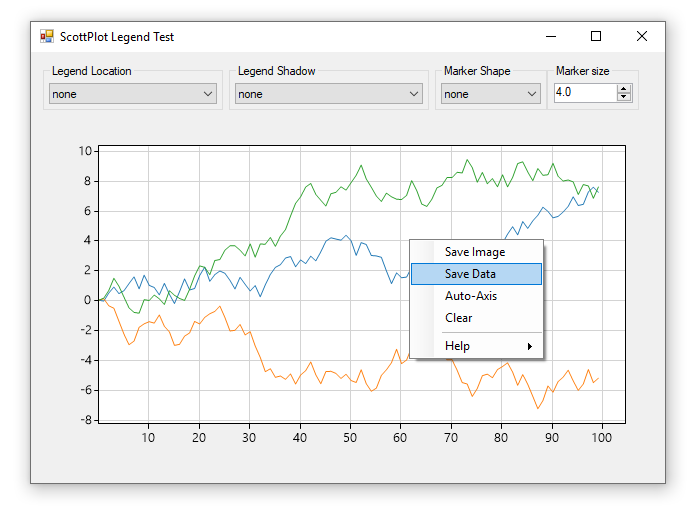
I added a "Save Data" button to the right-click menu. It only saves the first object plotted, and the menu item only lights up when the first object is savable as CSV (e.g., you can't save an axis line).
It's a pretty light implementation, but we can add complexity if the need arises. The next step would be for a whole new dialog to pop up listing all the plottable objects, allowing the user select which plot to export, and allowing the user to select which format (XML, JSON, CSV), and things like precision and tab vs. comma separation. This seems like a pretty heavy addition, and if someone wants to work on that they can, but I'm happy to leave this where it is for now until we are ready to invite the additional complexity.
from scottplot.
Related Issues (20)
- Annotation: Text Position with Wrong Spacing HOT 4
- SVG with line breaks don't render correctly and tick marks inconsistent HOT 2
- Update 5.0.31: ScottPlot.Plottables.Crosshair does not show anymore (also not in "Demo" project) HOT 2
- Rendering: changing the plottable list mid-render will cause an exception HOT 2
- StandardZoomRectangle: make `LineStyle` setter public HOT 3
- Marker.MarkerLineWidth stopped working after v5.0.27 HOT 5
- ScottPlot 5: Stiatistical distribution issue HOT 1
- DateTimeFixedInterval not Generating Expected Daily Ticks HOT 2
- Legend: add option to disable column-based wrapping HOT 2
- Replace data of plottable HOT 2
- Add .Measure() functionality back in HOT 1
- AvaPlot does not show the bottom Axis Label under any circumstances HOT 2
- VectorField: Add ScaleFactor HOT 1
- SignalXY: add option for step display HOT 6
- Signal: List<T> low density rendering issue HOT 5
- SignalXY: How to get the nearest point to the mouse location HOT 4
- Axis: add option to wrap text HOT 1
- Plotting Mutiple Digital signals (1s & 0s) one below the other in a signle graph? HOT 1
- 3D Plots: add new plot types and improve features
- CICD: dependency security scan
Recommend Projects
-
 React
React
A declarative, efficient, and flexible JavaScript library for building user interfaces.
-
Vue.js
🖖 Vue.js is a progressive, incrementally-adoptable JavaScript framework for building UI on the web.
-
 Typescript
TypeScript is a superset of JavaScript that compiles to clean JavaScript output.
-
TensorFlow
An Open Source Machine Learning Framework for Everyone
-
Django
The Web framework for perfectionists with deadlines.
-
 Laravel
A PHP framework for web artisans
-
D3
Bring data to life with SVG, Canvas and HTML. 📊📈🎉
-
Recommend Topics
-
javascript
JavaScript (JS) is a lightweight interpreted programming language with first-class functions.
-
web
Some thing interesting about web. New door for the world.
-
server
A server is a program made to process requests and deliver data to clients.
-
Machine learning
Machine learning is a way of modeling and interpreting data that allows a piece of software to respond intelligently.
-
Visualization
Some thing interesting about visualization, use data art
-
Game
Some thing interesting about game, make everyone happy.
Recommend Org
-
Facebook
We are working to build community through open source technology. NB: members must have two-factor auth.
-
Microsoft
Open source projects and samples from Microsoft.
-
Google
Google ❤️ Open Source for everyone.
-
Alibaba
Alibaba Open Source for everyone
-
D3
Data-Driven Documents codes.
-
Tencent
China tencent open source team.
from scottplot.