Comments (45)
 tomolimo
commented on June 5, 2024
tomolimo
commented on June 5, 2024
The table in glpi is only for the authentication into the PM server. The password is automatically and ramdomly created by the plug-in. This way a user can't get access to PM directly. This is to prevent desynchronisation of the task list in the ticket. If you need to have some users to get access to PM (process designers for example) then you can create dedicated users like 'pm_tomolimo' with a dn pointing to 'tomolimo' user in ldap.
If you really want to have the same users in GLPi and in PM with an access to both: this configuration is not currently possible.
In my company, we are using ldap for glpi authentication, and pm is completely masked to the end users. PM is also set up for ldap, but only for special users like written above.
from processmaker.
 raregtp
commented on June 5, 2024
raregtp
commented on June 5, 2024
Good to know. Was still having issue so took a step back to partially start over configuring....now the only user that will import into PM is the default glpi user. Not sure what I'm missing.....likely all me as I was up past 4 AM reading and working on this.
Looking through my GLPI users it only seems to be syncing users created in GLPI....and skipping my ldap users. The pmuser action shows it processed all my users, but none of the AD users are showing up in PM.
from processmaker.
tomolimo
commented on June 5, 2024
There is no filtering on glpi ldap users. The pmusers cron is doing a diff between users in glpi_users table and PM users table, adding those that are missing in PM, and deactivating in PM the deactivated and deleted glpi users (the glpi destroyed ones are not touched in PM as I cannot guess if they are existing in PM by themselves).
from processmaker.
raregtp
commented on June 5, 2024
Ok, that makes sense. As I've dug in further it's not an ldap thing for sure. What I'm observing is the pmusers cron is running to completion in GLPI....the pmusers automatic action log shows it process all 251 users. But....only one user is getting created in ProccessMaker, and when looking at the proccessmaker_users table in the GLPI db only one user is being created with a completed pm_users_id and password. There is a second user that has a password but nothing in the pm_users_id field, and nothing has been created for this user in the processmaker db. Also seeing errors in the php-errors.log.....attached a snipit of the log here.
Let me know what other info you need. I had the import working just fine on two occasions but ran into other issues during those installs that had me revert and start over. This particular issue I can't seem to get around, even when reverting completely to a fresh installation of ProcessMaker and a removal and reinstall of the ProcessMaker GLPI plugin. I'm sure I'm missing something but looking for any assistance you can provide at this point. Thanks!
from processmaker.
tomolimo
commented on June 5, 2024
Hello,
It seems that there is a SOAP error. Could you give me more history from the log?
Thank you,
Tomolimo
from processmaker.
raregtp
commented on June 5, 2024
Here you are. The first user is the one that it seems to create every time I run a sync. Let me know what else you need. Thanks!
more-php-errors.txt
from processmaker.
tomolimo
commented on June 5, 2024
The soap error means that PM didn't return the correct information to the caller (i.e.: function createUser in processmaker.class.php).
I don't know why, but you may find other logs from PM (as PM is not writing its logs into the logs of GLPI). Could you look into PM itself? For this start the a PM session in admin, go to 'Admin' tab, and select (PHP Information' at the end of the list on the left side. Search for error_log in the right page. You should be able to find the real log file of PM server.
thank you to pass to me this file.
Tomolimo
from processmaker.
raregtp
commented on June 5, 2024
Found out the error log directive isn't set on the PM server. Working on that. In the meantime, here are the logs from Apache on the PM server.
Appreciate the help!
from processmaker.
tomolimo
commented on June 5, 2024
Hello,
This Apache logs show the same error message than the one in GLPI.
I need more information to try to help you. Could you ive your configuration of the PM server and the configuration of the PM plugin?
thank you
regards,
Tomolimo
from processmaker.
raregtp
commented on June 5, 2024
I can certainly do that, what specifically do you want to see for config info and how that's delivered? I honestly don't generally ask for help.....fairly self sufficient so may need a little more direction on what you want to see. Thanks!
from processmaker.
tomolimo
commented on June 5, 2024
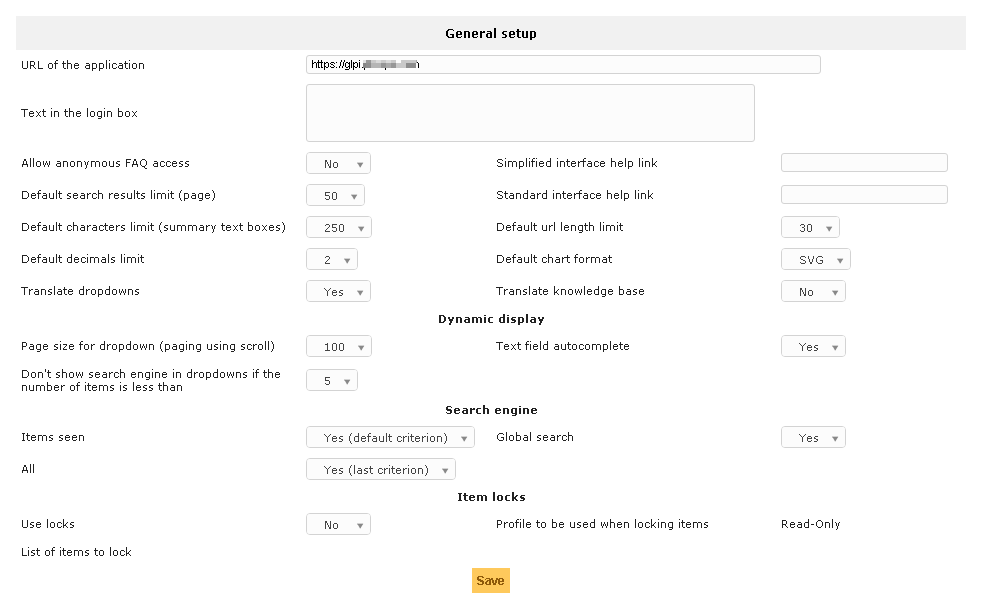
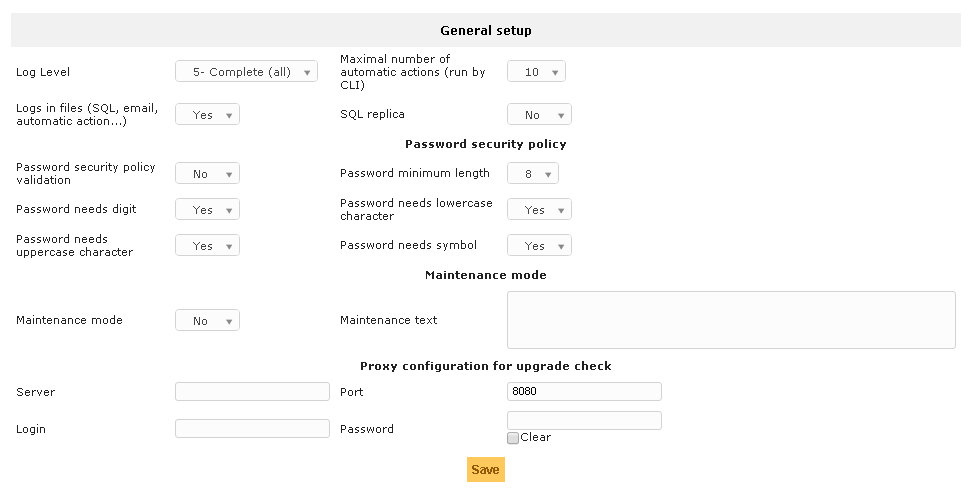
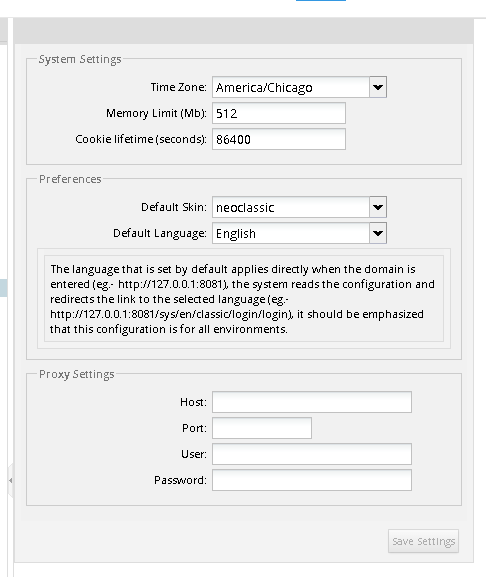
In GLPi: in the setup > general, and then you have system tab (copy paste the config) and tab processmaker tab (screen copy will do).
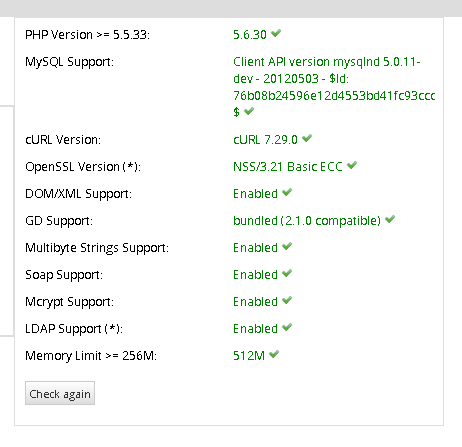
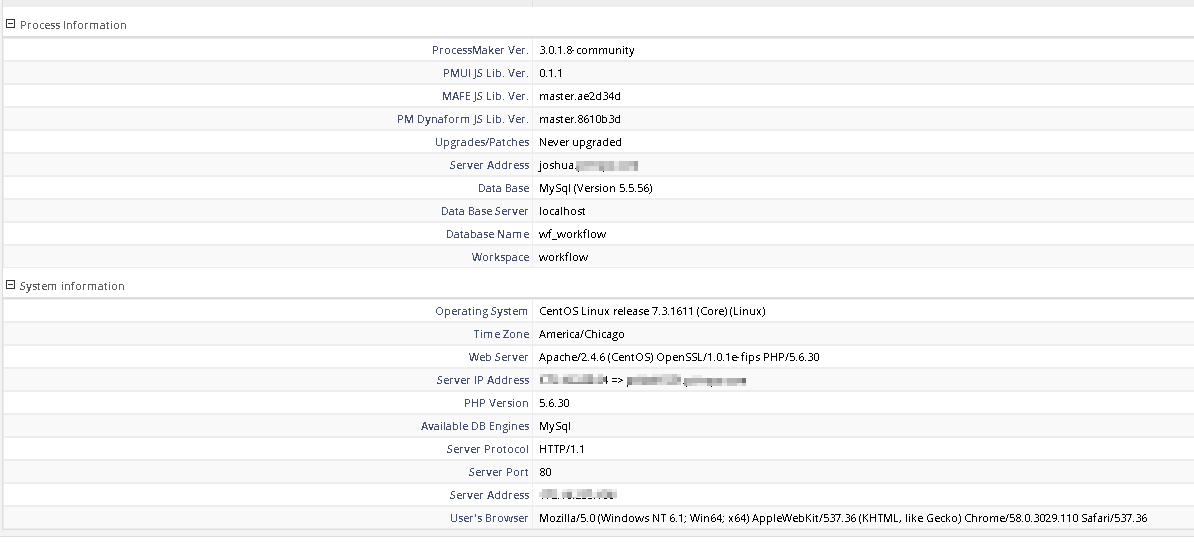
In PM server in admin page, you can screen copy the several information tabs.
from processmaker.
raregtp
commented on June 5, 2024
Here you are......
from processmaker.
tomolimo
commented on June 5, 2024
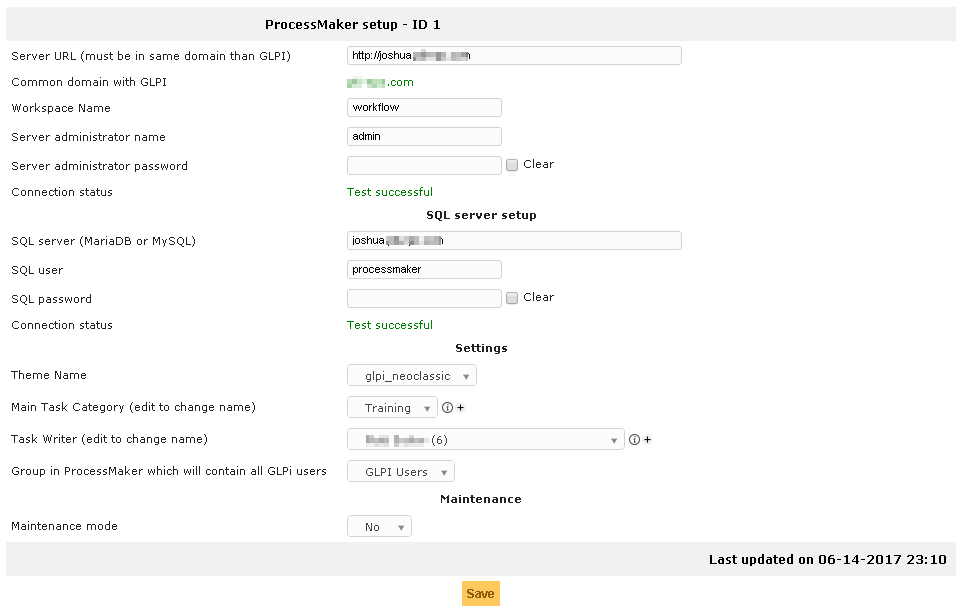
And the processmaker plugin setup screen copy?
from processmaker.
raregtp
commented on June 5, 2024
Oh....sorry......had it, forget to attach it.
from processmaker.
tomolimo
commented on June 5, 2024
Hello,
These settings seems alright, the only idea I've to troubleshoot this is to do some debug...
If I explain how to do it, will you mind to do it?
I'll give you steps by steps the procedure to debug the code, and you'll give me back the info (by text or screen copies), is it OK for you?
Q: do you test on a test server, or on a production server? Behind is the fact that to debug, we need to install xDebug (a PHP extension) on the server itself.
Regards,
Tomolimo
from processmaker.
raregtp
commented on June 5, 2024
Works for me. I'm a systems guy and an engineer at heart, but I've got a programming background as well and am extremely interested to learn more on this front. Test or production....if we're talking ProcessMaker, that's a new spin-up and completely test. If we're talking GLPI, that's more production than test but only used by my team so this still shouldn't be an issue. How invasive is xDebug, or is it more of a performance concern while we're debugging?
from processmaker.
tomolimo
commented on June 5, 2024
Super, sounds good :)
xDebug is really a performance problem. But it can be switched on and off when needed.
Will you be available on Monday?
And as far as I understand you are in Chicago time zone? I am in the Paris time zone, so I will book my afternoon for you if you can book your morning?
from processmaker.
raregtp
commented on June 5, 2024
Unfortunately I have a deadline Monday afternoon…..I’ll be focused on other items Monday morning. Tuesday is generally a better day for me.
From: tomolimo [mailto:[email protected]]
Sent: Saturday, June 17, 2017 1:45 AM
To: tomolimo/processmaker <[email protected]>
Cc: Matthew D. Baker <[email protected]>; Author <[email protected]>
Subject: Re: [tomolimo/processmaker] Ldap authentication (#27)
Super, sounds good :)
xDebug is really a performance problem. But it can be switched on and off when needed.
Will you be available on Monday?
And as far as I understand you are in Chicago time zone? I am in the Paris time zone, so I will book my afternoon for you if you can book your morning?
—
You are receiving this because you authored the thread.
Reply to this email directly, view it on GitHub<#27 (comment)>, or mute the thread<https://github.com/notifications/unsubscribe-auth/AP6qUA-zE9MH9q99jTveDOF5zr3UGAjIks5sE3XhgaJpZM4N6Ed3>.
from processmaker.
tomolimo
commented on June 5, 2024
Then for Tuesday.
I'll send before a list of things to do to prepare this,
regards,
from processmaker.
raregtp
commented on June 5, 2024
Sounds good. Thanks!
from processmaker.
tomolimo
commented on June 5, 2024
Hello,
Here is a small doc on how to debug PM server source code:
- Install on the server the xDebug PHP extension from https://xdebug.org/docs/install (choose the method that fits your operating system)
- Configure xDebug extension like following:
[php_xdebug]
zend_extension = "pathtoxdebugext/php_xdebug.dll"
xdebug.remote_enable = 1
xdebug.remote_handler = dbgp
xdebug.remote_host = 127.0.0.1
xdebug.remote_port = 9000
xdebug.remote_mode = req
xdebug.remote_autostart = 1
;xdebug.remote_log="c:\temp\xd.log"
xdebug.auto_trace = off
xdebug.collect_assignments = on
xdebug.collect_return = on
xdebug.collect_vars = on
xdebug.dump_undefined = on
-
Install Visual Studio Code from https://code.visualstudio.com/ on the same host than xdebug
-
Start VSC, and install "PHP Extension Pack" (writer Felix Becker) from marketplace
-
'Open Folder'
_processmaker_server_path_/workflow/engine/classes/ -
Switch to 'Debug' view
-
Start a debug session (it will propose you to choose an environment, select PHP), verify that 'Listen for XDebug' is selected. It should be waiting for xdebug on port 9000.
-
In VSC Explorer, open file
class.wsBase.php -
Go To line 2323
-
Toggle a breakpoint
-
You may disable the 'Everything' breakpoint which is set by default, it's in the 'Debug' view and in the breakpoint list (bottom left).

-
Start GLPI in your browser
-
go to 'Automatic Actions', open pmusers form.
-
Click on 'Execute', and you should see your VSC with a breakpoint
Then you can go line by line and see the variable contents...
from processmaker.
tomolimo
commented on June 5, 2024
Time for me to go for lunch 😄
from processmaker.
tomolimo
commented on June 5, 2024
back from lunch
from processmaker.
raregtp
commented on June 5, 2024
Just got in the office.....have some "fires" that may take a good chunk of my day, but let me see what I can do. Worse case I would have to do this afterhours. Thanks!!
from processmaker.
tomolimo
commented on June 5, 2024
ok, let me know
from processmaker.
raregtp
commented on June 5, 2024
Ok....first stab at this tonight. My servers are virtual so took a checkpoint...and am glad I did as I incorrectly started doing this on the GLPI server and not the PM server. After re-reading, your steps are intended for the PM server, correct??
Next challenge....both my GLPI server and PM server are CentOS with NO gui. GLPI is CentOS 6.x, and PM is CentOS 7.x. With no gui I cannot run Visual Studio Code locally, at least not in such a way as to see the same options you outlined. That said, I've got Visutal Studio Code installed on my Win7 workstation, and plan on configuring the xdebug.ini file to point to my workstation instead of the loopback on the PM server. I was successful in getting xdebug installed and the module loaded in php, even though it was on the GLPI server, and can easily get it up and running on the PM server. I like this option as I can easily disable xdebug in the .ini and leave the module installed for future use, and I'm not cluttering up the server with the Visual Studio Code app.
I've got the NFS services installed on my Win7 workstation and plan on mounting the path you mentioned in step three to a drive letter locally on my workstation. Unless there are huge issues having xdebug point to a remote system, I don't see why this won't work. Unfortunately I'm out of time tonight but as this is the PM server I should be targeting right now, I see no reason I can't hit this again in the AM.
If you see any flaws in my adaptation of your instructions to the methods I've outlined, just let me know. I'll be in touch tomorrow. Thanks!
from processmaker.
tomolimo
commented on June 5, 2024
After re-reading, your steps are intended for the PM server, correct??
Yes, sorry if this point was not clear :)
And be careful that the xDebug version may not be the same as the PHP version may not be identical.
Regarding the fact that you have no gui: the given steps are only for local installation and debugging. I did already some tests for remote debugging, and didn't succeed. Please let me search a little bit more before doing tries on your side.
from processmaker.
tomolimo
commented on June 5, 2024
Here are the steps to do remote debugging:
Install and configuration
XDebug
- Install on the PM server the xDebug PHP extension from https://xdebug.org/docs/install (choose the method that fits your operating system)
- Configure xDebug extension like following:
[php_xdebug]
zend_extension = "pathtoxdebugext/php_xdebug.dll"
xdebug.remote_enable = 1
xdebug.remote_handler = dbgp
xdebug.remote_host = ip_address_of_your_visual_studio_code
xdebug.remote_port = 9000
xdebug.remote_mode = req
xdebug.remote_autostart = 1
;xdebug.remote_log="c:\temp\xd.log"
xdebug.auto_trace = off
xdebug.collect_assignments = on
xdebug.collect_return = on
xdebug.collect_vars = on
xdebug.dump_undefined = on
Note: ip_address_of_your_visual_studio_code is the IP address of your machine from which you want to start debugging. It's the machine hosting the Visual Studio Code. Don't use the xdebug.remote_connect_back option as it will get the ip address of the GLPI server, and not the ip address of the VSC machine.
VSC
- Install Visual Studio Code from https://code.visualstudio.com/ on the client machine
- Start VSC, and install "PHP Extension Pack" (writer Felix Becker) from marketplace
- 'Open Folder' or 'Create a folder' like
/pm/ - Switch to 'Debug' view
- Start a debug session (it will propose you to choose an environment, select PHP), verify that the 'launch.json' file is like following (adding serverSourceRoot and localSourceRoot):
{
   "version": "0.2.0",
   "configurations": [
      {
         "name": "Listen for XDebug",
         "type": "php",
         "request": "launch",
         "port": 9000,
         "serverSourceRoot": "_local_path_to_pm_folder_on_server_used_by_xdebug_",
         "localSourceRoot": "_remote_path_to_pm_folder_on_server_used_by_vsc_"
      },
      {
         "name": "Launch currently open script",
         "type": "php",
         "request": "launch",
         "program": "${file}",
         "cwd": "${fileDirname}",
         "port": 9000
      }
   ]
}
Example of paths for me:
local_path_to_pm_folder_on_server_used_by_xdebug: L:\inetpub\wwwroot\pm
remote_path_to_pm_folder_on_server_used_by_vsc: \\glpi.com\l$\inetpub\wwwroot\pm
Debug session
-
In VSC Explorer, open file
_remote_path_to_pm_folder_on_server_used_by_vsc_/workflow/engine/classes/class.wsBase.php -
Go To line 2323
-
Toggle a breakpoint
-
You may disable the 'Everything' breakpoint which is set by default, it's in the 'Debug' view and in the breakpoint list (bottom left).
-
Start GLPI in your browser
-
go to 'Automatic Actions', open pmusers form.
-
Click on 'Execute', and you should see your VSC with a breakpoint
from processmaker.
raregtp
commented on June 5, 2024
Ok....I believe I've gotten to the point where I can debug, but after executing the pmusers automatic action, I'm not sure what I'm supposed to be looking for in Visual Studio Code....nothing seems to be happening.
In VSC step three you said to create a pm folder. I'm assuming your talking about a folder on the system where I'm running VSC? I did that and it stores the json file in this location, so I think this is just the workspace?
In VSC step 5....I set the localsourceroot to my local drive letter that I mapped to the NFS export on my linux server for PM. It's read-only, but I don't believe it needs more than that, correct? Also, I had to escape the backslash in my drive letter with a backslash (so y:\ location becomes y:\ in the json file).
The local firewall on my workstation is opened up for port 9000 from my pm server, and in fact I built the rule to log access and can see a ton of information coming in from the pm server....but nothing seems to happen in VSC.
Ok.....check all that, I seem to have results as I just tried this again. Now I just need to know how to run a debugger. :)
from processmaker.
tomolimo
commented on June 5, 2024
Ok....I believe I've gotten to the point where I can debug, but after executing the pmusers automatic action, I'm not sure what I'm supposed to be looking for in Visual Studio Code....nothing seems to be happening.
Did you set the breakpoint before runing pmusers? Did VSC break at the line?
I think this is just the workspace?
Yes.
Ok.....check all that, I seem to have results as I just tried this again. Now I just need to know how to run a debugger. :)
Did you get into the breakpoint? If yes, you may use the small toolbar above to 'step over', 'step in', 'step out', 'continue', 'restart debug' or 'stop debug'.
- 'Step over': will execute current line (selected line) and top on next line. -> Most used command
- 'Step in': will go into the function call (if any) and stop at first line in the function itself
- 'Step out': will go out of the current function and stop at the line after the call of the function. Sometimes doesn't work properly, is better to set a breakpoint on the line you want to stop the execution.
- 'Continue': is a go to continue execution till end of script or next breakpoint
- 'Restart debug': is supposed to restart execution from begin of script, but when script is called from a browser, I don't know how the browser will react.
- 'Stop debug': self explanatory :).
After this small intro to debug tools.
You must try by yourself and discover the left panel, where you may find the local variables, the watched variables, the call stack, and the breakpoint list.
- 'Local variables': variables that are in the current function scope
- 'Watched variables': you may ask for some variables to be spied (or watched)
- 'Call stack': is the stack (=ordered list) of function calls. You can select the one of the callers of the current function, and you see the context of this call (local variables, and source code)
Also, you may 'see' a variable content by hovering your mouse pointer over the variable identifier.
To come back to our issue, you may go line by line (use 'Step over') til end of the current function, and you should see the evolution of the local variables.
from processmaker.
raregtp
commented on June 5, 2024
Let me see if I can get into this later today. Was out of the office on Friday.
from processmaker.
raregtp
commented on June 5, 2024
Still trying at this. I was able to get debugging to work once and was stepping through.....and it was working. I watched it create a user. So I stopped debugging and logged into the server......there are a handful of users that have been synced over from GLPI (5 - 10) but no more. I shouldn't have stopped debugging when I did but it threw me when it was completing. Now, I can't seem to get debugging to work again. Almost out of time today and will have to continue in the next day or so.
from processmaker.
raregtp
commented on June 5, 2024
Ok....got debugging to work again. Created another user just fine and then bombed, saying it couldn't access sysGeneric.php.....but I think this is just a network thing I'm experiencing due to the remote debugging. But, what's weird is each time while debugging it is actually creating a user in PM....but manually executing the GLPI pmusers action without debugging doesn't see any users being created. Doesn't make sense to me......
Permissions on that file appear to be correct.
from processmaker.
tomolimo
commented on June 5, 2024
Any news?
from processmaker.
raregtp
commented on June 5, 2024
Haven't been able to get back at it today. Been thinking about this, though......
When I am able to get debugging to work, it seems I have to 'fiddle' with restarting apache on the PM server and the GLPI server, I've had to dismount my drive letter to NFS share and remount it, at one point I restarted the whole PM server and then it worked. So far I cannot find a pattern to when I can get the debugging to work and when I can't. But....two times now for sure I've seen debugging work and actually create a user, and in fact I have a handful of users in PM now from GLPI but I haven't ran debugging the same number of times as the number of users I have now. Each time debugging works after creating one user it bombs out on a permissions issue to a file, but I think it has to do with my NSF client on Windows and accessing the NSF export on the PM server......in other words, I don't think that portion has anything to do with the issue we're trying to debug.
So......one possibility I'm wondering about is if the sync is actually working intermittently under a specific set of circumstances, and when debugging isn't working it's because of something else going on between the GLPI and PM server in the first place. I plan on trying some of the same steps I've been trying to get the debugging working but without doing any debugging, and seeing if one of those times the sync actually works to completion. The challenge will be duplicating the steps when I make it work.
The other thing I'm going to try is backing off of NFS and put samba on the PM server, and then access the ProcessMaker path on the PM server though SMB instead of NFS. I think the permissions will play nicer with Windows if it is indeed a permissions problem I'm running into with the NFS server/client.
Thoughts?
from processmaker.
tomolimo
commented on June 5, 2024
Hello,
One point that will prevent NFS or Samba error: from your PC, you don't need to point to real PM folder, you may have a local copy of it, and point to it for VSC. launch.json must be defined as follow:
         "serverSourceRoot": "L:/inetpub/wwwroot/pm\\",
         "localSourceRoot": "c:\\Projects\\ProcessMaker\\3.0.1.8\\"
The only issue with that is the capitalization of the local path, you must respect it, but drive letter must be lowercase.
regards,
Tomolimo
from processmaker.
raregtp
commented on June 5, 2024
Awesome....I'll try a local copy, that will definitely simplify this. I'll try to hit it later today.....but if not, we're going into a holiday weekend/week so it may be a few days before I can get back to this.
from processmaker.
tomolimo
commented on June 5, 2024
Same for me: I'll be in holidays, but I will keep an eye on the thread.
from processmaker.
raregtp
commented on June 5, 2024
Just a quick FYI....haven't forgotten about this, just back in the office from being out for a week. Also, in the middle of a software audit at the moment so will get back to this ASAP. Thanks!
from processmaker.
tomolimo
commented on June 5, 2024
any news?
from processmaker.
raregtp
commented on June 5, 2024
Not yet…..project priorities shifted and I haven’t been able to swing around on this yet…..and as part of those priorities I had to move machines…..haven’t gotten all my tools reloaded yet. Still planning on getting back on this and look at the system every day.
From: tomolimo [mailto:[email protected]]
Sent: Thursday, August 31, 2017 8:32 AM
To: tomolimo/processmaker <[email protected]>
Cc: Matthew D. Baker <[email protected]>; Author <[email protected]>
Subject: Re: [tomolimo/processmaker] Ldap authentication (#27)
any news?
—
You are receiving this because you authored the thread.
Reply to this email directly, view it on GitHub<#27 (comment)>, or mute the thread<https://github.com/notifications/unsubscribe-auth/AP6qUKUTEWN1Clh-46EQXvyXRIyTUdNDks5sdrW0gaJpZM4N6Ed3>.
from processmaker.
raregtp
commented on June 5, 2024
Just wanted to reach out quick.....
Still planning on working this unless you've already discovered and/or resolved what I'm seeing. I think I can fit this in sometime in the next week or so. Also want to thank you....your instruction above gave me enough to go on to successfully debug another PHP application I've been working on outside of work. The app is a bit simpler than GLPI/Process Maker, and it involved debugging a plugin for that app related to ldap authentication. Having gained that experience I'm anxious to give this another go to see if we can nail down what's going on with my GLPI/Process Maker install.
Thanks!!
from processmaker.
tomolimo
commented on June 5, 2024
Hello,
Happy to hear that.
Please note that I'll be in holidays for 3 weeks starting next week.
regards,
Tomolimo
from processmaker.
tomolimo
commented on June 5, 2024
Hello @raregtp
Are you still working on this issue?
Did you solve it?
Thank you,
Regards,
Tomolimo
from processmaker.
tomolimo
commented on June 5, 2024
Hello,
Closed as I got no news, feel free to reopen if you need.
Thank you,
Regards,
Tomolimo
from processmaker.
Related Issues (20)
- Private comment HOT 3
- RuntimeException: session id was not set. HOT 8
- glpi stop working when processmaker plugin is enabled for the first time HOT 5
- link glpi with processmaker (processmaker plugin configuration ) HOT 43
- Cannot create process using templets HOT 3
- Is it possible to use ProcessMaker as a validation system HOT 7
- ProcessMaker GLPI HOT 6
- TICKET-PROCESSMAKER HOT 2
- processmaker-server-RE-2.0 HOT 1
- fail installation on GLPI 10.0.10 Ubuntu Server HOT 2
- Problem with GLPI_DATA HOT 27
- The first task does not finish HOT 12
- GLPI_DATA lost, when jump step HOT 1
- error when creating glpi_plugin_processmaker_documents tableYou have an error in your SQL syntax HOT 5
- error in sql-errors-log HOT 9
- Database Connection Issue in ProcessMaker Server HOT 1
- Question HOT 4
- hi. Is there an installation instruction? HOT 15
- not install plugin for GLPI HOT 7
- template HOT 3
Recommend Projects
-
 React
React
A declarative, efficient, and flexible JavaScript library for building user interfaces.
-
Vue.js
🖖 Vue.js is a progressive, incrementally-adoptable JavaScript framework for building UI on the web.
-
 Typescript
TypeScript is a superset of JavaScript that compiles to clean JavaScript output.
-
TensorFlow
An Open Source Machine Learning Framework for Everyone
-
Django
The Web framework for perfectionists with deadlines.
-
 Laravel
A PHP framework for web artisans
-
D3
Bring data to life with SVG, Canvas and HTML. 📊📈🎉
-
Recommend Topics
-
javascript
JavaScript (JS) is a lightweight interpreted programming language with first-class functions.
-
web
Some thing interesting about web. New door for the world.
-
server
A server is a program made to process requests and deliver data to clients.
-
Machine learning
Machine learning is a way of modeling and interpreting data that allows a piece of software to respond intelligently.
-
Visualization
Some thing interesting about visualization, use data art
-
Game
Some thing interesting about game, make everyone happy.
Recommend Org
-
Facebook
We are working to build community through open source technology. NB: members must have two-factor auth.
-
Microsoft
Open source projects and samples from Microsoft.
-
Google
Google ❤️ Open Source for everyone.
-
Alibaba
Alibaba Open Source for everyone
-
D3
Data-Driven Documents codes.
-
Tencent
China tencent open source team.
from processmaker.