Comments (15)
 mkborregaard
commented on May 18, 2024
mkborregaard
commented on May 18, 2024
mixeddensity allows showing a histogram when chains are discrete.
from mcmcchains.jl.
 itsdfish
commented on May 18, 2024
itsdfish
commented on May 18, 2024
Thanks for the info. In that case, I wonder if something like :pooleddensity would be useful. If not, I think we can close this issue.
from mcmcchains.jl.
 cpfiffer
commented on May 18, 2024
cpfiffer
commented on May 18, 2024
Currently I believe what you're talking about exists. Try plot(chn, colordim = :parameter) to plot pooled densities. Does this do what you've asking about?
from mcmcchains.jl.
 goedman
commented on May 18, 2024
goedman
commented on May 18, 2024
Doesn't just plot(chn) provide that?
from mcmcchains.jl.
cpfiffer
commented on May 18, 2024
plot(chn) gives you a plot for each parameter with all chains plotting for the same parameter, while plot(chn, colordim=:parameter) gives you one plot per chain and throws all the parameters on that one plot. The README has this example:
| Summarize parameters | Summarize chains |
|---|---|
plot(chn; colordim = :chain) |
plot(chn; colordim = :parameter) |
 |
 |
from mcmcchains.jl.
itsdfish
commented on May 18, 2024
Sorry for the confusion. Just to clarify my initial post, I would like to do something that is similar to density(chn[:Param1].value[:]) while maintaining the labels and settings that are used in the builtin plot functions. This would pool the samples across chains for a given parameter. As far as I can tell, none of the options discussed so far have this functionality.
from mcmcchains.jl.
cpfiffer
commented on May 18, 2024
Oh, try indexing the chain first if you only want one parameter. plot(chn[:Param1], colordim=:parameter). I think it's possible that plot(chn, :Param1, colordim=:parameter) might also work, but I'm not at a good machine to test that out right now.
from mcmcchains.jl.
itsdfish
commented on May 18, 2024
Unfortunately, that does not work. It generates a subplot for each chain. Here is a simple example based on the Turing docs:
using Distributed,StatsPlots
addprocs(4)
@everywhere using Turing, Random

@everywhere @model gdemo(x) = begin
    s ~ InverseGamma(2,3)
    m ~ Normal(0, sqrt(s))
    for i in eachindex(x)
        x[i] ~ Normal(m, sqrt(s))
    end
end

num_chains = 4
sampler = NUTS(1000, 0.65)
model = gdemo([1.2, 3.5])

chns = reduce(chainscat, pmap(x->sample(model,sampler),1:num_chains))
plot(chns[:m], colordim=:parameter)
The other issue is that there is no way to generate this type of plot for all parameters. For example, plot(chn,seriestype=:pooleddensity)
from mcmcchains.jl.
cpfiffer
commented on May 18, 2024
I guess I'm maybe not sure exactly what type of graph you're looking for. Here's the plotting output from the above code:
Overlay all the chains on top of eachother, with a plot per parameter:
density(chns[:m])
# As above, but for all parameters.
density(chns)
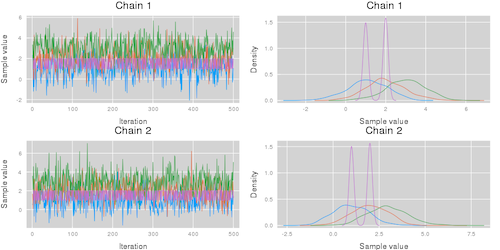
Overlay all parameters per chain together:
density(chns, colordim=:parameter, legend=true)
Which one of the above provides the functionality you'd like to see in mixeddensity?
from mcmcchains.jl.
itsdfish
commented on May 18, 2024
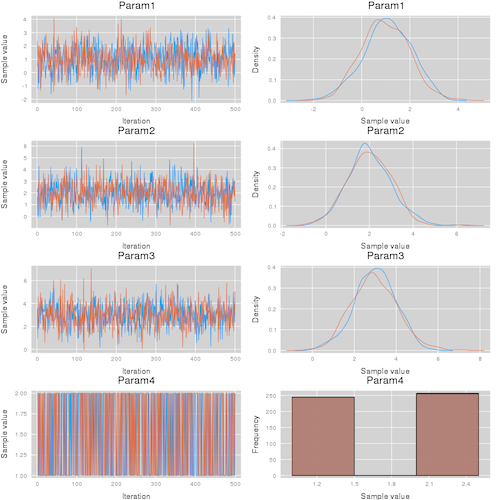
Sorry. Its clear to me now that I should have provided a more explicit example. I was thinking that something like plot(chn,seriestype=:pooleddensity) would be equivalent to
chns = reduce(chainscat, pmap(x->sample(model,sampler),1:num_chains))
p1 = density(chns[:m].value[:], title="m",ylabel="Density",xlabel="Sample value",leg=false)
p2 = density(chns[:s].value[:], title="s",ylabel="Density",xlabel="Sample value",leg=false)
p = plot(p1,p2,layout=(2,1))
The basic idea is that you can make smoother density plots by pooling the chain samples for a given parameter.

from mcmcchains.jl.
cpfiffer
commented on May 18, 2024
Ah, I understand now. I think I can put that in for you.
from mcmcchains.jl.
itsdfish
commented on May 18, 2024
Thanks and sorry again for the confusion. I'll provide better examples in the future.
from mcmcchains.jl.
goedman
commented on May 18, 2024
Another way of doing this is using the DataFrame route:
...
chns = reduce(chainscat, pmap(x->sample(model,sampler),1:num_chains))
df = DataFrame(chns, [:parameters])
p = Vector{Plots.Plot{Plots.GRBackend}}(undef, size(df, 2))
for (i, par) in enumerate(names(df))
  p[i] =density(df[par], lab="$par", xlab="Sample value", ylab="Density")
end
plot(p..., layout=(size(df, 2),1))
Above snippet works because by default the DataFrame constructor appends chains. This also applies to the Array constructor, but in this case the list of names (names(df)) is handy.
from mcmcchains.jl.
cpfiffer
commented on May 18, 2024
Thanks and sorry again for the confusion. I'll provide better examples in the future.
No problem! I'm glad we got this. I'll try and get this in this weekend. Does anyone have an issue with me adding a new keyword to the plot functions called append_chains which concatenates the chains together? I only say append_chains as the keyword since that's the convention in #79.
from mcmcchains.jl.
itsdfish
commented on May 18, 2024
Since pooleddensity has been added, I'll go ahead and close this issue.
from mcmcchains.jl.
Related Issues (20)
- Calculating acceptance rate HOT 5
- Avoiding numerical issues in `show` for problematic chains HOT 9
- Indexing a multible parameters fails HOT 1
- `corner` breaks because of `chains` usage
- `corner` fails with certain backends HOT 1
- computing mode HOT 1
- There is no easy way to get a subchain with a given set of parameters HOT 3
- Add more methods for basic summary stats for Chains HOT 3
- write(file, chn) fails due to missing method HOT 1
- corner plot displays wrong y-axes HOT 1
- chainscat error in combining single chains HOT 2
- Array(chn) drops third dimension for nchain==1 HOT 3
- Overloading PosteriorStats methods HOT 2
- Make hpd for AbstractVector public HOT 2
- names() and get() for a specific section should always return parameters in the same order
- autocorplot not working with Julia 1.10.0 rc2
- MCMCChains.get_sections broken in 6.0.4
- Simple chains throw errors when displayed HOT 3
- Formatting.jl is deprecated
- Formatting.jl is being deprecated HOT 2
Recommend Projects
-
 React
React
A declarative, efficient, and flexible JavaScript library for building user interfaces.
-
Vue.js
🖖 Vue.js is a progressive, incrementally-adoptable JavaScript framework for building UI on the web.
-
 Typescript
TypeScript is a superset of JavaScript that compiles to clean JavaScript output.
-
TensorFlow
An Open Source Machine Learning Framework for Everyone
-
Django
The Web framework for perfectionists with deadlines.
-
 Laravel
A PHP framework for web artisans
-
D3
Bring data to life with SVG, Canvas and HTML. 📊📈🎉
-
Recommend Topics
-
javascript
JavaScript (JS) is a lightweight interpreted programming language with first-class functions.
-
web
Some thing interesting about web. New door for the world.
-
server
A server is a program made to process requests and deliver data to clients.
-
Machine learning
Machine learning is a way of modeling and interpreting data that allows a piece of software to respond intelligently.
-
Visualization
Some thing interesting about visualization, use data art
-
Game
Some thing interesting about game, make everyone happy.
Recommend Org
-
Facebook
We are working to build community through open source technology. NB: members must have two-factor auth.
-
Microsoft
Open source projects and samples from Microsoft.
-
Google
Google ❤️ Open Source for everyone.
-
Alibaba
Alibaba Open Source for everyone
-
D3
Data-Driven Documents codes.
-
Tencent
China tencent open source team.
from mcmcchains.jl.