Let’s keep practicing a bit! In this case, we will retrieve stock data from an IEX Trading API, and display it on a chart.
For displaying our data, we will use a library called ChartJS, that help us to print impressive charts we few lines of code.

On our index.html we need to create a basic HTML structure and link our javascript file.
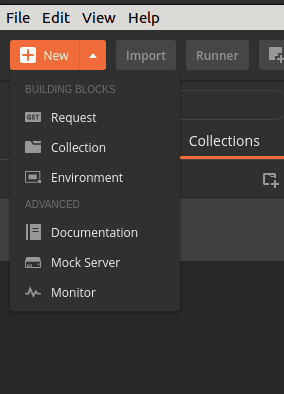
Open Postman and click on the orange button "+New" in the left corner. Create a "New Collection" called 'axios and chart.js'.
Add a request to this collection:
GETfor the URL with endpoint:https://api.iextrading.com/1.0/stock/amzn/chart
Click the Send button to send the request. Check the data you got back from the IEX Trading API in the response Body !
To get the data from the API, we need to do a GET request using Axios, so go ahead and add the Axios CDN on the <head> tag of our HTML.
<script src="https://unpkg.com/axios/dist/axios.min.js"></script>Connect you index.js with your index.html. On our script.js we should have the necessary code to make the GET request. For our example, we will check the Amazon stock price. We should send to the API, the ticket of the stock we want to get the info. For Amazon, we should use ‘amzn’.
const stockInfo  = axios.create({
  baseURL: 'https://api.iextrading.com/1.0/stock/',
});

const stockTicket = "amzn";

stockInfo.get(`${stockTicket}/chart`)
  .then(response => console.log(response))
  .catch(error => console.log(error));
Go ahead and check on the browser what are we getting from the API!

We have several ways to add ChartJS to our project. In this case, we will use the CDN, so go ahead and add it to our index.html file:
<script src="https://cdnjs.cloudflare.com/ajax/libs/Chart.js/2.4.0/Chart.min.js"></script>According to ChartJS Documentation we also need to add a canvas in our HTML file, so place it inside the body.
<canvas id="myChart"></canvas>We are ready to print our Chart. On the script.js let’s add a printTheChart() function. We will call this function after we get the data from the API, and pass that data to function.
const printTheChart = (stockData) => {
  const stockLabels = stockData.map( element => element.date);
  const stockPrice = stockData.map( element => element.close);
  const ctx = document.getElementById('myChart').getContext('2d');

  const chart = new Chart(ctx, {
    type: 'line',
    data: {
      labels: stockLabels,
      datasets: [{
        label: "Stock Chart",
        backgroundColor: 'rgb(255, 99, 132)',
        borderColor: 'rgb(255, 99, 132)',
        data: stockPrice,
      }]
    }
  });
});


stockInfo.get(`${stockTicket}/chart`)
    .then((response) => printTheChart(response.data) )
    .catch( (error) => console.log(error));
That’s it! If you navigate to the index.html on the browser, you should be able to see the chart with the data:

As you may notice, on the dataset property of the chart, we can change the background color or the border-color. We have several options to display the Chart. Do not be afraid of checking the documentation to customize it as much as you want.
Go ahead and add an input where the user can fill the ticket of any stock, and you display the data about it! You need to call the API every time the user clicks on the Submit button!


