#Is Leonardo DiCaprio going to win an Oscar at last?

Harvard University Fall 2015 CS109 Final Project
Jerry Chen, Rachel Fu, Annie Liu, Luka Zhang
##Overview and Motivation
###Motivation
The Academy Awards, more commonly known as the Oscars, is one of the most anticipated and oldest entertainment annual awards ceremonies in the world. Ever since 1929, the Oscars has honored cinematic achievements every February (usually) for 87 years. Each year, the media and cinema lovers try to predict the winners before the grand ceremony. This year, with two months to go until another exciting Oscars (the 88th), we wish to join the crowd of spectators and make our own predictions on which movie and which actors and actresses will most probably take the golden statues home.
The Oscars gives out awards in 24 categories, ranging from the most exciting Best Picture, Best Leading Actor/Actress to Best Documentary Short Subject and Best Writing. Our project tries to predict which movies are most likely to win any of the following awards in Best Picture, Directing, Best Actor in a Leading Role, Best Actress in a Leading Role, Best Actress in a Supporting Role and Best Actor in a Supporting Role.
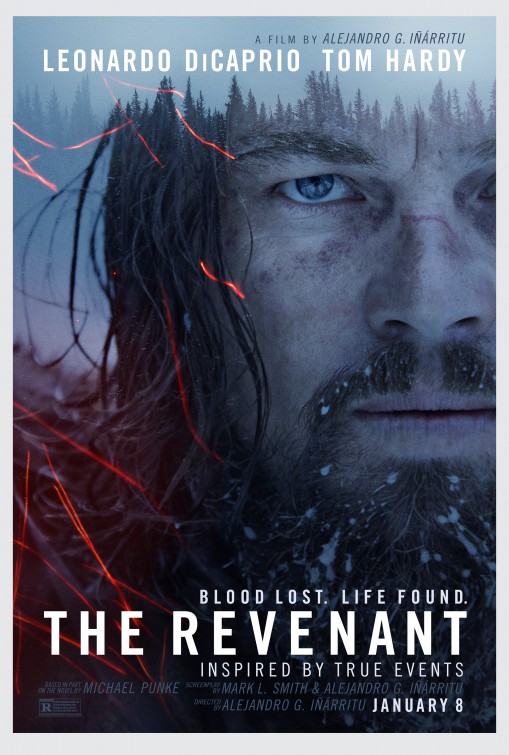
Because Leonardo DiCaprio had been nominated 5 times over the past 10 years, but has never won an Oscar yet, we take special interest in his award-outcome in the 88th Oscar next year. (He is starred in a movie "The Revenant", which is scheduled to be released on December 25, 2015.)
| Year | Leonardo DiCaprio's Oscar Nominations |
|---|---|
| 2014 | Best Performance by an Actor in a Leading Role ( The Wolf of Wall Street (2013)) |
| 2014 | Best Motion Picture of the Year ( The Wolf of Wall Street (2013)) |
| 2007 | Best Performance by an Actor in a Leading Role ( Blood Diamond (2006)) |
| 2005 | Best Performance by an Actor in a Leading Role (The Aviator (2004)) |
| 1994 | Best Actor in a Supporting Role ( What's Eating Gilbert Grape (1993) ) |
###Project Overview and Flow
In order to predict the winners of next year's Oscars, we collected data on past award winning and nominated movies, actors and actresses from IMDb, Rotten Tomatoes and Wikipedia. After obtaining the data and constructing the dataset, we explored the data and train several classification models for our predictions.
This project contains the following parts:
-
Scraping the web and creating the dataset for the prediction.
-
Exploratory Data Analysis (EDA).
-
Model fitting and training
-
Prediction results
-
Conclusions
##1. Scraping and Constructing Data Frame Before we start scraping, let's spend some time discussing the data source and the scrapping methods we used.
###1.1 A short discussion on datasource and scraping methods The scrapping contains two parts, one for all the movies, actors and actresses nominated and won before the 87th Oscars in 2015, the other for all movies that are eligible for nomination in the 88th Oscars (i.e. all movies in 2015, from midnight at the start of 1 January to midnight at the end of 31 December).
Part 1 For movies released before 2015
We started with a list of all Oscars winners and nominees in our categories of interest up to 2014. The categories are: Best Picture, Best Directing, Best Actor in a Leading Role (hereafter denoted as Best Leading Actor), Best Actress in a Leading Role (Best Leading Actress), Best Actor in a Supporting Role (Best Supporting Actor) and finally, Best Actress in a Supporting Role (Best Supporting Actress). The list is here: academy_awards. We took the list of all nominated and winning movies up to 2011 from here and manually added updated movies so that the file contains all nominated and winning movies up to 2014.
Using the list of movie titles, we scrape IMDb data using its free unofficial public API to gather information on each movie and later about their IMDb and Rotten Tomatoes attributes. We then scraped information we think that might be useful for our predictions about the three leading actors/actresses and the directors of each movie on the list. Some example features are credits, date of birth and award nominations. For details about how we scraped the data set, please see here.
We also scrapped Wikipedia for all the nominated movies, then scrapped the budget and box-office information off of Wikipedia. For details of this part of scrapping, please see the first half of scrape_wiki notebook.
Part 2 For movies released in 2015
We scrapped wikipedia page for the list of movies released in 2015 up to the date of the scrape, which is the 4th of December. After constructing the list, we scraped IMDb for information on budget and box office. Details of this scrape is in the second half of scrape_wiki notebook.
We also scrapped IMDb API for additional information on the 2015 movies. This part of the scrape is documented here.
The final output table is here. We used this as the input for our analysis.
##2. Exploratory Data Analysis (EDA). After we have our dataset, we can do some exploratory data analysis. Please see iPython notebook EDA for our complete analysis. We take excerpt of some of our results here. Please note that there is more information on the file.
First, let us look at the run time of winner and nominee movies, shown in fig 2. The green shows the runtime of the nominees and the red shows the runtime of the winners. We also plotted the mean and median of each group. The mean of nominees is 24 minutes less than the mean of the winners. The median of the nominees is 14 minutes less than that of the winners. Although the mean and median are different in each group, we cannot tell whether movie runtime is a feature that explicitly divides the winners from the nominees because the distributions are very much overlapped.

Besides runtime, we think box office and budget might also play important roles in winning Oscar. The figure below shows the box office and budget of winning and nominee movies respectively. For box-office, the winning movies tend to have a more uniform distribution than all the nominee movies in USD dollars. While for the budget, winning movies have approximately the same distribution as nominee. Therefore, box-office might be a significant feature in the model. However, it can also be that the movie has won a Oscar so more people tend to watch that movie. To deal with this issue, we should have only scarped the box office until right before the Oscar. Yet due to the time issue, we just simply scraped the box office until now.


The first plot is a comparison between the mean of the actors' age at the time of their nominations for the winners and the nominees. The second to fourth are similar comparisons. We used the same convention of using green for the nominees and red for the winners. The distributions of the two groups overlap, giving us no additional information on how to distinguish between the winners and the nominees.

To do more exploration on the data, we plot the mean credits of actors and directors in each year for each genre of movie. We can see that actors have higher credits than directors in general. By looking at the percentage of genre for nominated and winning movies, we can have some general idea of what kind of genres has larger chance of winning. For example, 'Drama' and 'Romance' have higher chance of being nominated and winner.


Just for fun, we also plotted two world maps to show where are the actors and directors come from. Most of the actors and directors are from America and Europe, which makes sense because most of the movies in our data come from Hollywood.
Directors geography

Actors geography

##3. Model Fitting and Training After constructing our data, we are in shape for making predictions on which of the movies in 2015 are most likely to win at least one Oscars in the five hottest categories (Best Picture, Directing, Best Actor in a Leading Role, Best Actress in a Leading Role, Best Actress in a Supporting Role and Best Actor in a Supporting Role). Now we train several classifiers on the data set to find the best one and then use the the results to predict which movies are most likely to win the Oscars in 2016. First we spent some time cleaning the data set, splitted it into training and testing sets, then we started testing for classifiers.
Please see iPython notebook Model for our complete analysis.
We selected 154 relavent features to put in our models. The features variable contains all the features we think would matter for predicting Academy awards. They are:
Movie run time, Movie release year, Rating score from IMDb, Number of votes on IMDb, Rating score from Rotten Tomatoes (critics), Number of reviews from Rotten Tomatoes (critics), User rating score from Rotten Romatoes, Number of user reviews from Rotten Tomatoes, Indicator variables of movie genres, Movie budget in USD, Movie Box Office until Dec. 4th, 2015 in USD, Cast mean age, Cast mean credit (average number of movies featured by actors in the cast), Director mean age, Director mean credit (average number of movies directed by the directors), Weighted average of ratings on IMDb and Rotten Tomato, Total nominations of cast, Total Academy awards won by the cast, Total nominations of directors, Total Academy awards won by the directors, Indicator variables of languages,Indicator variables of countries, Indicator variables of ratings.
Here's a summary of our model fitting results and prediction results.
###3.1 Baseline Like any other model training project, we gave a baseline model, which is that no movie wins the Oscars. Since only 20% of the films in our data set have won the one of the awards, this baseline gave us an accuracy of 80% on the whole dataset. The accuracy score of the baseline on the test set and the training set is also the percentage of no-award movies. The accuracy score on the training set is 79.8% and the accuracy score on the test set is 83.7%. Therefore we had to bear in mind that accuary might not be a good criteria for a good model.
###3.2 SVM Then we spent much time in training several varieties of SVM models.
####3.2.1 Linear SVM We set up a classifier using LinearSVC. This algorithm implements a linear SVM. We explicitly passed the standard SVM hinge loss. This was only the initial step of the list of SVM classifiers we tried.
The classification returned accuracy on the training data is 0.80 and accuracy on test data is 0.84. From the confusion matrix, we see that this model is similar to predicting that no movie wins the award. Therefore, when we fit the model on the 2015 data and predict the winners for the 88th Oscar, we might have no winning movie. This is indeed the case.
####3.2.2 Feature Select SVM We will use feature select SVM in this part of our analysis. This model selected 25 most important features and fits linear SVM classifier using the selected features.
This model does not do much better than the previous Linear SVM with all features one, score-wise. This model still predict that all movies earn no award.
####3.2.3 Linear SVM on Balanced Set One of the reasons for this is that SVM does not do terribly well on an unbalanced data set, so now we balance training set to test set for training. Because there are many more negative samples in the training set. We want to balance the negative samples to the positive samples. So we concatenate all the indexes and use them to select a new training set from the old one.
After constructing a balanced training set at hand, we now train the linear SVM on the balance set and on all features. Note that this does not fit the real world scenario because there are a lot more movies that didn't have any Oscar awards the those who wins than award. However, for the sake of giving us some non-trivial prediction, we tested out this model. Notice that because we have balanced the training set, the accuracy score on the training set is now 0.5, and the accuracy score on the test data is 0.16, which suggests the model now predicts that all movies win the award. This does not give us much predictive confidence. This model also predicts 0 winner.
####3.2.4 RBF Based Pipelined (feature-selected) SVM on the Subsampled Balanced Set Let us try a Radial Basis Function (RBF) Kernel, so that we are not restricted to the linear SVM. Note that we use the sub-sampled set here.
This model gives us some result. Notice that the model no longer predicts no winning movies, the accuracy on training data: 0.70 and accuracy on test data: 0.66. The precision score on the positive test set is now 0.23, which is an improvement from the 0 in previous models. However, when we implemented the model on the training set, we still got no positive prediction.
####3.2.5 Refit RBF on the Entire Balanced Data Set Rather than fitting RBF on the sub-sampled data set, we tried to fit it on the balanced data set and see if we do any better. We got accuracy on training data: 0.59 and accuracy on test data: 0.64. The precision on the positive test sets is 0.24. We get 0 winner from this model.
####3.2.6 SVM with Polynomial Degree 10 In this final SVM model fitting, we tried the SVM model with Polynomial with degree 10. Note: In the process of finding the best degree, we tried several degrees and find that they do not make much difference when the degree is larger than 3.
The accuracy score and the precision score from this model is not much different from the previous one, therefore, there was no surprise that we see no positive prediction when we fit the model to the 2015 data.
Finally, we made a ROC curve comparison of all of our models. Notice that the linear SVM with all features gives the best ROC curve. Then we plotted the ROC curve of the Linear SVM model. Notice that our curve is discrete rather than smoothly curved. This means that the model can only provide discrete predictions, rather than a continuous score, due to the lack of samples wo have and the small number of continuous features we have.

###3.3. Logistic With the SVMs failing to predict positive results, we tried Logistic Regression. Then we used the data balancing technique on logistics. The accuracy on training data is 0.68 and the accuracy on test data is 0.64. The precision score also improveed. It is now 0.92 on the negative test set and 0.27 on the positive test set. We should be able to make positive predictions on the 2015 data set.
Note that our dataset is extremely unbalanced. Therefore we should not accept the default threshold value of 0.5, but should set it to a lower value. By setting the threshold value to be 0.2, which is approximately the same as the percentage of positive samples in our training data set. We make all the movies that are predicted to win into a dataframe. We will present the result in Part 4 below.
We also make a comparison of the ROC curves.
By comparing the best-performing SVM ROC curve with the highest AUC with the logistics model, we can see that the logistics model performs better based on the ROC curve. Also, the ROC curve of Logistics is smoother than that of the SVM.

##3.4. Random Forest and Ensemble Methods Besides logistics regression and Random forest, we also try to use random forest and ensemble methods for prediction.
####3.4.1 Random Forest and Ensemble Methods Recall from class that the random forest technique works by aggregating the results from a number of randomly perturbed decision trees constructed to explain the data.
Below in Part 4, below are the movies predicted to win from the random forest model, there are 22 in total. There is almost no overlap between the predictions from logistics model. It indicates that our models are not consistent with the predictions, therefore lower the reliability of the predictions. Also, the predictions from random forest are not stable. In other words, the movies being predicted are not the same everytime.
####3.4.2 Relative Importance Following the standard procedure of random forest, we plot out the relative importance of features. We can see that tomatoUserReviews, Year, Runtime and A_mean_age are among the top important features.

####3.4.3 AdaBoost Classifier We also use the AdaBoost classifier from the lab to make prediction to see if there is any difference. The method gives us no positive predictions on the 2015 data set.
Therefore, we used SVM, logistics regression, Random forest and AdaBoost classifier to make our predictions. Only logistics and random forest gave us some movie predictions.
##4. Prediction results As mentioned in Part 3, we only have positive predictions when we use Logistic and Random Forest. We will now list them below. Please be reminded that we are asking the question: which movies are most likely to win at least one award from the five categories: Best Picture, Directing, Best Actor in a Leading Role, Best Actress in a Leading Role, Best Actress in a Supporting Role and Best Actor in a Supporting Role.
####Logistic Prediction
| Poster |  |
 |
 |
| Movie | Avengers: Age of Ultron | Muhammad: The Messenger of God | The Hateful Eight |
| Probability of winning | 0.388707757 | 0.327404359 | 0.287890063 |
| Poster |  |
 |
 |
| Movie | The Martian | Furious 7 | Straight Outta Compton |
| Probability of winning | 0.270072195 | 0.254411701 | 0.238794011 |
| Poser |  |
 |
 |
| Movie | Mad Max: Fury Road | Jurassic World | Spectre |
| Probability of winning | 0.214512094 | 0.204840498 | 0.197618822 |
| Poser |  |
 |
 |
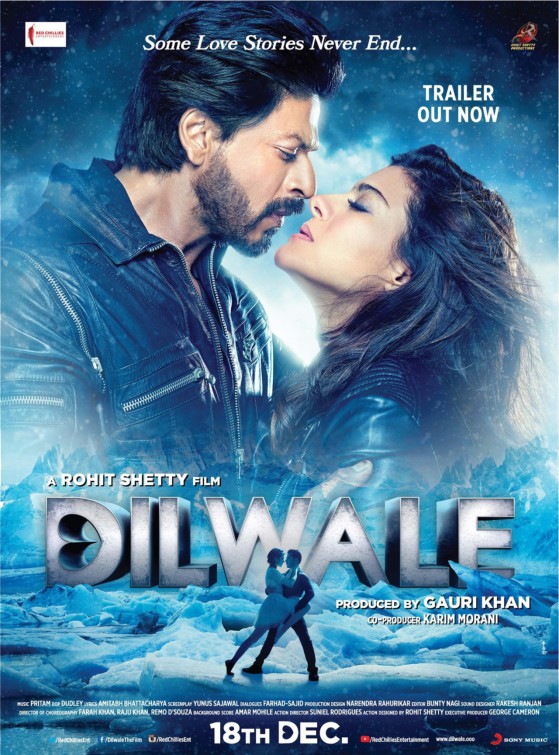
| Movie | Bridge of Spies | Dilwale | Mission: Impossible - Rogue Nation |
| Probability of winning | 0.191980406 | 0.164262945 | 0.163706043 |
| Poser | 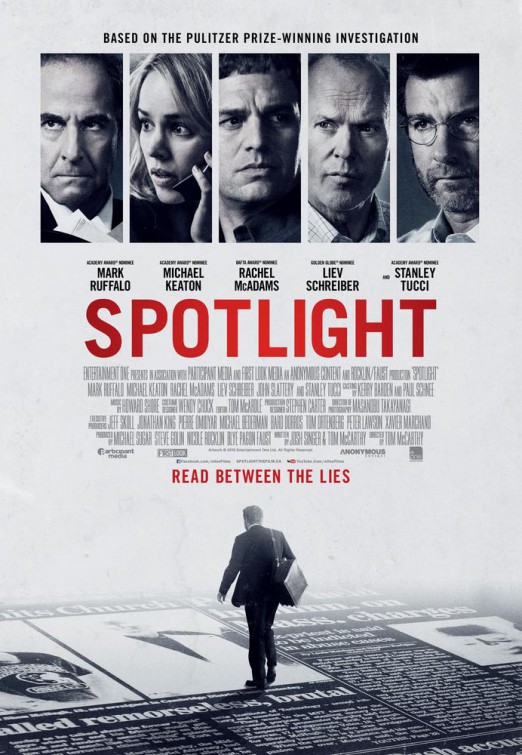 |
 |
|
| Movie | Spotlight | The Revenant | |
| Probability of winning | 0.162100329 | 0.156593219 |
####Random forest predictions
| / | Movie |
|---|---|
| 1 | Ex Machina |
| 2 | Child 44 |
| 3 | Black Mass |
| 4 | Straight Outta Compton |
| 5 | Fantastic Four |
| 6 | Vacation |
| 7 | Anomalisa |
| 8 | Creed |
| 9 | Sleeping with Other People |
| 10 | Room |
| 11 | The Diary of a Teenage Girl |
| 12 | Insidious: Chapter 3 |
| 13 | Captive |
| 14 | American Ultra |
| 15 | The Walk |
| 16 | Amnesia |
| 17 | Son of Saul |
| 18 | Muhammad: The Messenger of God |
| 19 | The Gift |
| 20 | Embrace of the Serpent |
| 21 | Jackpot |
| 22 | 7 Letters |
##5. Conclusion
We tried SVMs, Logistic Regression, Random Forest and Ensemble Methods, along with some variations of these machine learning algorithms. Only Logistic Regression and Random Forest produced nontrivial results which are different from the baseline model. We were not able to produce as strong of a classifier as we would have expected, maybe because our training dataset is very unbalanced and many of our features are indicator variables. However, during the analysis, we were able to discover various implications about what features a winning movie would likely to have. Some strong predictors are mean actor credits, run time and Genres and in general, a movie is more likely to win an award if its genre is, for example, "Drama" or "Adventure" (rather than "Honor"), and when its leading actors or actresses have more credits(more experienced and famous is usually the case) and when the movie is longer in length. From the variable importance score that Random Forest generated, we can also conclude that audience rating plays an important role in predicting the awards as well. We also did a simple feature exploration on all the final predicted moives, it can be viewed here. Note that now our response variable is winning one of the five awards, and this mixing of responses might introduce confounding problems among the predictors. For future work, we could split the response into five awards separately and conduct model fitting on each of these award category. We also need to gather more quantitative features and take more efforts in building and selecting features.
Since the movie 'The Revenant' is one of our predicted winning movies, Leonardo still has a chance this year.
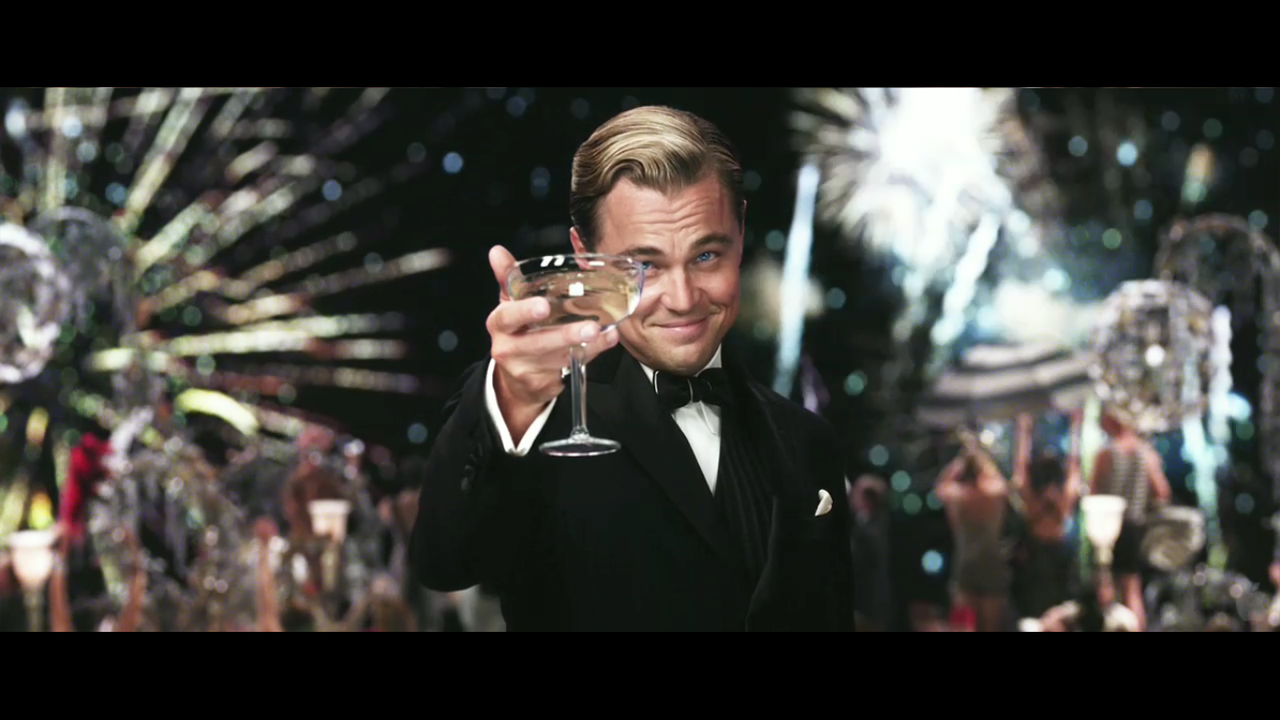
###Image Credits: http://www.impawards.com/2015/posters/avengers_age_of_ultron_ver27.jpg http://4.bp.blogspot.com/-dWKxl5CJAY0/VeCQF9A_UvI/AAAAAAAArbA/sFVWhHPmvOk/s1600/Muhammad_-_The_Messenger_of_God_poster.jpg http://www.impawards.com/2015/posters/hateful_eight_ver2.jpg http://www.impawards.com/2015/posters/martian.jpg http://www.impawards.com/2015/posters/furious_seven_ver3.jpg http://www.impawards.com/2015/posters/straight_outta_compton.jpg http://www.impawards.com/intl/australia/2015/posters/mad_max_fury_road.jpg http://www.impawards.com/2015/posters/jurassic_world_ver2_xlg.jpg http://www.impawards.com/2015/posters/spectre_ver3.jpg http://www.impawards.com/2015/posters/bridge_of_spies.jpg http://www.impawards.com/intl/india/2015/posters/dilwale.jpg http://www.impawards.com/2015/posters/mission_impossible__rogue_nation_ver2.jpg http://www.impawards.com/2015/posters/spotlight_ver2.jpg http://www.impawards.com/2015/posters/revenant_ver2.jpg http://www.tasteofcinema.com/wp-content/uploads/2014/08/best-Leonardo-DiCaprio-movies.jpg http://umlconnector.com/wp-content/uploads/AE-Sad-Leo.png http://moviecitynews.com/wp-content/uploads/2013/09/gatsby-frame.png


