You work for the data science team at STEDI, a small startup focused on assessing balance for seniors. STEDI has an application that collects data from seniors during a small exercise. The user logs in and then selects the customer they are working with. Then the user starts a timer and clicks a button with each step the senior takes. When the senior has reached 30 steps, their test is finished. The data transmitted enables the application to monitor seniors’ balance risk.
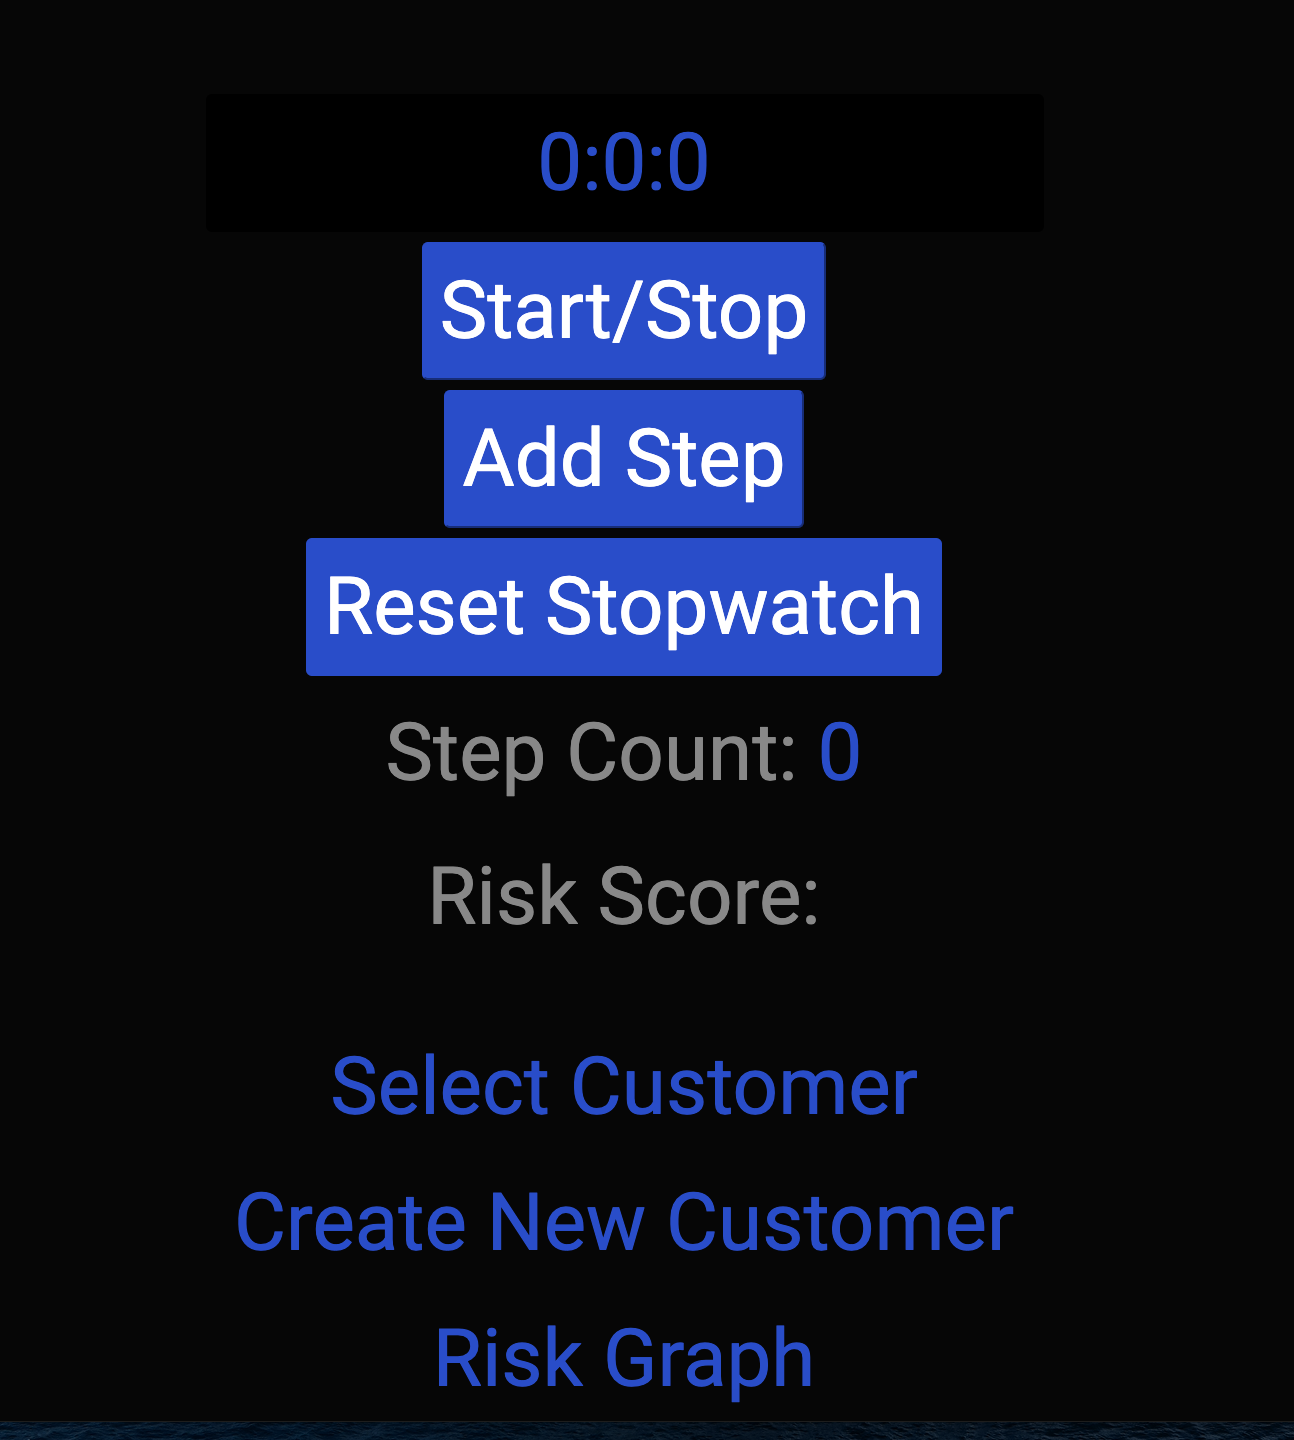
STEDI Application
Your product manager has requested a graph that shows fall risk (will they fall and become injured?) for recent assessments. The development team has built a graph, which is ready to receive risk information from Kafka:
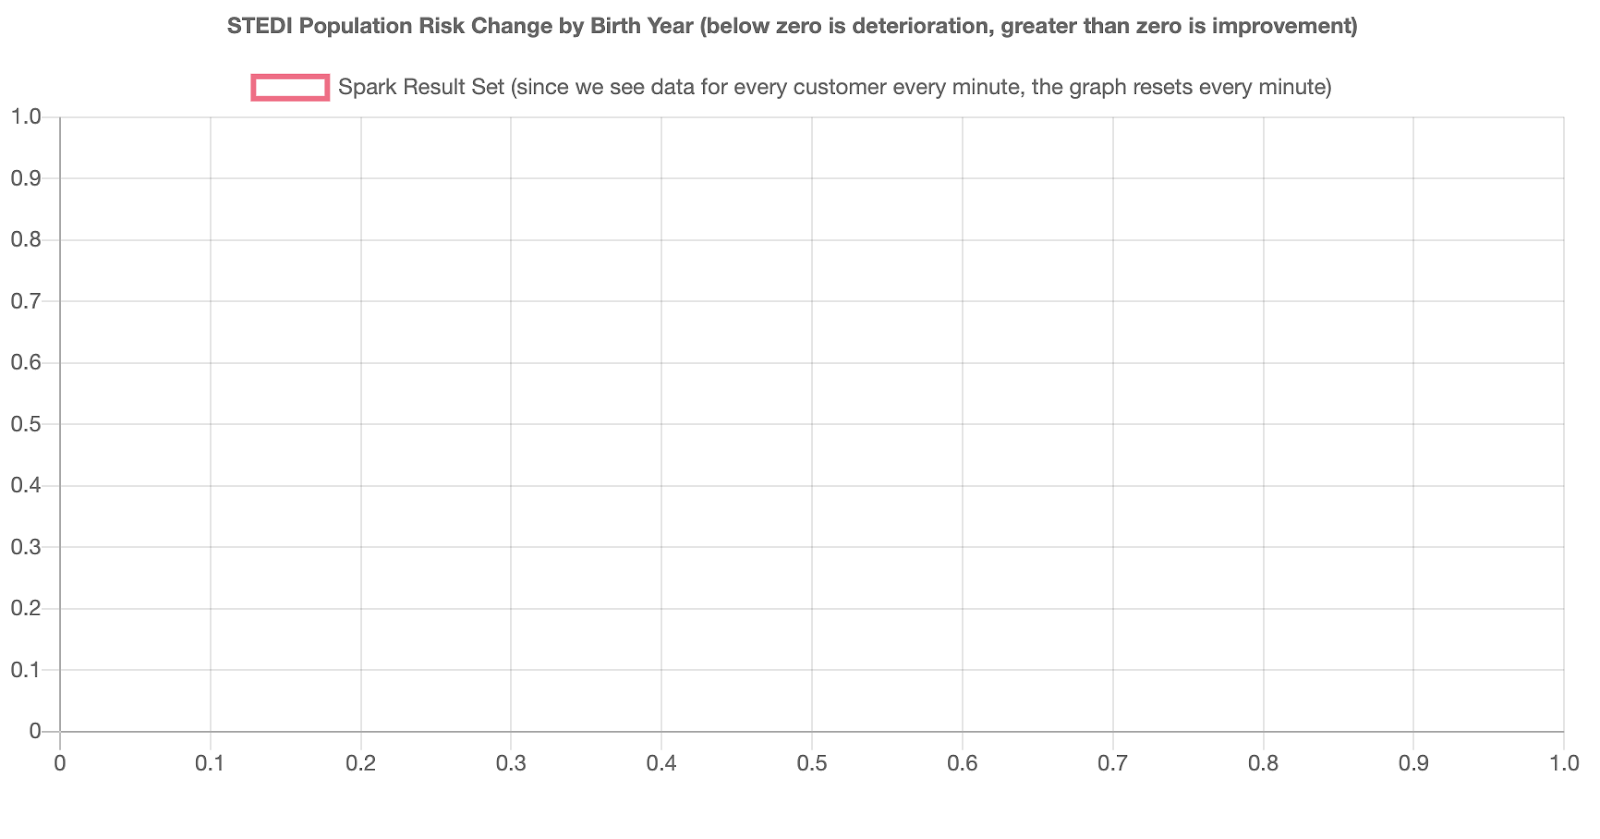
STEDI Risk Graph

The STEDI data science team has configured some real-time data sources using Kafka Connect. One of those data sources is Redis. When a customer is first assessed in the STEDI application, their record is added to a sorted set called Customer in Redis. Redis is configured as a Kafka source and whenever any data is saved to Redis (including Customer information), a payload is published to the Kafka topic called redis-server.
The application development team has programmed certain business events to be published automatically to Kafka. Whenever a customer takes an assessment, their risk score is generated, as long as they have four or more completed assessments. The risk score is transmitted to a Kafka topic called stedi-events as a JSON object with this format:
{"customer":"[email protected]","score":7.0,"riskDate":"2020-09-14T07:54:06.417Z"}
The application development team was not able to complete the feature as the graph is currently not receiving any data. Because the graph is currently not receiving any data, you need to generate a new payload in a Kafka topic and make it available to the STEDI application to consume.
The first step to setting up your local workspace is to clone the GitHub repository:
git clone [email protected]:udacity/nd029-c2-apache-spark-and-spark-streaming-starter.git
It is HIGHLY recommended to install the 10 October 2020 Update: https://support.microsoft.com/en-us/windows/get-the-windows-10-october-2020-update-7d20e88c-0568-483a-37bc-c3885390d212
You will then want to install the latest version of Docker on Windows: https://docs.docker.com/docker-for-windows/install/
You will need to use Docker to run the project on your own computer. You can find Docker for your operating system here: https://docs.docker.com/get-docker/
It is recommended that you configure Docker to allow it to use up to 2 cores and 6 GB of your host memory for use by the course workspace. If you are running other processes using Docker simultaneously with the workspace, you should take that into account also.
The docker-compose file at the root of the repository creates 9 separate containers:
- Redis
- Zookeeper (for Kafka)
- Kafka
- Banking Simulation
- Trucking Simulation
- STEDI (Application used in Final Project)
- Kafka Connect with Redis Source Connector
- Spark Master
- Spark Worker
It also mounts your repository folder to the Spark Master and Spark Worker containers as a volume /home/workspace, making your code changes instantly available within to the containers running Spark.
Let's get these containers started!
cd [repositoryfolder]
docker-compose up
You should see 9 containers when you run this command:
docker ps
Written with StackEdit.


