This repository contains scripts to analyze publicly available log data sets (HDFS, BGL, OpenStack, Hadoop, Thunderbird, ADFA, AWSCTD) that are commonly used to evaluate sequence-based anomaly detection techniques. The following sections show how to get the data sets, parse and group them into sequences of event types, and apply some basic anomaly detection techniques. If you use any of the resources provided in this repository, please cite the publications stated at the end of this ReadMe.
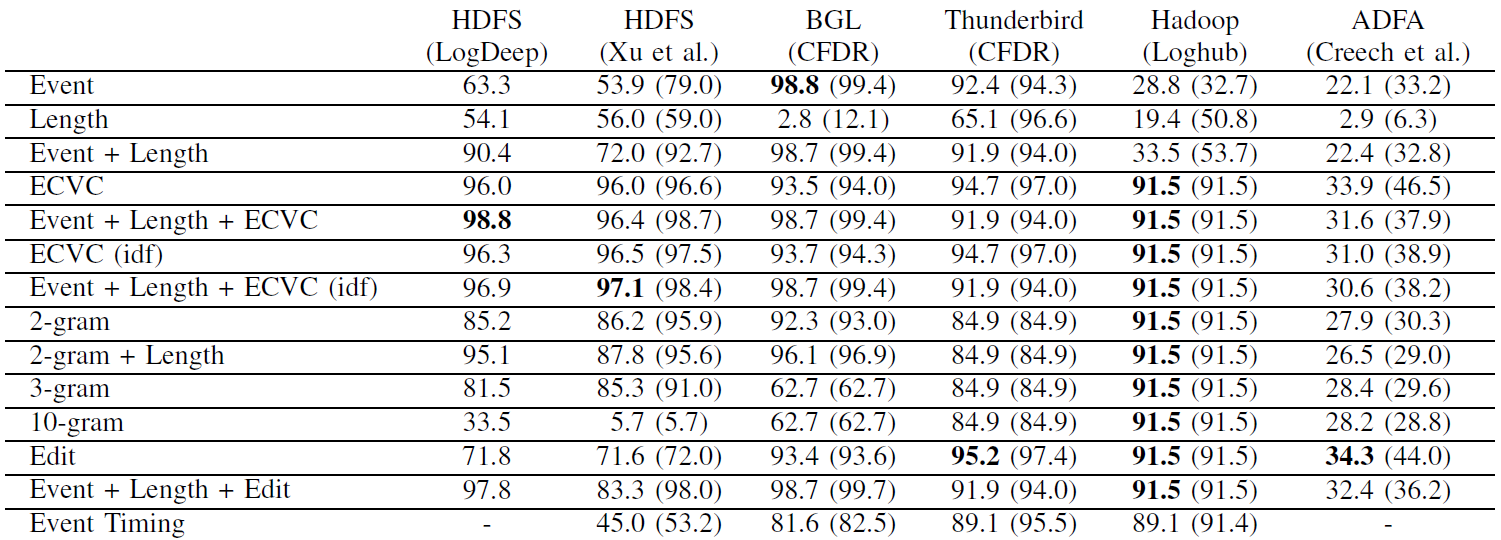
The repository comes with some pre-processed samples in each data set directory, which allow to get started without having to download all the data sets. These files are named <dataset>_train (which contains approximately 1% of all normal log sequences for training), <dataset>_test_normal (which contains the remaining normal log sequences for testing), and <dataset>_test_abnormal (which contains all anomalous log sequences). Running the anomaly detection techniques on these samples yield the following F1 scores (averaged over 25 runs; highest score in bold; maximum in brackets):
There are three versions of this data set: The original logs from Wei Xu et al., and two alternative versions from Loghub and LogDeep.
The original logs can be retrieved from Wei Xu's website as follows.
cd hdfs_xu/
wget http://iiis.tsinghua.edu.cn/~weixu/demobuild.zip
unzip demobuild.zip
gunzip -c data/online1/lg/sorted.log.gz > sorted.log
Fore more information on this data set, see
- Xu, W., Huang, L., Fox, A., Patterson, D., & Jordan, M. I. (2009, October). Detecting large-scale system problems by mining console logs. In Proceedings of the ACM SIGOPS 22nd symposium on Operating systems principles (pp. 117-132).
Another version of this data set is provided by Loghub. Note that some lines appear to be missing from the original logs.
cd hdfs_loghub/
wget https://zenodo.org/record/3227177/files/HDFS_1.tar.gz
tar -xvf HDFS_1.tar.gz
For more information on Loghub, see
- He, S., Zhu, J., He, P., & Lyu, M. R. (2020). Loghub: a large collection of system log datasets towards automated log analytics. arXiv preprint arXiv:2008.06448.
A pre-processed version of the data set is provided in the LogDeep repository. Note that timestamps and sequence identifiers are missing from this data set.
cd hdfs_logdeep/
git clone https://github.com/donglee-afar/logdeep.git
mv logdeep/data/hdfs/hdfs_t* .There are two versions of this data set: CFDR and Loghub.
The original logs from the Computer Failure Data Repository can be retrieved as follows.
cd bgl_cfdr/
wget http://0b4af6cdc2f0c5998459-c0245c5c937c5dedcca3f1764ecc9b2f.r43.cf2.rackcdn.com/hpc4/bgl2.gz
gunzip bgl2.gz
Fore more information on this data set, see
- Oliner, A., & Stearley, J. (2007, June). What supercomputers say: A study of five system logs. In 37th annual IEEE/IFIP international conference on dependable systems and networks (DSN'07) (pp. 575-584). IEEE.
An alternative version of this data set is provided by Loghub. Note that some logs have different labels in this data set.
cd bgl_loghub/
wget https://zenodo.org/record/3227177/files/BGL.tar.gz
tar -xvf BGL.tar.gz
For more information on Loghub, see
- He, S., Zhu, J., He, P., & Lyu, M. R. (2020). Loghub: a large collection of system log datasets towards automated log analytics. arXiv preprint arXiv:2008.06448.
There are two versions of this data set: The ones provided Loghub and an updated version by Kalaki et al. that addresses some problems.
The original OpenStack logs are not available anymore; however, Loghub provides a version of this data set.
cd openstack_loghub/
wget https://zenodo.org/record/3227177/files/OpenStack.tar.gz
tar -xvf OpenStack.tar.gz
For more information on this data set, see
- Du, M., Li, F., Zheng, G., & Srikumar, V. (2017, October). Deeplog: Anomaly detection and diagnosis from system logs through deep learning. In Proceedings of the 2017 ACM SIGSAC conference on computer and communications security (pp. 1285-1298).
- He, S., Zhu, J., He, P., & Lyu, M. R. (2020). Loghub: a large collection of system log datasets towards automated log analytics. arXiv preprint arXiv:2008.06448.
Since the original logs are known to be difficult to use for anomaly detection, Kalaki et al. provide an updated version.
cd openstack_parisakalaki/
git clone https://github.com/ParisaKalaki/openstack-logs.git
For more information on this data set, see
- Kalaki, P. S., Shameli‐Sendi, A., & Abbasi, B. K. E. (2023). Anomaly detection on OpenStack logs based on an improved robust principal component analysis model and its projection onto column space. Software: Practice and Experience, 53(3), 665-681.
The original Hadoop logs are not available anymore; however, Loghub provides a version of this data set.
cd hadoop_loghub/
wget https://zenodo.org/record/3227177/files/Hadoop.tar.gz
mkdir logs
tar -xvf Hadoop.tar.gz -C logs
For more information on this data set, see
- Lin, Q., Zhang, H., Lou, J. G., Zhang, Y., & Chen, X. (2016, May). Log clustering based problem identification for online service systems. In Proceedings of the 38th International Conference on Software Engineering Companion (pp. 102-111).
- He, S., Zhu, J., He, P., & Lyu, M. R. (2020). Loghub: a large collection of system log datasets towards automated log analytics. arXiv preprint arXiv:2008.06448.
The original logs from the Computer Failure Data Repository can be retrieved as follows.
cd thunderbird_cfdr/
wget http://0b4af6cdc2f0c5998459-c0245c5c937c5dedcca3f1764ecc9b2f.r43.cf2.rackcdn.com/hpc4/tbird2.gz
gunzip tbird2.gz
For more information on this data set, see
- Oliner, A., & Stearley, J. (2007, June). What supercomputers say: A study of five system logs. In 37th annual IEEE/IFIP international conference on dependable systems and networks (DSN'07) (pp. 575-584). IEEE.
The verazuo repository provides a labeled version of this data set.
cd adfa_verazuo/
git clone https://github.com/verazuo/a-labelled-version-of-the-ADFA-LD-dataset
unzip a-labelled-version-of-the-ADFA-LD-dataset/ADFA-LD.zip -d .
For more information on this data set, see
- Creech, G., & Hu, J. (2013, April). Generation of a new IDS test dataset: Time to retire the KDD collection. In 2013 IEEE Wireless Communications and Networking Conference (WCNC) (pp. 4487-4492). IEEE.
The DjPasco repository provides a labeled version of this data set.
cd awsctd_djpasco/
git clone https://github.com/DjPasco/AWSCTD.git
p7zip -d AWSCTD/CSV.7z
For more information on this data set, see
- Čeponis, Dainius, and Nikolaj Goranin. Towards a robust method of dataset generation of malicious activity for anomaly-based HIDS training and presentation of AWSCTD dataset. Baltic Journal of Modern Computing 6, no. 3 (2018): 217-234.
To parse the data, run the respective <dataset>_parse.py script. For example, use the following command to parse the HDFS log data set:
python3 hdfs_parse.pyThe templates used for parsing are taken from Logpai/Logparser and adapted or extended to make sure that all logs are parsed and that each log event only fits into to one template. The Thunderbird log data set is an exception; due to the complexity and length of the data set, we used our aecid-incremental-clustering and aecid-parsergenerator to generate event templates, however, some of them are overly specific or generic and log lines may match multiple events. If you create a better templates file for the entire Thunderbird data set, we kindly ask you to contribute to this repository by creating a pull request or contact us via [email protected].
This splits data sets in training files (only containing normal sequences) as well as test files containing normal and anomalous sequences respectively. There are two ways of sampling the data sets. First, samples can be generated from the parsed logs - this requires that the raw data sets are available and the <dataset>_parse.py script has been executed as described in the previous section. Second, in case that the templates have not changed and the sampled files already exist, it is also possible to just shuffle the normal training and test logs and thereby generate new samples.
Run the sample.py script and specify the directory of the log data to be sampled. Moreover, the sampling ratio can be specified. For example, use the following command to sample the HDFS log data set so that the training file comprises 1% of the normal events.
python3 sample.py --data_dir hdfs_xu --train_ratio 0.01This will generate the files <dataset>_train, <dataset>_test_normal, and <dataset>_test_abnormal in the respective directory. In case that fine-granular anomaly labels are available, use --anomaly_types True to also generate <dataset>_test_abnormal_<anomaly>, which contain only those sequences that correspond to the respective anomaly class. Use the sample_ratio parameter in case that only a fraction of all (both normal and anomalous) sequences should be used; they will be randomly sampled. Use the time_window parameter in case that time windows should be used for grouping instead of sequence identifiers, e.g., --time_window 3600 generates sequences by grouping events in time windows of 1 hour independent from any available sequence identifiers. By default, random sequences are selected; in case that only the first ones (i.e., the ones that occur first in the parsed.csv) should be used for training, use the --sort chronological parameter.
Running the sample_shuffle.py script is a faster approach of generating samples that requires that correctly generated samples are already available. The script is executed with the following command.
python3 sample_shuffle.py --data_dir hdfs_xu --train_ratio 0.01This will read in all normal sequences from <dataset>_train and <dataset>_test_normal, shuffle them, and overwrite both files with new samples.
Run the analysis script to output some basic information about the data sets, specifically regarding the distributions of normal and anomalous samples. The script will also show the most frequent normal and anomalous sequences and count vectors; the number of displayed samples is specified with the show_samples parameter.
python3 analyze.py --data_dir hdfs_xu --show_samples 3

Load parsed sequences ...
Parsed lines total: 12580989
Parsed lines normal: 12255230 (97.4%)
Parsed lines anomalous: 325759 (2.6%)
Event types total: 33
Event types normal: 20 (60.6%)
Event types anomalous: 32 (97.0%)
Sequences total: 575061
Sequences normal: 558223 (97.1%)
Sequences anomalous: 16838 (2.9%)
Unique sequences: 26814 (4.7%)
Unique sequences normal: 21690 (80.9%)
Unique sequences anomalous: 5133 (19.1%)
Sequences labeled normal that also occur as anomalous: 14 (0.003%), 9 unique
Sequences labeled anomalous that also occur as normal: 17 (0.101%), 9 unique
Common normal sequences:
73691: ('5', '5', '5', '22', '11', '9', '11', '9', '11', '9', '26', '26', '26', '23', '23', '23', '30', '30', '30', '21', '21', '21')
40156: ('5', '22', '5', '5', '11', '9', '11', '9', '11', '9', '26', '26', '26', '23', '23', '23', '30', '30', '30', '21', '21', '21')
37788: ('5', '5', '22', '5', '11', '9', '11', '9', '11', '9', '26', '26', '26', '23', '23', '23', '30', '30', '30', '21', '21', '21')
Common anomalous sequences:
1643: ('5', '22')
1361: ('22', '5', '5', '7')
1307: ('22', '5')
Unique count vectors: 666 (2.5% of unique sequences or 0.1% of all sequences)
Unique count vectors normal: 257 (38.6%)
Unique count vectors anomalous: 418 (62.8%)
Count vectors labeled normal that also occur as anomalous: 230 (0.041%), 9 unique
Count vectors labeled anomalous that also occur as normal: 316 (1.877%), 9 unique
Common normal count vectors:
300011: (('11', 3), ('21', 3), ('22', 1), ('23', 3), ('26', 3), ('30', 3), ('5', 3), ('9', 3))
96316: (('11', 3), ('22', 1), ('26', 3), ('5', 3), ('9', 3))
21127: (('11', 3), ('21', 3), ('22', 1), ('23', 3), ('26', 3), ('3', 1), ('30', 3), ('4', 2), ('5', 3), ('9', 3))
Common anomalous count vectors:
3225: (('22', 1), ('5', 2), ('7', 1))
3182: (('11', 3), ('20', 1), ('21', 3), ('22', 1), ('23', 3), ('26', 3), ('30', 3), ('5', 3), ('9', 3))
2950: (('22', 1), ('5', 1))
Number of distinct events following any event in normal sequences: Average: 8.86 Stddev: 4.91
Number of distinct events following any event in all sequences: Average: 10.03 Stddev: 6.96
Processed events: 12580989
Lempel-Ziv complexity: 70847
Number of bits to represent all sequences before encoding: 75485934.0
Number of bits to represent all sequences after encoding: 7931677.0
Compression ratio: 89.49%
Entropy of ngrams:
 - n=1: Number of 1-grams: 33, H=3.24, H_norm=0.64
 - n=2: Number of 2-grams: 319, H=4.38, H_norm=0.43
- n=3: Number of 3-grams: 1257, H=5.41, H_norm=0.36The evaluate script provides some basic anomaly detection mechanisms, in particular, detection based on new event types, sequence lengths, event count vectors, n-grams, edit distance, and event inter-arrival times. For timing-based detection it is necessary to download the data sets and run the respective <dataset>_parse.py script, because timestamp information is not available in the pre-processed logs. If the parsed.csv file is available, the time-based detector can be enabled by setting --time_detection True. The following output shows the results of running the evaluation script on the HDFS logs, where a maximum F1 score of 95.76% is achieved by detection based on count vectors.
python3 evaluate.py --data_dir hdfs_xu

New event detection
 Time=0.44497013092041016
 TP=6065
 FP=95
 TN=552545
 FN=10773
 TPR=R=0.36019717306093363
 FPR=0.0001719021424435437
 TNR=0.9998280978575564
 P=0.984577922077922
 F1=0.5274371684494303
 ACC=0.980915856275396
 MCC=0.5895657230081826

Sequence length detection
 Time=0.11799049377441406
 TP=6232
 FP=56
 TN=552584
 FN=10606
 TPR=R=0.37011521558379856
 FPR=0.0001013317892298784
 TNR=0.9998986682107701
 P=0.9910941475826972
 F1=0.5389604773847617
 ACC=0.9812775910570734
 MCC=0.5997920384634181

New events + sequence length detection
 Time=0.5629606246948242
 TP=9034
 FP=148
 TN=552492
 FN=7804
 TPR=R=0.5365245278536643
 FPR=0.00026780544296467864
 TNR=0.9997321945570353
 P=0.9838815072968852
 F1=0.6943889315910838
 ACC=0.9860363350296236
 MCC=0.7212100247967879

Count vector clustering
 Threshold=0.06
 Time=3.152735471725464
 TP=16674
 FP=1373
 TN=551267
 FN=164
 TPR=R=0.9902601259056895
 FPR=0.0024844383323682686
 TNR=0.9975155616676318
 P=0.9239208732753367
 F1=0.9559409488318762
 ACC=0.9973010370901071
 MCC=0.9551611400464348

Count vector clustering with idf
 Threshold=0.11
 Time=3.234915018081665
 TP=16646
 FP=1283
 TN=551357
 FN=192
 TPR=R=0.9885972205725145
 FPR=0.002321583671105964
 TNR=0.9976784163288941
 P=0.9284399576105751
 F1=0.9575747116518538
 ACC=0.9974099087234274
 MCC=0.9567415416969752

2-gram detection
 Threshold=0.02
 Time=4.8256494998931885
 TP=13535
 FP=1311
 TN=551329
 FN=3303
 TPR=R=0.8038365601615394
 FPR=0.002372249565720903
 TNR=0.9976277504342791
 P=0.9116933854236832
 F1=0.8543744476707487
 ACC=0.9918978432880639
 MCC=0.8520074824446313

3-gram detection
 Threshold=0.02
 Time=4.991070032119751
 TP=15715
 FP=3273
 TN=549367
 FN=1123
 TPR=R=0.9333056182444471
 FPR=0.005922481181239143
 TNR=0.9940775188187608
 P=0.8276279755635138
 F1=0.8772958186791715
 ACC=0.9922806499987709
 MCC=0.875006494847835

10-gram detection
 Time=5.027217626571655
 TP=16838
 FP=552640
 TN=0
 FN=0
 TPR=R=1.0
 FPR=1.0
 TNR=0.0
 P=0.029567428416901093
 F1=0.05743660415202723
 ACC=0.029567428416901093
 MCC=inf

2-gram + sequence length detection
 Time=4.9436399936676025
 TP=15183
 FP=1358
 TN=551282
 FN=1655
 TPR=R=0.9017104169141228
 FPR=0.0024572958888245513
 TNR=0.9975427041111754
 P=0.9179009733389759
 F1=0.9097336648791157
 ACC=0.9947091898194487
 MCC=0.9070467207448273

New events + sequence length detection + count vector clustering
 Threshold=0.06
 Time=3.715696096420288
 TP=16705
 FP=1381
 TN=551259
 FN=133
 TPR=R=0.9921011996674189
 FPR=0.0024989143022582515
 TNR=0.9975010856977418
 P=0.9236425964834679
 F1=0.9566487229412438
 ACC=0.9973414249540807
 MCC=0.9559289328409916

New events + sequence length detection + count vector clustering with idf
 Threshold=0.11
 Time=3.7978756427764893
 TP=16659
 FP=1296
 TN=551344
 FN=179
 TPR=R=0.9893692837629172
 FPR=0.002345107122177186
 TNR=0.9976548928778228
 P=0.9278195488721804
 F1=0.9576064150834938
 ACC=0.9974099087234274
 MCC=0.9567967296426484

Edit distance detection
 Threshold=0.19
 Time=38.88217902183533
 TP=9699
 FP=543
 TN=552097
 FN=7139
 TPR=R=0.5760185295165696
 FPR=0.0009825564562825709
 TNR=0.9990174435437175
 P=0.9469830111306385
 F1=0.7163220088626292
 ACC=0.9865104534327929
 MCC=0.7329451552899283

New events + sequence length detection + edit distance
 Threshold=0.21
 Time=39.44513964653015
 TP=12231
 FP=516
 TN=552124
 FN=4607
 TPR=R=0.726392683216534
 FPR=0.0009337000579038796
 TNR=0.9990662999420962
 P=0.9595198870322429
 F1=0.8268379246239649
 ACC=0.9910040422983856
 MCC=0.8307160056585571
Event-based detection requires that the data sets have been downloaded and the parsed.csv files have been created. Then, the following command can be used to evaluate event-based detection.
python3 evaluate_events.py --data_dir bgl_cfdr

Read in parsed events ...
Randomly selecting 43992 events from 4399265 normal events for training
Testing 4355273 normal events
Testing 348698 anomalous events

New events
 Time=0.9108223915100098
 TP=348532
 FP=4912
 TN=4350361
 FN=166
 TPR=R=0.9995239433549948
 FPR=0.0011278282670225265
 TNR=0.9988721717329775
 P=0.9861024660200768
 F1=0.9927678446809904
ACC=0.9989204865421152If you use any resources from this repository, please cite the following publications:
- Landauer, M., Skopik, F., & Wurzenberger, M. (2023): A Critical Review of Common Log Data Sets Used for Evaluation of Sequence-based Anomaly Detection Techniques. arxiv:2309.02854. [PDF]
- Landauer, M., Onder, S., Skopik, F., & Wurzenberger, M. (2023): Deep Learning for Anomaly Detection in Log Data: A Survey. Machine Learning with Applications, Volume 12, 15 June 2023, 100470, Elsevier. [PDF]