Epitech Project, MATHS 106
Subject:
In the 70’s, chaos theory opened the way for a better understanding of the evolution of some animal species. Butterflys for instance. Let’s say... bombyx. If a generation is crowded, chances are that the next generation will be crowded too, regarding the natural rules of reproduction. But resources may lack for this new generation, so it may not be able to develop. Therefore, the number of bombyx depends on those two contradictory factors, and its evolution is far from trivial. Let’s call x i the number of the i th generation of butterflys. Here is a model for the evolution of x i : ( x 1 = n where n is the number of first generation individuals 1000−x i x i+1 = k.x i . 1000 , for i ≥ 1, k being the growth rate, from 1 to 4.
In order to study this evolution, you are asked to plot two things : • the curve representing the number of individuals in relation to the generation (varying from 1 to 100) • a synthetic scheme summing all the results for a given n ; it consists in plotting every value of x i (between two given bounds), in relation to k (k varying from 1 to 4 by 0.01 steps). In both cases, your program shall print on the standard outuput the values to be entered into gnuplot to draw the graphes.
Usage:
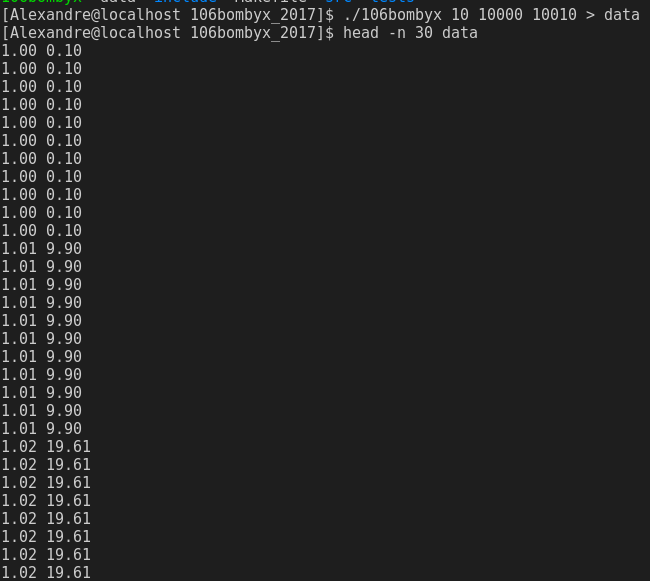
./106bombyx n [k | i0 i1]
n number of first generation individuals k growth rate from 1 to 4 i0 initial generation (included) i1 final generation (included)
Example: