Giter VIP home page Giter VIP logo

trendet's Introduction

trendet - Trend detection on stock time series data

Python Version PyPi Version Package Status Build Status Build Status Documentation Status codecov Downloads

Introduction

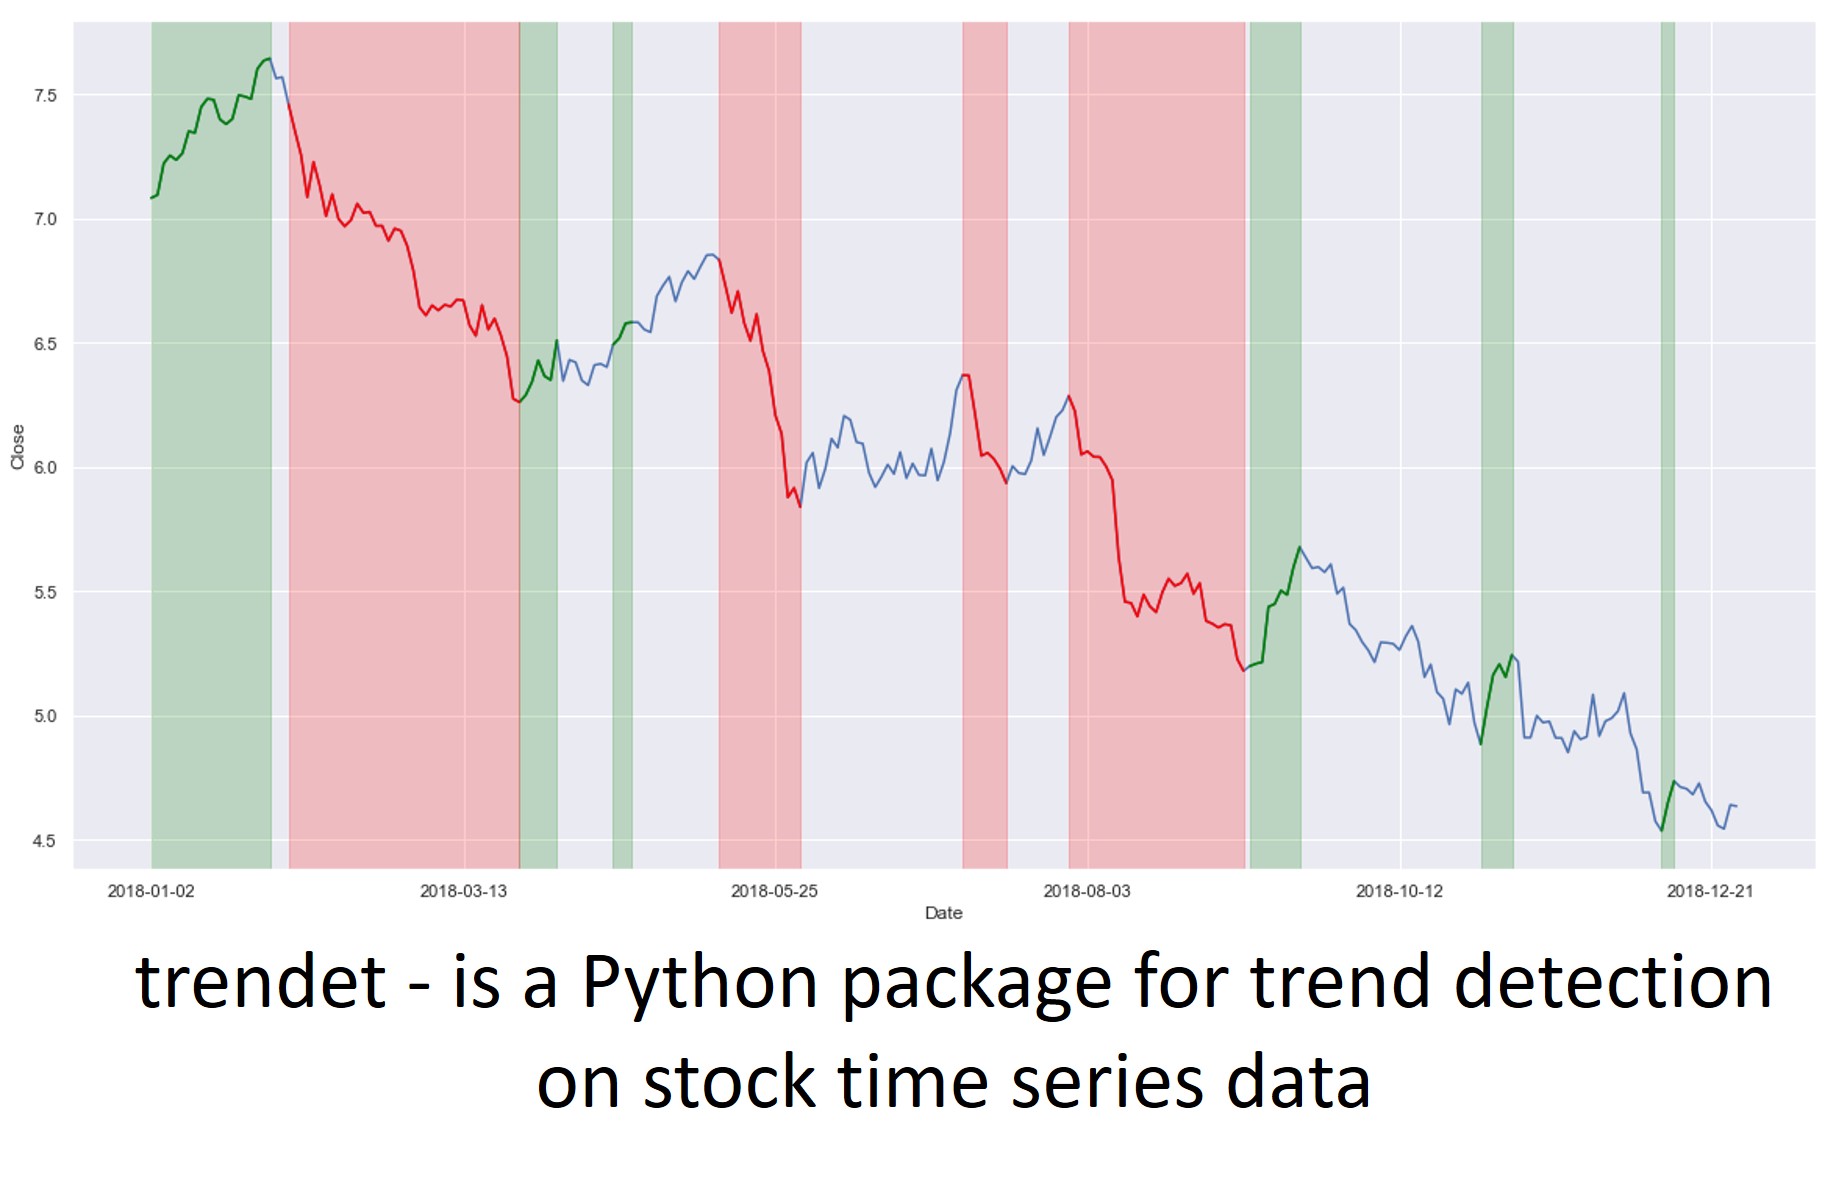
trendet is a Python package to detect trends on the market so to analyze its behaviour. So on, this package has been created to support investpy features when it comes to data retrieval from different financial products such as stocks, funds or ETFs; and it is intended to be combined with it, but also with every pandas.DataFrame, formatted as OHLC.

Anyways, trendet can also be used to identify trends from any pandas.DataFrame which contains any column with int64 or float64 values, even though it is intended to be used with stock data; it can also be used for any pandas.DataFrame.

Installation

In order to get this package working you will need to install it using pip by typing on the terminal:

$ python -m pip install trendet --upgrade

Or just install the current release or a specific release version such as:

$ python -m pip install trendet==0.7

Usage

As trendet is intended to be combined with investpy, the main functionality is to detect trends on stock time series data so to analyse the market and which behaviour does it have in certain date ranges.

In the example presented below, the identify_all_trends function will be used to detect every bearish/bullish trend with a time window above 5 days, which, for example, implies that every bearish (decreasing) trend with a longer length than 5 days will be identified as a down trend and so on added to a pandas.DataFrame which already contains OHLC values, in new columns called Up Trend and Down Trend which will be labeled as specified, with letters from A to Z by default.

import trendet

import matplotlib.pyplot as plt
import seaborn as sns

sns.set(style='darkgrid')

df = trendet.identify_all_trends(stock='BBVA',
                                 country='Spain',
                                 from_date='01/01/2018',
                                 to_date='01/01/2019',
                                 window_size=5,
                                 identify='both')

df.reset_index(inplace=True)

plt.figure(figsize=(20, 10))

ax = sns.lineplot(x=df.index, y=df['Close'])
ax.set(xlabel='Date')

labels = df['Up Trend'].dropna().unique().tolist()

for label in labels:
    sns.lineplot(x=df[df['Up Trend'] == label].index,
                 y=df[df['Up Trend'] == label]['Close'],
                 color='green')

    ax.axvspan(df[df['Up Trend'] == label].index[0],
               df[df['Up Trend'] == label].index[-1],
               alpha=0.2,
               color='green')

labels = df['Down Trend'].dropna().unique().tolist()

for label in labels:
    sns.lineplot(x=df[df['Down Trend'] == label].index,
                 y=df[df['Down Trend'] == label]['Close'],
                 color='red')

    ax.axvspan(df[df['Down Trend'] == label].index[0],
               df[df['Down Trend'] == label].index[-1],
               alpha=0.2,
               color='red')
               
locs, _ = plt.xticks()
labels = []

for position in locs[1:-1]:
    labels.append(str(df['Date'].loc[position])[:-9])

plt.xticks(locs[1:-1], labels)
plt.show()

Further usage insights can be found on the docs or on the following gist. Anyways, feel free to create your own scripts on how you use trendet or how can it be used in order to improve its features.

Contribute

As this is an open source project it is open to contributions, bug reports, bug fixes, documentation improvements, enhancements and ideas.

Also there is an open tab of issues where anyone can contribute opening new issues if needed or navigate through them in order to solve them or contribute to its solving.

Disclaimer

This package has been created so to identify market trends based on stock historical data retrieved via investpy so to determine which trends have been prevailing on the market based on a single stock OHLC values.

Conclude that this is the result of a research project, so this package has been developed with research purposes and no profit is intended.

Plots have been generated with both matplotlib and seaborn.

trendet's People

Contributors

dvidgar avatar

Stargazers

 avatar  avatar  avatar  avatar  avatar  avatar  avatar  avatar  avatar  avatar  avatar  avatar  avatar  avatar  avatar  avatar  avatar  avatar  avatar  avatar  avatar  avatar  avatar  avatar  avatar  avatar  avatar  avatar  avatar  avatar  avatar  avatar  avatar  avatar  avatar  avatar  avatar  avatar  avatar  avatar  avatar  avatar  avatar  avatar  avatar  avatar  avatar  avatar  avatar  avatar  avatar  avatar  avatar  avatar  avatar  avatar  avatar  avatar  avatar  avatar  avatar  avatar  avatar  avatar  avatar  avatar  avatar  avatar  avatar  avatar  avatar  avatar  avatar  avatar  avatar  avatar  avatar  avatar  avatar  avatar  avatar  avatar  avatar  avatar  avatar  avatar  avatar  avatar  avatar  avatar  avatar  avatar  avatar  avatar  avatar  avatar  avatar  avatar  avatar  avatar

Watchers

 avatar  avatar  avatar  avatar  avatar  avatar  avatar  avatar  avatar  avatar  avatar  avatar  avatar  avatar  avatar  avatar

trendet's Issues

extend trendet usage for a custom pandas.DataFrame

As trendet is currently just intended to be used combined with investpy, in order to extend its usage, coverage to identify trends from any time-series pandas.DataFrame is proposed.

So on, an additional function is proposed where the pandas.DataFrame column should be specified as the data is not structured as the one used by investpy. This will lead to extend trendet usage so that it can be used for every time-series dataset.

Any forward looking?

Really appreciate for your great and wonderful efforts on developing "trendet".
I'm exploring the usage of it on my strategy.
May I clarify one thing, will trendet "peep" the next data point (forward looking)?
Is the window size for backward looking (t-) instead of forward looking (t+)?
Thank you!

Command errored out with exit status 1 - pip install trendet==0.6

Hi I was analysing your lib
an look like good idea
but I could not install it on my pc or even on google colabs

I tried
pip install trendet==0.6
and also
pip install trendet --upgrade

On collab:

image

on local:

line 14, in requirements
with io.open('requirements.txt', encoding='utf-8') as f:
FileNotFoundError: [Errno 2] No such file or directory: 'requirements.txt'
----------------------------------------
ERROR: Command errored out with exit status 1: python setup.py egg_info Check the logs for full command output.

pip install error

pip install trendet Collecting trendet Downloading trendet-0.6.tar.gz (10 kB) ERROR: Command errored out with exit status 1: command: 'd:\programas\python37\python.exe' -c 'import sys, setuptools, tokenize; sys.argv[0] = '"'"'C:\\Users\\x\\AppData\\Local\\Temp\\pip-install-bq8c2po4\\trendet\\setup.py'"'"'; __file__='"'"'C:\\Users\\x\\AppData\\Local\\Temp\\pip-install-bq8c2po4\\trendet\\setup.py'"'"';f=getattr(tokenize, '"'"'open'"'"', open)(__file__);code=f.read().replace('"'"'\r\n'"'"', '"'"'\n'"'"');f.close();exec(compile(code, __file__, '"'"'exec'"'"'))' egg_info --egg-base 'C:\Users\x\AppData\Local\Temp\pip-pip-egg-info-tk2aj33h' cwd: C:\Users\x\AppData\Local\Temp\pip-install-bq8c2po4\trendet\ Complete output (7 lines): Traceback (most recent call last): File "<string>", line 1, in <module> File "C:\Users\x\AppData\Local\Temp\pip-install-bq8c2po4\trendet\setup.py", line 32, in <module> install_requires=requirements(), File "C:\Users\x\AppData\Local\Temp\pip-install-bq8c2po4\trendet\setup.py", line 14, in requirements with io.open('requirements.txt', encoding='utf-8') as f: FileNotFoundError: [Errno 2] No such file or directory: 'requirements.txt' ---------------------------------------- ERROR: Command errored out with exit status 1: python setup.py egg_info Check the logs for full command output.

Simillar to alvarobartt/investpy#85

I have tried:

  • python -m pip install trendet
  • python -m pip install trendet==0.6
  • python -m pip install trendet==0.6 --upgrade --user
  • python -m pip install trendet-0.6.tar.gz

I also tried to pre-install the requirements
sphinx==2.4.4 sphinx_rtd_theme==0.4.3 recommonmark==0.6.0

intellectual development

Hello,
I'm trying to understand the logic of your software, can you explain how you set the trends? Why use the mean() and how do you append the up_trends and down_trends lists.
Thank you for your response and your work,
Pascal

develop a function to check that there are no conflictive trends

Create a function to check that trends do not overlap, so the trend which last longer is the one to keep and the otherone is discarded.

For example, inside of a Down Trend between 01/01/2018 and 01/02/2018 there is an Up Trend between 05/01/2018 and 13/01/2018; and as the Down Trend lasts longer, it is expected to be the predominant trend on that market range of dates.

This issue was identified when developing the function identify_all_trends, where an Up Trend was overlapped inside a Down Trend, as shown below:

trendet

Bug in column parameter

in the function "identify_df_trends" the parameter "column" is useless. The algorithm always uses the "Close" column regardless of the input parameter

look it here

AttributeError: 'int' object has no attribute 'days'

I tried to use AAPL data to define trend for the last two years.
I set up window_size = 5 it gave, an error below. I changed it to 10, it ran ok. Then, changed the ticker to AMZAN it gave me the error for 5 and 10.

Please, let me know if you have any suggestions

AttributeError Traceback (most recent call last)
File G:\My Drive\development\swing\main.py:392
385 print('script is completed')
390 if name == 'main':
--> 392 main()
402 # WMA https://corporatefinanceinstitute.com/resources/career-map/sell-side/capital-markets/weighted-moving-average-wma/

File G:\My Drive\development\swing\main.py:284, in main()
280 df['day'] = df['timestamp'].dt.strftime('%Y-%m-%d')
281 # trend_df = alpaca_paral_data_col([ticker], start_date_ms, end_date_ms, timespan = 'day', multiplier=1)
282 # print(f'{ticker} i = {i} trend_df\n', trend_df.head())
283 # trend_df = sf.trend_define(ticker, start_date_ms, end_date_ms)
--> 284 trend_df = sf.trend_define_trendet(ticker, start_date_ms, end_date_ms)
285 print(f'{ticker} i = {i} trend_df\n', trend_df.head())
286 df = df.merge(trend_df[['ticker', 'day', 'trend']], on=['ticker', 'day'], how='inner')

File G:\My Drive\development\swing\swing_functions.py:197, in trend_define_trendet(ticker, start_date_ms, end_date_ms)
195 trend_df = alpaca_paral_data_col([ticker], start_date_ms, end_date_ms, timespan = 'day', multiplier=1)
196 trend_df['close'] = trend_df['close'].astype('float64')
--> 197 trend_df = trendet.identify_df_trends(df=trend_df,
198 column='close',
199 window_size=5,
200 identify='both')#.rename(columns={'Up Trend': 'trend'})
201 trend_df['trend'] = trend_df['Up Trend'].notnull().replace({True: 'uptrend', False: None})
202 trend_df['Down Trend'] = trend_df['Down Trend'].notnull().replace({True: 'downtrend', False: None})

File ~\Anaconda3\envs\VENV_SWING_P3_9_11\lib\site-packages\trendet\identification.py:589, in identify_df_trends(df, column, window_size, identify)
587 for down in results['Down Trend']:
588 if down['from'] < up['from'] < down['to'] or down['from'] < up['to'] < down['to']:
--> 589 if (up['to'] - up['from']).days > (down['to'] - down['from']).days:
590 flag = True
591 else:

AttributeError: 'int' object has no attribute 'days'

Distorted plot in the time series

Stock values doesn't fluctuate on the weekends, therefore they should not be included in the trends plot. It distorts the output as some trends seem to be more consistent than others, just because they contain a weekend (or several of them).

Trying to apply example on my own data

As you can see above - the bold code is of my own making. I'm taking a column, predicted_stock_data[:,0], from a dataframe to use a the closing price. I then add the 'Date'. I can't grasp the problem with 'Date'.

res = predicted_stock_data[:,0]
des = pd.DataFrame(res, columns = ['Close'])
start = datetime(2018, 9, 29)
dates = pd.date_range(start, periods=100).to_pydatetime().tolist()
des['Dates'] = dates
res = trendet.identify_df_trends(df=des, column='Close')

with plt.style.context('classic'):
plt.figure(figsize=(20, 10))
ax = sns.lineplot(x=res['Date'], y=res['Close'])

labels = res['Up Trend'].dropna().unique().tolist()

for label in labels:
    sns.lineplot(x=res[res['Up Trend'] == label]['Date'],
                 y=res[res['Up Trend'] == label]['Close'],
                 color='green')

    ax.axvspan(res[res['Up Trend'] == label]['Date'].iloc[0],
               res[res['Up Trend'] == label]['Date'].iloc[-1],
               alpha=0.2,
               color='green')

labels = res['Down Trend'].dropna().unique().tolist()

for label in labels:
    sns.lineplot(x=res[res['Down Trend'] == label]['Date'],
                 y=res[res['Down Trend'] == label]['Close'],
                 color='red')

    ax.axvspan(res[res['Down Trend'] == label]['Date'].iloc[0],
               res[res['Down Trend'] == label]['Date'].iloc[-1],
               alpha=0.2,
               color='red')

plt.show()

err

update sample gist on trendet usage

As trendet has been updated the update of trendet gist is proposed, since country param has been added to identify_trends() and identify_all_trends(), and a new function has been added identify_df_trends().

Documentation needs to be checked and updated before releasing trendet 0.5.

'int' object has no attribute 'days'

Hi,
I'm using this great python library.
I was wondering why I come up with this error:
'int' object has no attribute 'days'
my code is here:

import trendet

import matplotlib.pyplot as plt
import seaborn as sns
import pandas as pd

sns.set(style='darkgrid')

dff = pd.read_csv('setran.csv')


df = trendet.identify_df_trends(df=dff , column='Close')


print(df['Up Trend'].values)
df.reset_index(inplace=True)

plt.figure(figsize=(20, 10))

ax = sns.lineplot(x=df.index, y=df['Close'])
ax.set(xlabel='Date')

labels = df['Up Trend'].dropna().unique().tolist()

for label in labels:
    sns.lineplot(x=df[df['Up Trend'] == label].index,
                 y=df[df['Up Trend'] == label]['Close'],
                 color='green')

    ax.axvspan(df[df['Up Trend'] == label].index[0],
               df[df['Up Trend'] == label].index[-1],
               alpha=0.2,
               color='green')

labels = df['Down Trend'].dropna().unique().tolist()

for label in labels:
    sns.lineplot(x=df[df['Down Trend'] == label].index,
                 y=df[df['Down Trend'] == label]['Close'],
                 color='red')

    ax.axvspan(df[df['Down Trend'] == label].index[0],
               df[df['Down Trend'] == label].index[-1],
               alpha=0.2,
               color='red')
               
locs, _ = plt.xticks()
labels = []

for position in locs[1:-1]:
    labels.append(str(df['Date'].loc[position])[:-9])

plt.xticks(locs[1:-1], labels)
plt.show()

Can you please answer me to solve this issue (or just my problem) ?

The algorithm does not find trends in the final intervals

What makes an algorithm like this attractive is being able to identify the current trend of the market.
However, in all tests I've done, the algorithm ignores the final intervals.
Below I show you the result of the algorithm with smoothed data, to further accentuate the phenomenon that I mentioned.

image

Recommend Projects

  • React photo React

    A declarative, efficient, and flexible JavaScript library for building user interfaces.

  • Vue.js photo Vue.js

    🖖 Vue.js is a progressive, incrementally-adoptable JavaScript framework for building UI on the web.

  • Typescript photo Typescript

    TypeScript is a superset of JavaScript that compiles to clean JavaScript output.

  • TensorFlow photo TensorFlow

    An Open Source Machine Learning Framework for Everyone

  • Django photo Django

    The Web framework for perfectionists with deadlines.

  • D3 photo D3

    Bring data to life with SVG, Canvas and HTML. 📊📈🎉

Recommend Topics

  • javascript

    JavaScript (JS) is a lightweight interpreted programming language with first-class functions.

  • web

    Some thing interesting about web. New door for the world.

  • server

    A server is a program made to process requests and deliver data to clients.

  • Machine learning

    Machine learning is a way of modeling and interpreting data that allows a piece of software to respond intelligently.

  • Game

    Some thing interesting about game, make everyone happy.

Recommend Org

  • Facebook photo Facebook

    We are working to build community through open source technology. NB: members must have two-factor auth.

  • Microsoft photo Microsoft

    Open source projects and samples from Microsoft.

  • Google photo Google

    Google ❤️ Open Source for everyone.

  • D3 photo D3

    Data-Driven Documents codes.