apexcharts / blazor-apexcharts Goto Github PK
View Code? Open in Web Editor NEWA blazor wrapper for ApexCharts.js
Home Page: https://apexcharts.github.io/Blazor-ApexCharts
License: MIT License
A blazor wrapper for ApexCharts.js
Home Page: https://apexcharts.github.io/Blazor-ApexCharts
License: MIT License


Please set some default values for width and height

ApexChartOptions.Fill doesn't seem to be working as expected, or at all, unless I'm missing something. Here is my code:
options.Fill = new Fill {
            Type = "gradient",
            Gradient = new FillGradient {
                Stops = new List<double> { 0, 50, 100 },
                GradientToColors = new List<string> { "#32F16C", "#F13232" },
                Shade = "dark",
                Type = "vertical",
                OpacityFrom = 0,
                OpacityTo = 1
            }
        };
I've tested this with a regular radial chart as well as a series radial chart, and the options filled in seem to do literally nothing to the colors if the code wasn't there no matter how much I change them. The same goes for 'gradient' as 'pattern'. Am I missing something? Or does it just not work? Either way, I think this should be documented or sampled better for reference.
Update documention with latest changes
Many functionalities and settings are only found under "apexcharts.js". Is there a way to add some settings like colours etc to your documentation?
Add version change history?
Hi,
It seems that it's not possible to set the x axis border height.
When I try to set the border as this:
 AxisBorder = new XaxisAxisBorder()
            {
                StrokeWidth = 2,
                OffsetX = -10,
                OffsetY = -1,
                Show = true,
                Color = "#C8CADA"
            },
All seems working exept the StrokeWidth.
Reading the apexChart doc, it seem the the x axis have a height option but not a stroke width.
Could you take a look at this?
Thanks
We should add support for custom ToolTip
example at https://codepen.io/apexcharts/pen/NBdyvV
Couldn't really say it's a bug. But I got this exception after leaving the app to run for some time. The code is just updating charts at constant interval (with timer). Of course I can use try-catch to handle the exception, but shouldn't that already be integrated/handled in UpdateSeriesAsync method?
Unhandled exception. System.Threading.Tasks.TaskCanceledException: A task was canceled.
   at Microsoft.JSInterop.JSRuntime.InvokeAsync[TValue](Int64 targetInstanceId, String identifier, Object[] args)
   at Microsoft.JSInterop.JSRuntimeExtensions.InvokeVoidAsync(IJSRuntime jsRuntime, String identifier, Object[] args)
   at ApexCharts.ApexChart`1.UpdateSeriesAsync(Boolean animate)
   at Isuv.ManagementApp.Pages.Tasks.Active.HandleTimerCallback()
   at Isuv.ManagementApp.Pages.Tasks.Active.<OnInitializedAsync>b__16_0(Object sender, ElapsedEventArgs e)
   at System.Threading.Tasks.Task.<>c.<ThrowAsync>b__140_1(Object state)
   at System.Threading.QueueUserWorkItemCallback.<>c.<.cctor>b__6_0(QueueUserWorkItemCallback quwi)
   at System.Threading.ExecutionContext.RunForThreadPoolUnsafe[TState](ExecutionContext executionContext, Action`1 callback, TState& state)
   at System.Threading.QueueUserWorkItemCallback.Execute()
   at System.Threading.ThreadPoolWorkQueue.Dispatch()
Unhandled exception. Unhandled exception. Unhandled exception. Unhandled exception. Unhandled exception. System.Threading.Tasks.TaskCanceledException: A task was canceled.
   at Microsoft.JSInterop.JSRuntime.InvokeAsync[TValue](Int64 targetInstanceId, String identifier, Object[] args)
   at Microsoft.JSInterop.JSRuntimeExtensions.InvokeVoidAsync(IJSRuntime jsRuntime, String identifier, Object[] args)
   at ApexCharts.ApexChart`1.UpdateSeriesAsync(Boolean animate)
   at Isuv.ManagementApp.Pages.Tasks.Active.HandleTimerCallback()
   at Isuv.ManagementApp.Pages.Tasks.Active.<OnInitializedAsync>b__16_0(Object sender, ElapsedEventArgs e)
   at System.Threading.Tasks.Task.<>c.<ThrowAsync>b__140_1(Object state)
   at System.Threading.QueueUserWorkItemCallback.<>c.<.cctor>b__6_0(QueueUserWorkItemCallback quwi)
   at System.Threading.ExecutionContext.RunForThreadPoolUnsafe[TState](ExecutionContext executionContext, Action`1 callback, TState& state)
   at System.Threading.QueueUserWorkItemCallback.Execute()
   at System.Threading.ThreadPoolWorkQueue.Dispatch()
Unhandled exception. System.Threading.Tasks.TaskCanceledException: A task was canceled.
   at Microsoft.JSInterop.JSRuntime.InvokeAsync[TValue](Int64 targetInstanceId, String identifier, Object[] args)
   at Microsoft.JSInterop.JSRuntimeExtensions.InvokeVoidAsync(IJSRuntime jsRuntime, String identifier, Object[] args)
   at ApexCharts.ApexChart`1.UpdateSeriesAsync(Boolean animate)
   at Isuv.ManagementApp.Pages.Tasks.Active.HandleTimerCallback()
   at Isuv.ManagementApp.Pages.Tasks.Active.<OnInitializedAsync>b__16_0(Object sender, ElapsedEventArgs e)
   at System.Threading.Tasks.Task.<>c.<ThrowAsync>b__140_1(Object state)
   at System.Threading.QueueUserWorkItemCallback.<>c.<.cctor>b__6_0(QueueUserWorkItemCallback quwi)
   at System.Threading.ExecutionContext.RunForThreadPoolUnsafe[TState](ExecutionContext executionContext, Action`1 callback, TState& state)
   at System.Threading.QueueUserWorkItemCallback.Execute()
at System.Threading.ThreadPoolWorkQueue.Dispatch() I would like to change Bars colors. This is my code
`
<ApexSeries TItem="OperationBarChartData"
    Items="Data" Name="Encaissement"
    XValue="@(o => o.Month)"
    YAggregate="@(o => o.Sum(o => o.IncomeAmount))"
    OrderByDescending="e=>e.Y" />

<ApexSeries TItem="OperationBarChartData"
    Items="Data" Name="Décaissement"
    XValue="@(o => o.Month)"
    YAggregate="@(o => o.Sum(o => o.ExpenseAmount))"
    OrderByDescending="e=>e.Y" />
@code {
[Parameter]
public List Data { get; set; }
private ApexChartOptions<OperationBarChartData> GetOptions()
{
    var options = new ApexChartOptions<OperationBarChartData>();
    **options.Colors = new List<string>{"#3699FF","#2670FF"};**
    return options;
}
}`
When i remove the Options, my bars display with the default colors (blue and green).
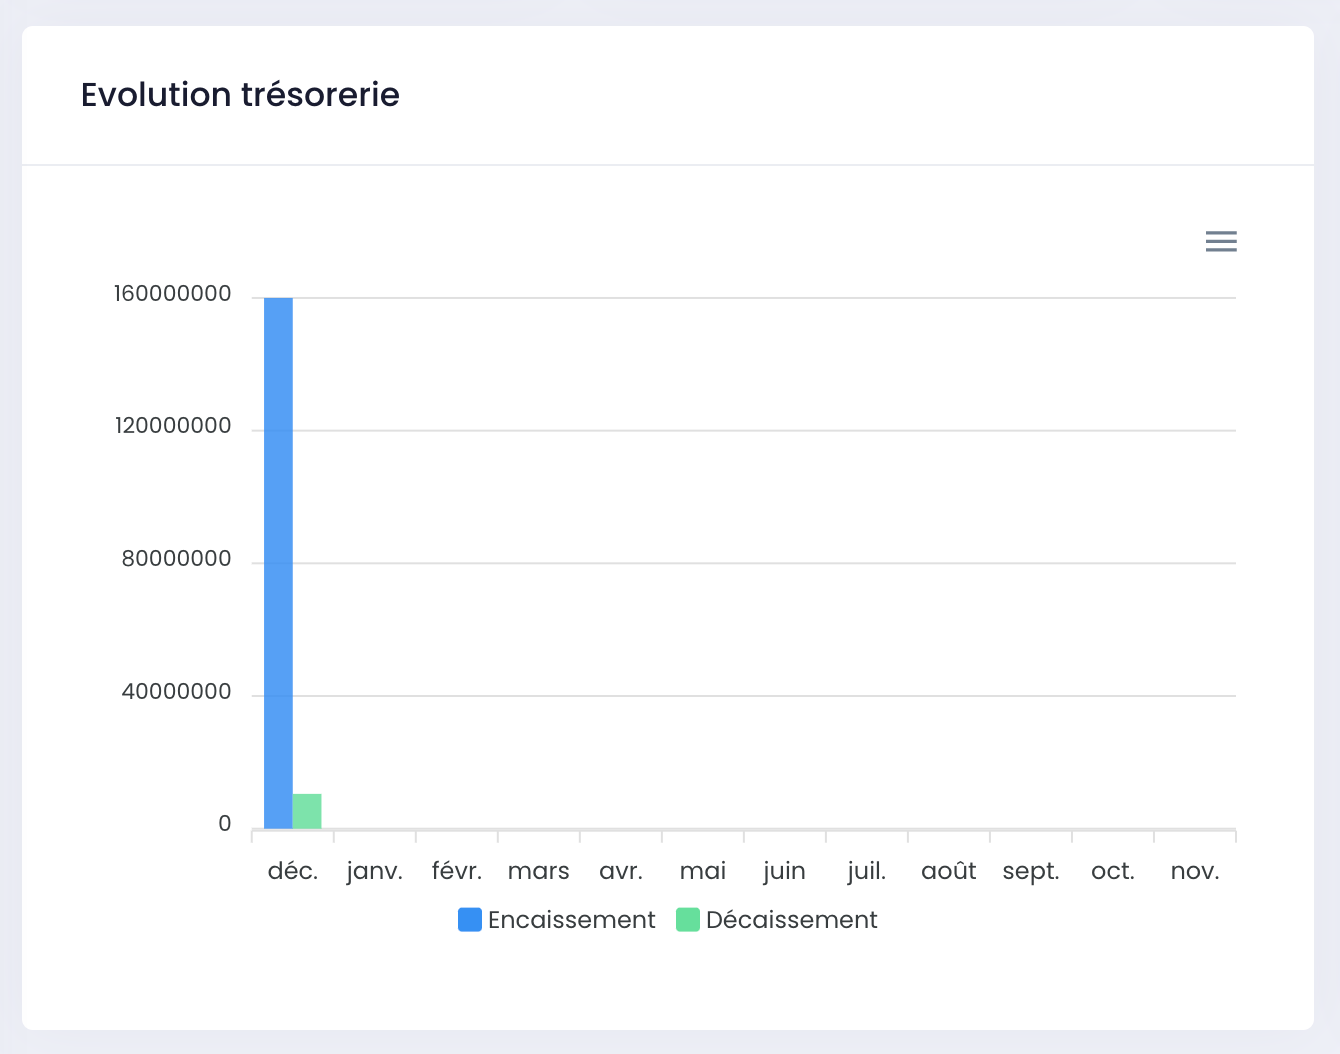
But when I add Options nothing display.

How can I change the bar colors?
Typo in DatetimeUTC chart option forces all DateTime axes to use UTC.
From apex docs: https://apexcharts.com/docs/options/xaxis/#datetimeUTC
Blazor-ApexCharts: https://github.com/joadan/Blazor-ApexCharts/blob/c9144e7912427c170b1b2cc447c176a02481bbfa/src/Blazor-ApexCharts/Models/ApexChartOptions.cs#L1290
I have not been able to get my first line chart off the ground, and have an exception that does not give me any clues what steps to take next:
blazor.server.js:1
[2021-11-27T17:42:13.572Z] Error: System.AggregateException: One or more errors occurred. (Value cannot be null. (Parameter 'source'))
---> System.ArgumentNullException: Value cannot be null. (Parameter 'source')
at System.Linq.ThrowHelper.ThrowArgumentNullException(ExceptionArgument argument)
at System.Linq.Enumerable.Select[TSource,TResult](IEnumerable1 source, Func2 selector)
at ApexCharts.ApexPointSeries1.GetData() at ApexCharts.ApexChart1.SetSeries()
at ApexCharts.ApexChart1.Render() at ApexCharts.ApexChart1.OnAfterRenderAsync(Boolean firstRender)
--- End of inner exception stack trace ---
`@page "/linechart"
@using ServerAdv.Data
@using ClassLibraryHm
@using System.Net.Http
@using MudBlazor
@using ApexCharts@
@using BlazorApexCharts
@Inject IHttpClientFactory _clientFactory
    <ApexPointSeries TItem="HatchDataDto"
                     Items="hatchdata"
                     Name="Data H"
                     SeriesType="SeriesType.Line"
                     XValue="@(e => e.dateIndex)"
                     YValue="@(e => e.DataH)"
                     OrderBy="e=>e.X" />

    <ApexPointSeries TItem="HatchDataDto"
                     Items="hatchdata"
                     Name="Data L"
                     SeriesType="SeriesType.Line"
                     XValue="@(e => e.dateIndex)"
                     YValue="@(e => e.DataL)"
                     OrderByDescending="e=>e.X" />
</ApexChart>
@code {
private List hatchdata { get; set; }
string baseUrl = "https://localhost:44344";

protected override async Task OnInitializedAsync()
{
	var httpClient = _clientFactory.CreateClient("ServerAPI");
	httpClient.DefaultRequestHeaders.Add("Accept", "application/json");

	hatchdata = await httpClient.GetFromJsonAsync<List<HatchDataDto>>($"{baseUrl}/api/Hatch/ByDataId/{469}");
}
}`
[
{
"id": 13733,
"hatchMainId": 469,
"dataH": 1136,
"dataL": 7012,
"dateIndex": 1
},
{
"id": 13734,
"hatchMainId": 469,
"dataH": 1134,
"dataL": 6978,
"dateIndex": 2
},
{
"id": 13735,
"hatchMainId": 469,
"dataH": 1128,
"dataL": 6997,
"dateIndex": 3
} etc
]
What am I doing wrong here?
Is it possible at this stage to create any of the timeline charts, for example, RangeBar?
This type of chart is expecting two values for every entry in Y data series while YAggregate works with one.
Currently we support the Apexchart built in javascript formatters, however It would be nice if we could use .Net to format values.
Is it possible to select not only one datapoint but several (e.g. in Piechart)?
Hi and thanks for this blazor ApexCharts.js wrapper.
According the documentation :
/// And according to the demos, data can contain null.
/// https://apexcharts.com/javascript-chart-demos/line-charts/null-values/
but unfortunatly this is not the case.
Do you expect to support null YValue in the future?
Thanks again for your work.
It looks like it is not possible to use decimal data on the x-Axis.
I am using very simple x/y data:
public record DataPoint(decimal X, decimal Y);
public List DataPoints { get; } = new[] { new DataPoint(1.2m, 1.5m), new DataPoint(2.2m, 6.4m),new DataPoint(3.82m, 3.4m),new DataPoint(9.2m, 5.4m),new DataPoint(14.2m, 16.4m), }.ToList();
But sadly the chart seems to use the next next integral value. If I export csv values I also get different values than expected:
<style> </style>| category | TBD: |
|---|---|
| 1 | 1.5 |
| 4 | 6.4 |
| 7 | 3.4 |
| 10 | 5.4 |
| 14 | 16.4 |
I was encountering a null reference when dynamically adding ApexSeries to an ApexChart in my .razor file in the OnInitialized and Dispose methods of ApexSeries. It showed up with Chart reporting null and crashing out (highlighted). I made the following code change to protect against that. Probably a bit of overkill since I have not seen a Chart.Options be null when the Chart object was initialized.
Love what you're doing. Thanks so much!

Do you have plans to support timeline charts like these here? They appear to be modified bar charts but I wasn't able to replicate them with this library.
https://apexcharts.com/javascript-chart-demos/timeline-charts/
Great implementation so far! Trying to do some dashboarding with this, and so far really pleased. Great work!
I noticed the PlotOptionsBar doesn't have input for borderRadius

It does however have input for Ending and StartingShape. It just doesn't seem to have any impact.
But as far as I can see on apex, there is a "difference" on bar charts and column charts, which I guess is sort of the same.
Hi,
when i update my chart data i also update the annotation collection of the chart options.
Here i've noticed that the chart does not display the new annotation data.
Is this a bug or did i missed something?
    private readonly AnnotationsYAxis averageAxis;

    protected IndexBase()
    {
        this.averageAxis = new AnnotationsYAxis
        {
            Y = 0,
            BorderWidth = 2,
            StrokeDashArray = 5,
            BorderColor = "red"
        };

        this.Records = Enumerable.Empty<Record>();
        this.Options = new ApexChartOptions<Record>
        {
            Chart = new Chart
            {
                Animations = new Animations
                {
                    DynamicAnimation = new DynamicAnimation
                    {
                        Enabled = false
                    },
                    Enabled = false
                },
                Height = "100%",
                Width = "100%",
            },
            Annotations = new Annotations
            {
                Yaxis = new List<AnnotationsYAxis>
                {
                    this.averageAxis
                }
            }
        };
    }

    private void OnNotification(object sender, IMessage message)
    {
        if (message is not StatisticRefreshedNotification notification) return;

        this.averageAxis.Y = notification.Average;

        this.Records = notification.Records;

        this.StateHasChanged();
    }
We should make it possible to set the color of the series as an attribute on the series.
Currently it's only possible using the options.
I run the ChartExamples project and receive in the browser
Loading...
An unhandled error has occurred. Reload 🗙
and Page source
`
|
|
|
|
|
| <title>Chart Samples</title>
|
|
|
|
|
|
| Loading...
|
|
| <script type="text/javascript">
| // Single Page Apps for GitHub Pages
| // https://github.com/rafrex/spa-github-pages
| // Copyright (c) 2016 Rafael Pedicini, licensed under the MIT License
| // ----------------------------------------------------------------------
| // This script checks to see if a redirect is present in the query string
| // and converts it back into the correct url and adds it to the
| // browser's history using window.history.replaceState(...),
| // which won't cause the browser to attempt to load the new url.
| // When the single page app is loaded further down in this file,
| // the correct url will be waiting in the browser's history for
| // the single page app to route accordingly.
| (function (l) {
| if (l.search) {
| var q = {};
| l.search.slice(1).split('&').forEach(function (v) {
| var a = v.split('=');
| q[a[0]] = a.slice(1).join('=').replace(/and/g, '&');
| });
| if (q.p !== undefined) {
| window.history.replaceState(null, null,
| l.pathname.slice(0, -1) + (q.p || '') +
| (q.q ? ('?' + q.q) : '') +
| l.hash
| );
| }
| }
| }(window.location))
| </script>
|
|
|
| An unhandled error has occurred.
| Reload
| 🗙
|
|
|
| <script src="_framework/blazor.webassembly.js"></script>
| <script src="_content/Blazor-ApexCharts/js/apex-charts.min.js"></script>
| <script src="_content/Blazor-ApexCharts/js/blazor-apex-charts.js"></script>
|
|
|
`
How to fix it and run the samples?
The chart is exceeding the client height (or the visible screen area). I want the chart to be 100% in width but height should not exceed the visible area. Please have a look at the screenshot.
Please help me asap. I have a client demo :-(

Is there an example of a realtime chart similar to this: https://apexcharts.com/javascript-chart-demos/line-charts/realtime/ .
I tried calling StateHasChanged() after updating the Items Enumerable but that's probably not the right way.
The JS example calls the method updateSeries but this isn't a method in the ApexChart object.
Thanks for your work on this.
Charts seem to have a fixed width/height ratio and I haven't found a way to change this yet. Is it NYI or am I just missing the option?
Edit: Issue seems to be a min-height setting inside the control itself. This is preventing me from limiting its height from the container DIV.
Hi, is there a way to set the chart height to 100% of the parents height? I am on version 0.2.4-Alpha as I am still using .NET Core 3.1.
I have tried to do:
options.Chart.Height = 100%
and set the component's height to:
Height = "@("100%")"
But neither worked for me.
Hi,
I have data like below. (Time ranges of when my machine was up and down)
It is getting plotted like

I want it to be plotted like

Any solution?
series: [
          // George Washington
          {
            name: 'MachineState',
            data: [
              {
                x: 'Up',
                y: [
                  new Date(1789, 3, 30).getTime(),
                  new Date(1797, 2, 4).getTime()
                ]
              },{
                x: 'Down',
                y: [
                  new Date(1797, 2, 4).getTime(),
                  new Date(1801, 2, 4).getTime()
                ]
              },
			  {
                x: 'Up',
                y: [
                  new Date(1792, 3, 30).getTime(),
                  new Date(1795, 2, 4).getTime()
                ]
              },

            ]
          },
I am using Blazor Server with NET 6 I followed the instructions but I am getting this error
ReferenceError: ApexCharts is not defined
at Object.renderChart (https://localhost:5001/_content/Blazor-ApexCharts/js/blazor-apex-charts.js:195:9)
at https://localhost:5001/_framework/blazor.server.js:1:3501
at new Promise ()
at Tt.beginInvokeJSFromDotNet (https://localhost:5001/_framework/blazor.server.js:1:3475)
at https://localhost:5001/_framework/blazor.server.js:1:71773
at Array.forEach ()
at Tt._invokeClientMethod (https://localhost:5001/_framework/blazor.server.js:1:71759)
at Tt._processIncomingData (https://localhost:5001/_framework/blazor.server.js:1:69801)
at bt.Tt.connection.onreceive (https://localhost:5001/_framework/blazor.server.js:1:64201)
at WebSocket.o.onmessage (https://localhost:5001/_framework/blazor.server.js:1:48517)
and here is the the razor component
 <ApexChart Title="Profit Flow" TItem="ProfitModel">
                          <ApexPointSeries
                           TItem="ProfitModel"
                           Items="Profits"
                           XValue="@(e=> e.Category)"
                           YAggregate="@(e=> e.Sum(e=> e.Profit))"
                          ></ApexPointSeries>

                       </ApexChart>
I added ApexCharts in the _imports.razor
in the host file
<script src="_content/Blazor-ApexCharts/js/apex-charts.min.js"></script>
<script src="_content/Blazor-ApexCharts/js/blazor-apex-charts.js"></script>
<script src="_framework/blazor.server.js"></script>
do you know if I am missing something?
I checked the examples but I could not find anything different.
Thank you!
Hi, what is the intended way to update a chart with new data and have it re-render? I cant find a way to do it. Like bind a variable to ApexSeries Items, or an Update() method.
Hi, i am new in apexcharts and so far it's looks good.
I have one question, how to format number use thousand separator? for example 1000000 become 1.000.000
Usually in C#, i use syntax like this => String.Format(_id, "{0:N0}", 1000000);
where _id is indonesian cultureinfo.
Thanks for your help.
Could you provide a example of brush chart like the one below with your lib?

Hi,
I took the DateTimeChart sample and added an annotation on X-axis. It is not working.
can you please help me?
Thanks in advance.
options.Annotations = new Annotations { Yaxis = new List(), Xaxis = new List() };
options.Annotations.Yaxis.Add(new AnnotationsYAxis
{
Y = 50000,
BorderWidth = 2,
StrokeDashArray = 5,
BorderColor = "red",
Label = new Label { Text = "Monthly Target" }
});
    //My Code Here. It is not working
    options.Annotations.Xaxis.Add(new AnnotationsXAxis
    {
        X = new DateTimeOffset(new DateTime(2020, 12, 1)),
        BorderWidth = 2,
        StrokeDashArray = 5,
        BorderColor = "red",
        Label = new Label { Text = "Something" }
    });
Hejsån! Great charts, just wish there would be more detailed examples somewhere and wider audience for keeping this repo alive and actively maintained. I have got majority of examples working, but can't figure out how you managed ApexRangeSeries functioning.
I have seen documentation: https://apexcharts.github.io/Blazor-ApexCharts/rangebar-charts
Basically I am trying to imitate GanttChart with this chart, so I came up with this model:
    protected async override Task OnInitializedAsync()
    {
      this.ProjectsList = await this.HttpClient.GetFromJsonAsync<IEnumerable<Project>>("api/Projects");

      this.InitializeGanttChartOptions();

      this.GanttChart = this.ProjectsList
      .Select(s => new GanttChartModel
      {
        XAxisValue = s.Name,
        YAxisValue = new List<decimal> { s.ProjectStartDate.Ticks, s.ProjectEndDate.Ticks },
      }).ToList();
    }
Then razor part:
  <ApexChart TItem="GanttChartModel"
           Title="Gantt view"
           Options=Options
           XAxisType="XAxisType.Datetime">
    <ApexRangeSeries TItem="GanttChartModel"
                   Items="this.GanttChart"
                   XValue="@(e => e.XAxisValue)"
                   YValue="@(e => e.YAxisValue)" />
  </ApexChart>
So at this point YValue is decimal, but for getting range it should be public IEnumerable<decimal> YAxisValue { get; set; }. How to get it working?
My model:
  public class GanttChartModel
  {
    public object XAxisValue { get; set; }
    public IEnumerable<decimal> YAxisValue { get; set; }
  }
The ApexGauge chart seems haven't "RenderAsync" method. How is it possible to re-render the gauge chart after the "Precentage" value changing?
Setting Stacked to true causes this error to appear in the console:

I'm using a range bar chart.
I need to customize datalabels and tooltips for a range bar chart... Can examples or docs for this be added?
Hi,
Just noticed that the stack type "The100" is not being translated correctly upon initializing the JS Chart.
Quick repro:
_options = private readonly ApexChartOptions<MyData> _options = new(); _options.Chart = new Chart { Stacked = true, Type = ChartType.Bar, StackType = StackType.The100 };
Using debug = true, I notice that the output is:
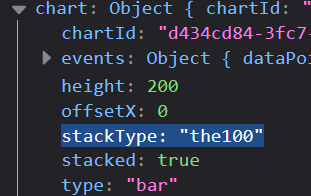
I believe this is related to the fact that this is an enum, and it's just being passed in with the enum text values "Normal/The100".
The properiate type setting for The100 should be "100%".
I'm not sure if you appreciate PR's or if you'd just like bugs to be reported here, but here you go :)
We should upgrade to .Net5
Hi!
Really like your work, wrapper worked like a charm so far. But I think I've found a bug.
I am using UpdateSeries method in a timer callback and everything works fine. But when I also add InvokeAsync(StateHasChanged) to callback (to update UI), chart doesn't update anymore. It is also worth mentioning that when I remove Options parameter from ApexChart component UpdateSeries works again.
Sample code (Blazor Server, .NET 5):
@using ApexCharts;
@using System.Timers
@implements IDisposable

<input @bind-value="text" />

@*remove Options and UpdateSeries() will work with InvokeAsync(StateHasChanged)*@
<ApexChart @ref="chart" Height="400" Width="600" TItem="Data" Options="Data.GetOptions()">
    <ApexPointSeries SeriesType="SeriesType.Bar"
                     TItem="Data" Items="dataList"
                     XValue="@(data => "xVal")" YValue="@(data => data.Value)" />
</ApexChart>

@code {
    class Data
    {
        public int Value { get; set; }

        static Random random = new();
        public static ApexChartOptions<Data> GetOptions()
        {
            ApexChartOptions<Data> options = new();
            options.Yaxis = new() { new() { Min = 0, Max = 50 } };
            return options;
        }

        public Data()
        {
            Value = random.Next(1, 30);
        }

        public void Update()
        {
            Value = random.Next(1, 30);
        }
    }

    List<Data> dataList = new();

    ApexChart<Data> chart;

    string text = "text";

    private bool timerInitialized;
    private Timer timer;

    protected override void OnInitialized()
    {
        for (int i = 0; i < 5; i++)
        {
            dataList.Add(new());
        }
    }

    protected override void OnAfterRender(bool firstRender)
    {
        if (firstRender && !timerInitialized)
        {
            timerInitialized = true;
            timer = new Timer(2000);
            timer.Elapsed += async delegate { await UpdateChartSeries(); };
            timer.Enabled = true;
        }
    }

    private async Task UpdateChartSeries()
    {
        foreach (var data in dataList)
        {
            data.Update();
        }

        text = dataList[0].Value.ToString();
        await InvokeAsync(() => StateHasChanged()); // comment this line for UpdateSeries() to work again

        await chart.UpdateSeries();
    }

    public void Dispose()
    {
        timer?.Stop();
        timer = null;
    }
}
We could make the demo look better by using TabBlazor
Hi there!
First off thank you for your work, I find ApexCharts amazing, and it's very nice to be able to use it in Blazor.
My problem is with the handling of large amount of data. I'm trying to draw a chart which consists of ~10000 X-Y key-value pairs, however this amount simply makes the entire app (I'm working in WebAssembly) unusable for a good 10-15 seconds, and even after it loads, it's still very slow.
My question is whether there's any solution for this problem; for example not rendering all the points, only every N-th one (at 10k points this would still make a nice chart I think), or loading the values dynamically, not all of them at the same time, etc.
Thank you!
Currently it's not possible to pass in a formatter.
Would it be possible to add 100% Stacked Bar?
Also, is it possible to flip the Basic Charts - Bar Horizontally and Vertically as one would like?
Ref https://apexcharts.com/javascript-chart-demos/bar-charts/stacked-100/
Hi,
Any plans of providing Treemap?
Thank you
Sorry if this isn't the place to ask for how-to questions. I've been having trouble figuring out how to implement this sort of radial gauge with multiple values.

I'm assuming this has to be done via the ApexSeries Tag nested inside an ApexGauge Tag? There isn't much documentation on how this works with the wrapper outside of the sample.
Currently we don't support all chart types apex chart supports
Hello,
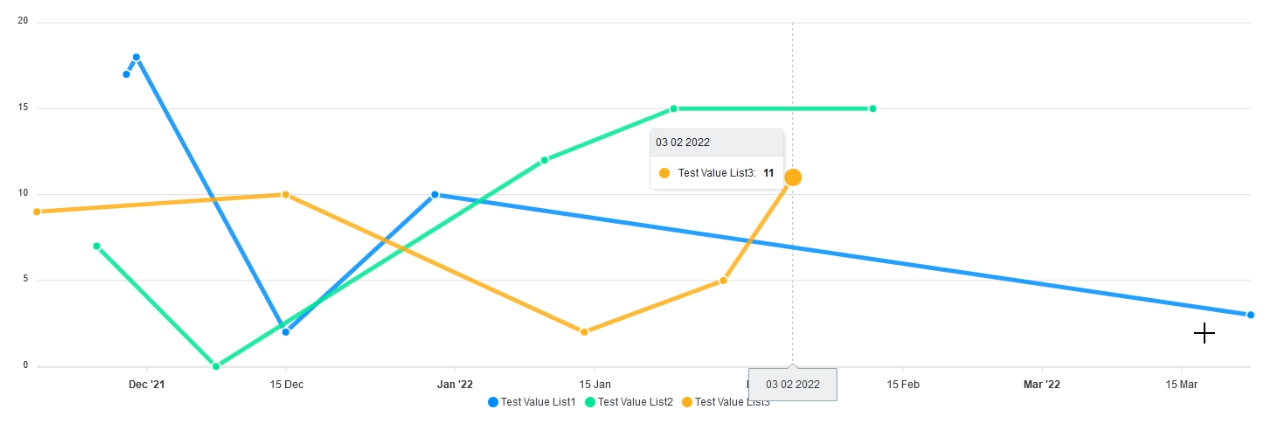
I am using the wrapper for a Blazor Server project and sadly discovered a bug.
I need to have more than one data series with different lists of the same type.
Due to this, the hovering effect, to show the tooltip, gets unprecise and sometimes doesn't work. (See pictures)
E.g. if a point is at the left side of the chart, it can't be selected and the tooltip won't show.
Also if two lists are used, the shared tooltip doesn't work anymore. (Shared = true)
("Shared" option not working and wrong point selected, see cursor)

(Cursor is on the right, expecting to see the tooltip of the very right point)
Code inside ".razor"-component-file:
<ApexChart Height="500" TItem="TestingClass" Title="Test Values"
           XAxisType="XAxisType.Datetime"
           Options="options">
    <ApexPointSeries TItem="TestingClass"
                     Items="TestData1"
                     Name="Test Value List1"
                     SeriesType="SeriesType.Line"
                     XValue="@(e => e.TestDate.Date)"
                     YValue="@(e => e.TestValue)"
                     OrderBy="e => e.X" />

    <ApexPointSeries TItem="TestingClass"
                     Items="TestData2"
                     Name="Test Value List2"
                     SeriesType="SeriesType.Line"
                     XValue="@(e => e.TestDate.Date)"
                     YValue="@(e => e.TestValue)"
                     OrderBy="e => e.X" />

    <ApexPointSeries TItem="TestingClass"
                     Items="TestData3"
                     Name="Test Value List3"
                     SeriesType="SeriesType.Line"
                     XValue="@(e => e.TestDate.Date)"
                     YValue="@(e => e.TestValue)"
                     OrderBy="e => e.X" />
</ApexChart>

@code {

    public class TestingClass {
        public DateTime TestDate { get; set; }
        public int TestValue { get; set; }
    }

    public List<TestingClass> TestData1 = new List<TestingClass>();
    public List<TestingClass> TestData2 = new List<TestingClass>();
    public List<TestingClass> TestData3 = new List<TestingClass>();

    private ApexChartOptions<TestingClass> options = new ApexChartOptions<TestingClass>();

    private bool UseRandomData = false;

    protected override void OnInitialized() {
        if (UseRandomData) {
            for (int i = 0; i < 5; i++) {
                var r = new Random();
                TestData1.Add(new TestingClass { TestDate = DateTime.Now.AddDays(r.Next(1, 100)).Date, TestValue = r.Next(0, 20) });
                TestData2.Add(new TestingClass { TestDate = DateTime.Now.AddDays(r.Next(1, 100)).Date, TestValue = r.Next(0, 20) });
                TestData3.Add(new TestingClass { TestDate = DateTime.Now.AddDays(r.Next(1, 100)).Date, TestValue = r.Next(0, 20) });
            }

        } else {
            //Example data from screenshots
            TestData1.Add(new TestingClass { TestDate = DateTime.Parse("29-11-2021").Date, TestValue = 17 });
            TestData1.Add(new TestingClass { TestDate = DateTime.Parse("30-11-2021").Date, TestValue = 18 });
            TestData1.Add(new TestingClass { TestDate = DateTime.Parse("15-12-2021").Date, TestValue = 2 });
            TestData1.Add(new TestingClass { TestDate = DateTime.Parse("30-12-2021").Date, TestValue = 10 });
            TestData1.Add(new TestingClass { TestDate = DateTime.Parse("22-03-2022").Date, TestValue = 3 });

            TestData2.Add(new TestingClass { TestDate = DateTime.Parse("26-11-2021").Date, TestValue = 7 });
            TestData2.Add(new TestingClass { TestDate = DateTime.Parse("08-12-2021").Date, TestValue = 0 });
            TestData2.Add(new TestingClass { TestDate = DateTime.Parse("10-01-2022").Date, TestValue = 12 });
            TestData2.Add(new TestingClass { TestDate = DateTime.Parse("23-01-2022").Date, TestValue = 15 });
            TestData2.Add(new TestingClass { TestDate = DateTime.Parse("12-02-2022").Date, TestValue = 15 });

            TestData3.Add(new TestingClass { TestDate = DateTime.Parse("20-11-2021").Date, TestValue = 9 });
            TestData3.Add(new TestingClass { TestDate = DateTime.Parse("15-12-2021").Date, TestValue = 10 });
            TestData3.Add(new TestingClass { TestDate = DateTime.Parse("14-01-2022").Date, TestValue = 2 });
            TestData3.Add(new TestingClass { TestDate = DateTime.Parse("28-01-2022").Date, TestValue = 5 });
            TestData3.Add(new TestingClass { TestDate = DateTime.Parse("04-02-2022").Date, TestValue = 11 });
        }

        options.Tooltip = new Tooltip {
            Shared = true,
            X = new TooltipX {
                Format = "dd MM yyyy"
            }
        };
        options.Markers = new Markers {
            Shape = ShapeEnum.Circle,
            Size = 5
        };
    }
}
Hi,
We are getting strange issues. The Json which gets generated by this chart is getting messed up.
After troubleshooting, we found that the issue is in ChartSerializer.
Requesting the below changes in ChartSerializer.
private static Dictionary<Type, JsonSerializerOptions> _serializerOptions = new Dictionary<Type, JsonSerializerOptions>();
var key = typeof(TItem);

ApexChart has a number of methods, https://apexcharts.com/docs/methods/
We should try to support as many as we can, starting with the UpdateSeries.
#43
A declarative, efficient, and flexible JavaScript library for building user interfaces.
🖖 Vue.js is a progressive, incrementally-adoptable JavaScript framework for building UI on the web.
TypeScript is a superset of JavaScript that compiles to clean JavaScript output.
An Open Source Machine Learning Framework for Everyone
The Web framework for perfectionists with deadlines.
A PHP framework for web artisans
Bring data to life with SVG, Canvas and HTML. 📊📈🎉
JavaScript (JS) is a lightweight interpreted programming language with first-class functions.
Some thing interesting about web. New door for the world.
A server is a program made to process requests and deliver data to clients.
Machine learning is a way of modeling and interpreting data that allows a piece of software to respond intelligently.
Some thing interesting about visualization, use data art
Some thing interesting about game, make everyone happy.
We are working to build community through open source technology. NB: members must have two-factor auth.
Open source projects and samples from Microsoft.
Google ❤️ Open Source for everyone.
Alibaba Open Source for everyone
Data-Driven Documents codes.
China tencent open source team.