apexcharts / vue3-apexcharts Goto Github PK
View Code? Open in Web Editor NEW📊 Vue-3 component for ApexCharts
License: MIT License
📊 Vue-3 component for ApexCharts
License: MIT License


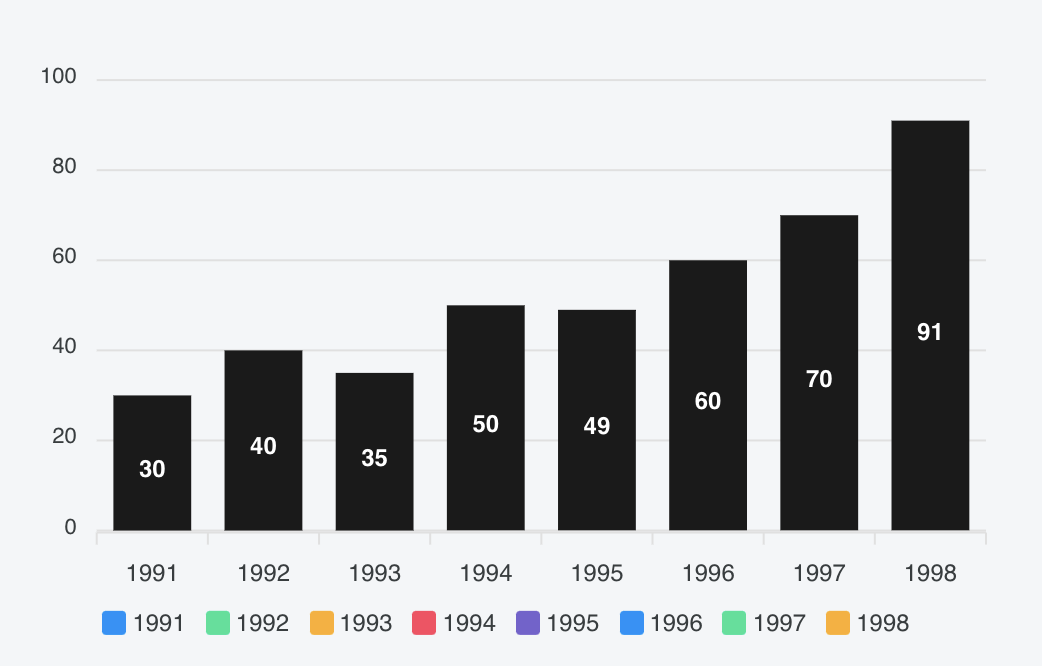
Bars are not colored. Legends and tool tips display colors perfectly but all the bars are black colored.
Here is the Test Code:
`
<apexchart
width="500"
type="bar"
:options="chartOptions"
:series="series"
<script> import VueApexCharts from "vue3-apexcharts"; export default { name: "BarChart", props: ["chartData"], components: { apexchart: VueApexCharts, }, data() { return { chartOptions: { chart: { id: "Usage Chart", toolbar: { show: false, }, }, colors: ["#6371c7"], plotOptions: { bar: { columnWidth: "70%", distributed: true, }, }, grid: { row: { opacity: 0.6, }, }, xaxis: { categories: [1991, 1992, 1993, 1994, 1995, 1996, 1997, 1998], }, noData: { text: "Loading...", }, }, series: [ { name: "Usage", data: [30, 40, 35, 50, 49, 60, 70, 91], color: "#6371c7", fillColor: "#6371c7", }, ], }; }, }; </script>
`
Hey Guys,
I want to know if there's a way to zoom out my graph using "EVENTS" either using scroll or click . I have searched abit on internet. All I found is following Snippets that are not working on my graph.

Hi, I have a web application where I am using ApexCharts with Vue 3 to plot some graphics. I didn't have any trouble using the scatter plot, but when I try to plot a timeline like this example of the website, it completely crashes and I don't know why. maybe I am doing something wrong, but I can't see any error. I would appreciate a lot if you can give me some help because it is important!
I attach here the code of the view:
<template>
    <apexchart type="rangeBar" height="350" :options="chartOptions" :series="series"></apexchart>
</template>
<script>
import axios from "../../../services/api.js";

export default {
  data() {
    return {
        chartOptions: {
            chart: {
                type: 'rangeBar'
            },

            plotOptions: {
                bar: {
                    horizontal: true,
                }
            },

            fill: {
              type: 'solid'
            },

            xaxis: {
              type: 'datetime'
            },
        },
        series: [
          {
            name: 'Prueba',
            data: [
               {
                  x: 'Code',
                  y: [
                    new Date('2019-03-02').getTime(),
                    new Date('2019-03-04').getTime()
                  ]
                },
                {
                  x: 'Test',
                  y: [
                    new Date('2019-03-04').getTime(),
                    new Date('2019-03-08').getTime()
                  ]
                },
                {
                  x: 'Validation',
                  y: [
                    new Date('2019-03-08').getTime(),
                    new Date('2019-03-12').getTime()
                  ]
                },
                {
                  x: 'Deployment',
                  y: [
                    new Date('2019-03-12').getTime(),
                    new Date('2019-03-18').getTime()
                  ]
                },
            ]
          },
      ], //end series
    }; //end return
  }, //end data

}
</script>
<style scoped>

</style>getting following error when loading with vuetify & histoire, could this be related to vite config?
"vue": "^3.2.41",
"vue3-apexcharts": "^1.4.1",
"vuetify": "3.0.3"
ReferenceError: SVG is not defined
    at /Users/jeffvoss/Sites/qui/node_modules/apexcharts/dist/apexcharts.common.js:10:12
    at Object.<anonymous> (/Users/jeffvoss/Sites/qui/node_modules/apexcharts/dist/apexcharts.common.js:10:8816)
    at Module._compile (node:internal/modules/cjs/loader:1126:14)
    at Object.Module._extensions..js (node:internal/modules/cjs/loader:1180:10)
    at Module.load (node:internal/modules/cjs/loader:1004:32)
    at Function.Module._load (node:internal/modules/cjs/loader:839:12)
    at Module.require (node:internal/modules/cjs/loader:1028:19)
    at require (node:internal/modules/cjs/helpers:102:18)
    at Object.95e6 (vue3-apexcharts:185:18)
    at __webpack_require__ (vue3-apexcharts:21:30)
i'm working on a vue 3 project with typescript and i need the x axis to recognize in dates
I've tried in several ways, including creating data with new Date(), passing "2018-09-19T00:00:00" in categories and labels, Date.now, but nothing is recognized
I realized that everything in the composition API is more complicated, but unfortunately there is no way to escape it.
I don't know if what I'm doing is wrong, if there's a right way to do this or if something is wrong.
 import apexcharts from "vue3-apexcharts";

components: {
    apexcharts,
  },
 const lineOptions = {
      chart: { id: 'total_of_professionals', type: 'line', height: 300, width: 400 },
      title: { text: 'Total de Profissionais', align: 'left' },
      markers: { size: 1},
      stroke: { width: 2, curve: 'smooth' },
      grid: { borderColor: '#F5F8FA' },
      xaxis: {
        type: 'datetime',
      },
      labels: ["2018-09-19T00:00:00", "2018-09-19T01:30:00", "2018-09-19T02:30:00", "2018-09-19T03:30:00", "2018-09-19T04:30:00",
                   "2018-09-19T05:30:00", "2018-09-19T06:30:00"],
     colors: ['#00E396'] },
};

const series = {
      name: 'Profissionais',
      data: [1,3,7,12,25,46,67,88]
}
return{
      options,
      series,
    }
<div class="col-xs-12 col-lg-4">
       <apexcharts :options="options" :series="series"></apexcharts>
    </div>

    "apexcharts": "3.23.1",
    "vue3-apexcharts": "^1.4.1",
labels: [new Date("2019-03-12").getTime(), new Date("2019-03-17").getTime()],

Thanks for this great plugin!
Unfortunately I am getting this error when trying to use the plugin in a typescript project. Can you please help
TS7016: Could not find a declaration file for module 'vue3-apexcharts'. 'C:/Trooptravel/Development/troop-explore-report/node_modules/vue3-apexcharts/dist/vue3-apexcharts.common.js' implicitly has an 'any' type.
Try npm i --save-dev @types/vue3-apexcharts if it exists or add a new declaration (.d.ts) file containing declare module 'vue3-apexcharts';
sorry - lol
When I try to npm install vue3-apexcharts I get the error of
Conflicting peer dependency: [email protected]
my package.json contains
"dependencies": {
    "apexcharts": "^3.33.1",
    "core-js": "^3.6.5",
    "vue": "^3.0.0",
    "vue-router": "^4.0.0-0"
  }
I tried to use vue3-apexcharts to plot a log-log chart and to my surprise it doesn't work.
using xaxis flags:
xaxis: { type: 'numeric', logarithmic: true,},
which I figured would be necessary to make it work, but to no avail.
And that for no chart type at all, be it line, scatter, or bubble.
Upon reading a bit into the behaviour (not documented on apex sites), not finding anything related on google/stack, and playing on codepen, I figured that vue3-apexcharts does not accept log x axis, which is rather strange given it is a basic feature of scientific charts.
Am I missing something? Is there a way to make it work or is it really a (very important) missing feature?
Does anyone know about these?
On the same subject, for bubble charts on the z axis, it would be a very interesting feature to have log scaling when presenting data sets with a big dynamic range. It could be a nice addition to the lib having a bubblesizing: logarithimic feature, avoiding a lot of js work, if someone were to touch this.
Thank you for the help!
Hi, there! I get this error (see attached image) when I use the Composition API and the Options API. Said error appears when I edit the script section of my component and save the changes.

<template>
  <VueApexCharts width="500" type="bar" :options="options" :series="series"></VueApexCharts>
  <button @click="newSeries">new series</button>
</template>

<script>
import VueApexCharts from "vue3-apexcharts";

import { ref } from "@vue/reactivity";

export default {
  name: "App",
  components: {
    VueApexCharts,
  },
  setup() {
    const options = ref({
      chart: {
        id: "vuechart-example",
      },
      xaxis: {
        categories: [1991, 1992, 1993, 1994, 1995, 1996, 1997, 1998],
      },
    });
    const series = ref([
      {
        name: "series-1",
        data: [30, 40, 45, 50, 49, 60, 70, 91],
      },
    ]);

    const newSeries = () => {
      const max = 90;
      const min = 45;
      const newData = series.value[0].data.map(() => {
        return Math.floor(Math.random() * (max - min + 1)) + min;
      });
      series.value = [
        {
          data: newData,
        },
      ];
    };
    return {
      newSeries,
      options,
      series,
    };
  },
};
</script>

<style></style>
Got a weird issue
In my view template I render a chart. First time it renders, the chart is double. I have a button which will re-render the chart, but even if I change page magnification, second one disappears.
My chartOptions are almost identical:
{
  "xaxis": {
    "convertedCatToNumeric": true
  },
}
{
  "xaxis": {
    "type": "numeric",
    "labels": {},
    "tickAmount": "dataPoints"
  },
}
any idea where to look to debug?
https://apexcharts.com/vue-chart-demos/box-whisker-charts/boxplot-scatter/
Hi,
Referring to your example above, it seems that maximum value appeared twice when there's mutliple series in boxplot chart.

Hi,
Is there any ways to we can highlight/darken the selected line while the lighten the color of the non selected line on hover? tried using states but doesn't seems to work?
needed something similar to onItemHover but with custom functionality to set the opacity of the other non selected lines
Attached a code pen for reference:
https://codepen.io/jessalynchua/pen/RwVQzeJ
Thank you!
I do all my work in a cms, so it's not possible to use build tools. I have to include it vue3-apexcharts with a script element and use it from there. I don't see there's an option for that here. Can that be provided, or can someone explain how to get that going?
I'm seeing the same issue as described in apexcharts/vue-apexcharts#134
Is this a regression or am I not configuring the chart correctly?
Hi guys!
I am using apexchart with Vue3-apexcharts/ Vue 3 / Typescript.
If a particular series is selected console thrown error when updating chart.
Does anyone know a solution?

<template>
<apexchart type="donut" width="50%" align="center" :options="options" :series="series"></apexchart>
</template>
<script lang="ts" setup>
import { mainStore} from "@/store/";
import { storeToRefs } from "pinia";
import { ref, Ref, reactive, watchEffect } from "vue";
const store = mainStore()
const { responseModel } = storeToRefs(store);

const data: dataInterface= reactive({ success: 0, fail: 0 })
const series: Ref<Array<number>> = ref([])
const options = {
    legend: {
        show: true,
        position: 'top',
        fontSize: '16px',
        labels: {
            colors: ["#fff"]
        }
    },
    labels: ['Success', 'Fail'],
    chart: {
        dataLabels: {
            enabled: false,
        },
        responsive: [{
            breakpoint: 480,
            options: {
                chart: {
                    width: 200
                },
                legend: {
                    show: false
                }
            }
        }],
        legend: {
            position: 'right',
            offsetY: 0,
            height: 230,
        },
        tooltip: {
            enabled: true
        }
    },

}

watchEffect(() => {
    if (responseModel.value !== undefined) {
        if (responseModel.value.isSuccess== true) {
            data.success+= 1
        } else if (responseModel.value.isSuccess== false) {
            data.fail += 1
        }
    }
    series.value = [data.success, data.fail]
})
</script>
is there a way for lazy loading or smth?
It appears that the readme is out of date since
import VueApexCharts from "vue3-apexcharts";
Vue.use(VueApexCharts);

Vue.component("apexchart", VueApexCharts);
is no longer valid syntax for Vue3.
Examples are also referenced but are only available for the Vue2 version.
What is the correct method to install this library?
If the series prop passed to the VueApexCharts component is an empty array ([]), the chart ignores the given chart.height option.
example:
  <div style="width: 300px; height: 100px; border: 2px solid red;">
    <VueApexCharts
      type="line"
      :options="{
        chart: {
          height: 100,
        },
        noData: {
          text: 'No data as expected'
        },
      }"
      :series="[]"
    />
  </div>
renders as

Hey guys,
I am facing an issue that if I am deselecting all legends its Still showing X-axis Dates/Years. I am using Vue 3

Hi, I am not able to update the data within my line chart.
I am sending data from some parent component to a child component (received as "bitcoindata" in "props". When starting the application everything looks fine, all data is visualized as expected. But when the data is updated in a regular time interval, it does not update the chart (although the data in the series object has been successfully updated).
It tried this with a watcher as well as a simple button. The funny thing is, that the update works, when I update the series object regularly from a lifecycle hook (--> outside of the setup function from Composition API). But I would like to have a better approach. Maybe you can help me. Thank you in advance.
<template>
  <div class="app">
    <apexchart
      ref="myChart"
      width="550"
      type="line"
      :options="chartOptions"
      :series="series"
    ></apexchart>
    <div>
      <button @click="updateChart">Manual Chart Update</button>
    </div>
  </div>
</template>

<script>
import { watch } from "vue";
export default {
  props: ["bitcoindata"],
  setup(props) {
    let series = [
      {
        name: "series-xy",
        data: props.bitcoindata,
      },
    ];
    const chartOptions = {
      chart: {
        id: "someid",
      },
      xaxis: {
        type: "datetime",
      },
    };

    watch(
      () => props.bitcoindata,
      () => {
        console.log("updating chart with watcher");
        const newData = props.bitcoindata;
        series = [
          {
            data: newData,
          },
        ];
      }
    );
    function updateChart() {
      console.log("updating chart via button");
      const newData = props.bitcoindata;
      series = [
        {
          data: newData,
        },
      ];
    }
    return {
      chartOptions,
      series,
      updateChart,
    };
  },
Here is the not so nice looking lifecycle hook:
mounted() {
    window.setInterval(async () => {
      console.log("auto updating chart after 5 min");
      const newData = this.bitcoindata;
      this.series = [
        {
          data: newData,
        },
      ];
    }, 300000);
  },
Hi,
Thanks for providing this wrapper for apexcharts.
Some issues that should be discussed and addressed soon:
ApexAxisChartSeries in the vue3-apexcharts package. v1.2.1 should have been released as v2.0.0 - I would strongly advice you to fix the releases.node_modules/vue3-apexcharts/typings/vue-apexcharts.d.ts:2:30 - error TS2307: Cannot find module 'vue/types/plugin' or its corresponding type declarations.
2 import { PluginObject } from 'vue/types/plugin';
~~~~~~~~~~~~~~~~~~
node_modules/vue3-apexcharts/typings/vue-apexcharts.d.ts:5:42 - error TS2709: Cannot use namespace 'Vue' as a type.
5 interface VueApexChartsComponent extends Vue {
~~~
node_modules/vue3-apexcharts/typings/vue-apexcharts.d.ts:36:59 - error TS2709: Cannot use namespace 'Vue' as a type.
36 declare const VueApexCharts: Component & ComponentOptions<Vue> & PluginObject<any>;
Thanks for the great project! Unfortunately I've been unable to use it due to this error. Any recommendations?
rangeArea charts are working fine in dev mode but it's crashing when i'm building it and serving through my static server.
The tab just hangs up and there is absolutely no response or error log available.
Has anyone else faced a similar issue with some other chart maybe? What could be a quick fix.
Please consider following steps to reproduce the apexchart rangeBar recursion bug using v3 vue.js!
package.json stub:
"dependencies": { "apexcharts": "^3.32.1", "core-js": "^3.6.5", "register-service-worker": "^1.7.1", "vue": "^3.0.0", "vue-router": "^4.0.0-0", "vue3-apexcharts": "^1.4.1", "vuex": "^4.0.0-0" },
Test steps:
Code:
<apexchart width="500" type="rangeBar" :options="options" :series="series"></apexchart>
export default { name: "About", components: { }, data: function() { return { options: { chart: { id: "vuechart-example" }, plotOptions: { bar: { horizontal: true, } }, xaxis: { type: "datetime" } }, series: [{ data: [ { x: "Analysis", y: [ new Date("2019-02-27").getTime(), new Date("2019-03-04").getTime() ] }, { x: "Design", y: [ new Date("2019-03-04").getTime(), new Date("2019-03-08").getTime() ] }, { x: "Coding", y: [ new Date("2019-03-07").getTime(), new Date("2019-03-10").getTime() ] }, { x: "Testing", y: [ new Date("2019-03-08").getTime(), new Date("2019-03-12").getTime() ] }, { x: "Deployment", y: [ new Date("2019-03-12").getTime(), new Date("2019-03-17").getTime() ] } ] }], } } }
Hey,
Is it possible to reduce the bundle size for the Vue 3 ApexCharts wrapper?
Everything was working the other day and now I am getting some weird error.
Uncaught (in promise) TypeError: n is undefined
    value apexcharts.common.js:6
    value apexcharts.common.js:6
    value apexcharts.common.js:6
    value apexcharts.common.js:6
    value apexcharts.common.js:14
    value apexcharts.common.js:6
    value apexcharts.common.js:14
    value apexcharts.common.js:14
    init vue3-apexcharts.common.js:326
    setup vue3-apexcharts.common.js:411
    callWithErrorHandling runtime-core.esm-bundler.js:154
    callWithAsyncErrorHandling runtime-core.esm-bundler.js:163
    __weh runtime-core.esm-bundler.js:1910
    flushPostFlushCbs runtime-core.esm-bundler.js:333
    flushJobs runtime-core.esm-bundler.js:369
    promise callback*queueFlush runtime-core.esm-bundler.js:264
    queueJob runtime-core.esm-bundler.js:258
    run reactivity.esm-bundler.js:183
    trigger reactivity.esm-bundler.js:189
    set reactivity.esm-bundler.js:291
    set runtime-core.esm-bundler.js:6154
What's the issue? Can we get better error handling?
my code :
<apexchart type="area" ref="chartRef" :options="chartOptions" :series="series"></apexchart>
and when I call this.$refs.chartRef.zoomX() ,
it said "Uncaught TypeError: this.$refs.chartRef.zoomX is not a function".
cosole.log(this.$refs.chartRef)
exist, and It's a Proxy, but can't find property zoomX or other method.
How can I access this method ?
use Vue.toRaw to resolve the Proxy? but it does't work.
Thanks your look, help me
I've assigned a global state to series.data but is not changed when global state is changed.
data() {
return {
series: [{
name: 'apicalls',
data : apiCalls[this.$store.state.currentDay]
}],
chartOptions: {
chart: {
zoom: {
enabled : false,
},
},
fill : {
type : 'gradient',
colors : "#00FFDC"
},
dataLabels : {
enabled: false
},
stroke : {
curve: 'straight',
width : .5,
},
        title : {
          // text: 'Fundamental Analysis of Stocks',
          // align: 'left'
        },
        subtitle : {
          // text: 'Price Movements',
          // align: 'left'
        },
        labels : [10,20,30,40,50],
        xaxis : {
          type : 'datetime',
        },
        yaxis : {
          opposite: true
        },
        legend : {
          horizontalAlign: 'right'
        }
    },
}
}
Hi!
I'm trying to use vue3-apexcharts in layout, controlled via flexbox. In my page I have an area that contains 2 items - one of them is the chart and the second has fixed height. I want to fill the cross-axis with these two items. The problem that I have is that the chart cannot shrink enough. I set it "flex 1 1 auto", but the second item (the one with the fixed height) which is bellow the chart is going out of the area. I tried to debug this and I see that the reason is too big "min-height" value, set to the chart. That's why the chart cannot shrink as much as needed. I cannot understand where this "min-height" comes from. I haven't set "height" option of the chat. I also tried to se it to 100%, but the result is the same. Then I tried to override the "min-height" (only in debug, from the browser), but the value is immediately returned back to the original one. Please, give me an advice how to solve my problem.
To run the examples,
cd demo
yarn install
yarn start
got
 ERROR  Failed to compile with 1 errors                      1:32:41 AM

This relative module was not found:

* ../../dist/vue3-apexcharts.common in ./src/main.js
found in .gitignore
dist/
dist/vue3-apexcharts.common.js.map
dist/vue3-apexcharts.umd.js
dist/vue3-apexcharts.umd.js.map
dist/vue3-apexcharts.umd.min.js
dist/vue3-apexcharts.umd.min.js.map
demo/node_modules
?
I have this options.
const options = reactive({
      chart: {
        id: 'vue-chart'
      },
      xaxis: {
        type: 'datetime',
        min: new Date().getTime() - 60000,
        max: new Date().getTime()
      }
})
I'm updating on a watch function. Chart need to show the last 60 seconds, is a real time chart line showing data from a temperature sensor. But the chart is fixed with the default min/max value, the value when I created options. The chart is update every 10 seconds.
 watch(
      () => devices.testDevice1.data.temp,
      () => {
        //[...code...]
        options.xaxis.min = new Date().getTime() - 60000
        options.xaxis.max = new Date().getTime()
        //[...code...]
      }
    )
Switching a route inside an apexchart event callback causes an error in the console.

(I've been using the solution suggested in #20 to bind the event)
<apexchart
   ...
   @markerClick="click"
></apexchart>
const click = () => {
router.push('/data');
};Complete code and example: https://stackblitz.com/edit/vue3-apex-router-bug?devtoolsheight=33&file=index.html
Hi,
thanks for the great plugin first of all!
I have used several charts so far, but the bar chart surprisingly is giving me a ton of headache.
Managed to implement heatmaps and pie charts on Vue 3, but the bar...
Whenever I try to update the Options to update the categories I get a duplicate of the chart, like so:

Tried using this method, as described here:
        updateBarChartOptions() {

            let cats = this.loadDurationCategories();


            console.log('Categories updating to: ' + cats)

                this.chartOptions4 = {

                    ...this.chartOptions4,
                    ...{
                    xaxis: {
                        categories: cats
                    }
                }
            }
        },
Tried to update them, by just using a computed property, like so:
        durationCategories() {
            let categories = this.loadDurationCategories()
            return categories
        },
Where the loadDurationategories() method just returns a new Array, like: [1, 2, 3.... etc]
The computed property seems to not work at all, as I am getting an error from the slice, indicating that the array never makes it to the chart.
Any help is greatly appreciated!
Thanks!
Hi guys! Am I doing something wrong here or did I discover a bug?
Problem: When changing the labels in the radialbar graph in Vue3, the graph shrinks quite a bit.
Steps to reproduce:
Code:
<template>
  <div>Dashboard</div>
  <VueApexCharts
      width="30%"
      type="radialBar"
      :options="chartOptions"
      :series="capacity"
  />

  <button :onclick=changeLabels>change label</button>
</template>

<script>

import VueApexCharts from "vue3-apexcharts";

export default {
  name: 'Dashboard',
  props: {},
  components: { VueApexCharts },

  data: function() {
    return {
      chartOptions: {
        chart: {
            height: 280,
            type: "radialBar",
        },
        title: {
            text: "Test",
            style: {fontSize: "24px", color: "white"}
        },
        plotOptions: {
            radialBar: {
                dataLabels: {
                    total: {
                        show: true,
                        label: "TOTAL",
                        formatter: function (w) {
                            let result = w.globals.seriesTotals.reduce((a, b) => {
                                return a + b
                            }, 0) / w.globals.series.length;
                            return Math.round(result * 100) / 100 + "%";
                        }
                    },
                    value: {
                        formatter: function (v) {
                            return Math.round(v * 100) / 100 + "%";
                        }
                    }
                },
            }
        },
        labels: ["L1", "L2"],
        colors: [
            "#3366CC", "#DC3912", "#FF9900", "#109618", "#990099", "#3B3EAC", "#0099C6", "#DD4477", "#66AA00", "#B82E2E", "#316395",
            "#994499", "#22AA99", "#AAAA11", "#6633CC", "#E67300", "#8B0707", "#329262", "#5574A6", "#3B3EAC"
        ]
      },
      capacity: [88, 54]
    }
  },

  methods: {
    changeLabels: function() {
      this.chartOptions = {
        ...this.chartOptions,
        ...{
          labels: ["L4", "L5"]
        }
      }
    },


  }
}
</script>
ApexCharts version(s): "apexcharts": "^3.36.3" and "vue3-apexcharts": "^1.4.1"
Before:

After:

OS: macOS Monterey v12.6
Google Chrome version: 106.0.5249.119 (Official Build) (arm64)
Usage:
<Chart
    ref="realtimeChart"
    width="520"
    :options="getChartOptions('pie')"
    :series="[]"
/>

const getChartOptions = (type = 'pie') => ({
  series: [],
  chart: {
    type,
  },
  noData: {
    text: 'Please check the date range and whether you have submitted your worklogs to Jira.',
    align: 'left',
    verticalAlign: 'middle',
    offsetX: -10,
    offsetY: -200,
  },
  responsive: [
    {
      breakpoint: 650,
      options: {
        chart: {
          width: '100%',
        },
      },
    },
    {
      breakpoint: 450,
      options: {
        legend: { position: 'bottom' },
      },
    },
  ],
  tooltip: {
    theme: true,
    custom({ seriesIndex, w }: IChartOptionsCustom) {
      return w.globals.labels[seriesIndex]
    },
  },
})
The result and the problem you can see by watch this video:
https://www.loom.com/share/205026ac67434ca2be05b2c7e49a7484
How can I solve this problem or what am I doing wrong?
If i try to change the type of the chart from a bar-chart to a line-chart it causes an error.
The error is : "TypeError Cannot read property '_updateOptions' of null"
I used the example from Github
Here is a testcase which gives the error using the example.
LInk to sandbox
When pressing update it change the prop-type from "bar" to "line" which will the cause the error.
I get some warning in the chrome console:
[Vue warn]: Invalid watch source:  undefined A watch source can only be a getter/effect function, a ref, a reactive object, or an array of these types.
  at <Apexchart height="350" options= {chart: {…}, colors: Array(1), fill: {…}, plotOptions: {…}, xaxis: {…}, …} series= [{…}] >
  at <Last7DaysOrdersChart chart-data= {} >
What does it mean
Invalid watch source: undefined
???
The component works fine... but it's annoying that warning.
The component is this:
import VueApexCharts from "vue3-apexcharts";
import {ref, toRefs, watch} from "vue";

export default {
    name: "Last7DaysOrdersChart",
    components: {VueApexCharts},
    props: {
        chartData: {
            type: Object,
            required: true
        }
    },
    setup(props) {
        const  last7DaysOrdersChartOptions = ref({
            chart: {
                id: "last_7_days_orders",
                type: 'bar',
                toolbar: {
                    show: false,
                }
            },
            colors: ['#fb6340'],
            fill: {
                opacity: 1,
            },
            plotOptions: {
                bar: {
                    columnWidth: '45%',
                }
            },
            xaxis: {
                axisBorder: {
                    show: false
                },
                axisTicks: {
                    show: false
                },
            },
            labels: [],
        })

        const last7DaysOrdersChartSeries = ref([
            {
                name: "Orders",
                data: []
            }
        ])

        const { chartData } = toRefs(props)
        const updateOptionsChart = () => {
            window.ApexCharts.exec("last_7_days_orders", "updateOptions", {
                series: [{
                    data: chartData.value
                }],
            });
        }

        watch(chartData, updateOptionsChart)

        return {last7DaysOrdersChartOptions,last7DaysOrdersChartSeries}
    }
}

I got my ApexCharts working quite well. Using composer API, Vue3.
axios
      .post(
        url,
        { serial: 'abc123 },
        { headers: { Authorization: "Bearer xxxxxxx" } }
      )
      .then((r) => {
        chartOptions.xaxis.categories=r.data.labels
        series[0].data = r.data.xaxisSecond;
        series[1].data = r.data.xaxisFirst;
      });
In the above example, the data, series[x] updates correctly in chart, but labels do not. But as you can see from screenshot, it is being passed to the view
Setting "brush" will throw the following error:
Unable to preventDefault inside passive event listener invocation.
I used the following example to reproduce it:
https://apexcharts.com/vue-chart-demos/line-charts/brush-chart/
It works fine in version 2
this is my code
    var seriesData = ref([{
      data:
      [
                {
                  x: 'Analysis',
                  y: [
                    new Date('2019-02-27').getTime(),
                    new Date('2019-03-04').getTime()
                  ],
                  fillColor: '#008FFB'
                },
                {
                  x: 'Design',
                  y: [
                    new Date('2019-03-04').getTime(),
                    new Date('2019-03-08').getTime()
                  ],
                  fillColor: '#00E396'
                },
                {
                  x: 'Coding',
                  y: [
                    new Date('2019-03-07').getTime(),
                    new Date('2019-03-10').getTime()
                  ],
                  fillColor: '#775DD0'
                },
                {
                  x: 'Testing',
                  y: [
                    new Date('2019-03-08').getTime(),
                    new Date('2019-03-12').getTime()
                  ],
                  fillColor: '#FEB019'
                },
                {
                  x: 'Deployment',
                  y: [
                    new Date('2019-03-12').getTime(),
                    new Date('2019-03-17').getTime()
                  ],
                  fillColor: '#FF4560'
                }
              ]
      }]);
long time render chart about 10 seconds
and show this error
runtime-core.esm-bundler.js?9e79:386 Uncaught (in promise) Error: Maximum recursive updates exceeded. This means you have a reactive effect that is mutating its own dependencies and thus recursively triggering itself. Possible sources include component template, render function, updated hook or watcher source function.
    at checkRecursiveUpdates (runtime-core.esm-bundler.js?9e79:386)
    at flushPreFlushCbs (runtime-core.esm-bundler.js?9e79:304)
    at flushPreFlushCbs (runtime-core.esm-bundler.js?9e79:312)
    at flushPreFlushCbs (runtime-core.esm-bundler.js?9e79:312)
    at flushPreFlushCbs (runtime-core.esm-bundler.js?9e79:312)
    at flushPreFlushCbs (runtime-core.esm-bundler.js?9e79:312)
    at flushPreFlushCbs (runtime-core.esm-bundler.js?9e79:312)
    at flushPreFlushCbs (runtime-core.esm-bundler.js?9e79:312)
    at flushPreFlushCbs (runtime-core.esm-bundler.js?9e79:312)
    at flushPreFlushCbs (runtime-core.esm-bundler.js?9e79:312)
I was expecting the options to be reactive. In the code example below, the startDate and endDate are related to the annotation in the options, but when clicking the button Process, which sets the new annotation, the chart does not re-render.
This is the example code:
<template>

  <div class='row q-gutter-md'>

    <q-input label='Start Date'
             v-model='data.startDate' />

    <q-input label='End Date'
             v-model='data.endDate' />

    <q-btn label='Process' @click='process' />

  </div>

  <apexchart width='900'
             :options='options'
             :series='series'
             @dataPointSelection='onClick' />

</template>

<script lang='ts'>
  import { defineComponent, reactive } from 'vue';

  export default defineComponent({
    name: 'ProgramTimeline',

    setup() {

      const portfolioWindowColor = '#c7b2d6';
      const programColor = '#098489';
      const phantomColor = '#86d0cc';


      const data = reactive({
        startDate: '2020-06-01',
        endDate: '2021-06-01'
      });


      const series = [
        {
          name: 'Program 1',
          data: [
            {
              x: 'Pool 1',
              y: [
                new Date('2019-01-01').getTime(),
                new Date('2020-01-01').getTime()
              ],
              meta: { id: 1 }
            },
            {
              x: 'Pool 1',
              y: [
                new Date('2020-01-01').getTime(),
                new Date('2021-01-01').getTime()
              ]
            },
            {
              x: 'Pool 1',
              y: [
                new Date('2021-01-01').getTime(),
                new Date('2022-01-01').getTime()
              ]
            }
          ]
        },

        {
          name: 'Program 2',
          data: [
            {
              x: 'Pool 2',
              y: [
                new Date('2018-01-01').getTime(),
                new Date('2019-01-01').getTime()
              ]
            },
            {
              x: 'Pool 2',
              y: [
                new Date('2019-01-01').getTime(),
                new Date('2020-01-01').getTime()
              ]
            },
            {
              x: 'Pool 2',
              y: [
                new Date('2020-01-01').getTime(),
                new Date('2021-01-01').getTime()
              ],
              fillColor: phantomColor
            }
          ]
        },

        {
          name: 'Program 3',
          data: [
            {
              x: 'Pool 3',
              y: [
                new Date('2018-06-01').getTime(),
                new Date('2019-06-01').getTime()
              ]
            },
            {
              x: 'Pool 3',
              y: [
                new Date('2019-06-01').getTime(),
                new Date('2020-06-01').getTime()
              ]
            }
          ]
        }

      ];


      const options = {

        colors: [programColor],

        chart: {
          height: 450,
          type: 'rangeBar',
          dropShadow: {
            enabled: false
          }
        },

        tooltip: {
          x: {
            show: true,
            format: 'dd MMM yyyy'
          },
          y: {
            formatter: undefined,
            title: {
              formatter: (seriesName: any) => `${seriesName}`
            }
          }
        },

        annotations: newPortfolioWindow(data.startDate, data.endDate),

        plotOptions: {
          bar: {
            horizontal: true,
            barHeight: '25%',
            rangeBarGroupRows: true
          }
        },

        xaxis: {
          type: 'datetime'
        },

        grid: {
          xaxis: {
            lines: {
              show: true
            }
          }
        },

        stroke: {
          width: 1.5,
          colors: ['white']
        },

        fill: {
          type: 'solid',
          opacity: 0.6
        },

        legend: {
          show: false
        }
      };


      function newPortfolioWindow(start: string, end: string) {
        const startDate = new Date(start).getTime();
        const endDate = new Date(end).getTime();
        return {
          xaxis: [
            {
              x: startDate,
              x2: endDate,
              fillColor: portfolioWindowColor,
              label: {
                text: 'Portfolio window',
                textAnchor: 'left',
                position: 'top',
                orientation: 'horizontal',
                style: {
                  background: '#fff',
                  color: '#777'
                }
              }
            }
          ]
        };
      }


      function process() {
        // This should re-render the chart, but it's not working.
        options.annotations = newPortfolioWindow(data.startDate, data.endDate);
        console.debug(options.annotations);
      }


      function onClick(event: any, chartContext: any, config: any) {
        const { seriesIndex, dataPointIndex } = config;
        const element = series[seriesIndex]['data'][dataPointIndex];
        alert(JSON.stringify(element));
      }

      return { series, options, data, onClick, process };
    }
  });
</script>
These are the versions I'm using:
    "apexcharts": "^3.28.1",
    "vue3-apexcharts": "^1.4.1",
In newly created Nuxt app every time I try to install apex chart via:
npm install --save apexcharts
npm install --save vue3-apexcharts
Here is log of errors:
npm ERR! code ERESOLVE
npm ERR! ERESOLVE unable to resolve dependency tree
npm ERR!
npm ERR! Found: [email protected]
npm ERR! node_modules/vue
npm ERR! peer vue@"> 3.0.0" from [email protected]
npm ERR! node_modules/vue3-apexcharts
npm ERR! vue3-apexcharts@"*" from the root project
npm ERR!
npm ERR! Could not resolve dependency:
npm ERR! peer vue@"^2.0.0" from [email protected]
npm ERR! node_modules/vuex
npm ERR! vuex@"^3.6.0" from @nuxt/[email protected]
npm ERR! node_modules/@nuxt/vue-app
npm ERR! @nuxt/vue-app@"2.14.12" from @nuxt/[email protected]
npm ERR! node_modules/@nuxt/builder
npm ERR! @nuxt/builder@"2.14.12" from [email protected]
npm ERR! node_modules/nuxt
npm ERR!
npm ERR! Fix the upstream dependency conflict, or retry
npm ERR! this command with --force, or --legacy-peer-deps
npm ERR! to accept an incorrect (and potentially broken) dependency resolution.
npm ERR!
npm ERR! See /Users/ali/.npm/eresolve-report.txt for a full report.
I've been trying to fire an event whenever someone clicks somewhere on the chart but I've been unable to do it with a vue3 project setup. My charts are showing fine but firing events does not work.
I've used the following code:
<apexchart type="rangeBar" width="500px" :options="chartOptions" :series="series"></apexchart>
setup() {
    const series = [
            {
              name: 'Sunny',
              data: [
                {
                  x: 'Weather',
                  y: [
                    new Date('2019-03-05').getTime(),
                    new Date('2019-03-08').getTime()
                  ]
                },
              ]
            },
            {
              name: 'Rainy',
              data: [
                {
                  x: 'Weather',
                  y: [
                    new Date('2019-03-02').getTime(),
                    new Date('2019-03-05').getTime()
                  ]
                },
              ]
            }
          ];

  const chartOptions = {
            chart: {
              height: 800,
              width: 800,
              type: 'rangeBar',
              events: {
                    click(event, chartContext, config) {
                        alert(event, chartContext, config);
                    }
                },

            },
            plotOptions: {
              bar: {
                horizontal: true
              }
            },

            fill: {
              type: 'gradient',
              gradient: {
                shade: 'light',
                type: 'vertical',
                shadeIntensity: 0.25,
                gradientToColors: undefined,
                inverseColors: true,
                opacityFrom: 1,
                opacityTo: 1,
                stops: [50, 0, 100, 100]
              }
            },
            xaxis: {
              type: 'datetime'
            },
            title: {
              text: "Scene Viewer",
              align: "center",
              style: {
                fontSize: "15px"
              }
            },
            legend: {
              position: 'top'
            }
          };

        const options = {
        chart: {
          id: 'vuechart-example',
          events: {
                    click(event, chartContext, config) {
                        alert(event, chartContext, config);
                        console.log("wqewqeqeqweq")
                        alert("qwewqeqeqe")
                    }
                },
        },
        xaxis: {
          categories: [1991, 1992, 1993, 1994, 1995, 1996, 1997, 1998]
        }
      }
  }
Is anyone else having issues with events? Am I missing a piece of configuration? Any help would be greatly appreciated.
Env:
"apexcharts": "^3.22.2",
"vue": "^3.0.2",
"vue3-apexcharts": "^1.1.1"
My options:
{
 chart: {
        height: 590,
        type: "area",
      },
      dataLabels: {
        enabled: false,
      },
      stroke: {
        curve: "smooth",
      },
      xaxis: {
        labels: {
          showDuplicates: false,
          hideOverlappingLabels: true,
          offsetY: 20,
          style: {
            colors: "#979797",
          },
        },
      },
}
Template:
<apexchart type="area" :height="590" :options="options" :series="series" />
Result:

Note: when I change a screen resolution, the duplicated one disappears
Hello!
I am using your vue3-apexcharts in my project.
In my project, I have five tabs and inside each of them I have one apexcharts component instance, is there any way to render them when the tab is opened. At the moment all charts are rendering once when the component is being loaded. I saw that you already have render() function for HTML charts to reinitialize apexchart instance. Didn't found any alternative solution for the vue3-apexcharts.
I'm trying to import this into a quasar project. I'm getting this error in the developer console:
Uncaught TypeError: Object(...) is not a function
fb15 vue3-apexcharts.common.js:257
webpack_require vue3-apexcharts.common.js:22
exports vue3-apexcharts.common.js:101
vue3-apexcharts.common.js:103
js vendor.js:2797
webpack_require app.js:854
fn app.js:151
apex.js:1
js app.js:1182
webpack_require app.js:854
fn app.js:151
client-entry.js:18
js app.js:1019
webpack_require app.js:854
fn app.js:151
0 app.js:1338
webpack_require app.js:854
checkDeferredModules app.js:46
app.js:994
app.js:997
Not sure if its me or the library. This is my first time using it.
Unable to use this plugin inside the Quasar 2 (Vue 3) App with enabled SSR mode.
Tried different methods to install it, how it was with Quasar 1 (with Vue 2 on board) but it doesn't work.
I use the following approach:
// boot/apex-charts.ts
import { boot } from 'quasar/wrappers';

export default boot(({ app }) => {
  app.use(() => import('vue3-apexcharts')); // dynamically load, like it was with Vue 2
});
And got the following error in app console:
[Quasar Dev Webserver] / -> request took: 128ms
(node:22769) UnhandledPromiseRejectionWarning: ReferenceError: window is not defined
    at Object.<anonymous> (/Users/ebuster/Developer/dashboard/ui3/node_modules/apexcharts/dist/apexcharts.common.js:6:355061)
    at Module._compile (internal/modules/cjs/loader.js:1085:14)
    at Object.Module._extensions..js (internal/modules/cjs/loader.js:1114:10)
    at Module.load (internal/modules/cjs/loader.js:950:32)
    at Function.Module._load (internal/modules/cjs/loader.js:790:12)
    at Module.require (internal/modules/cjs/loader.js:974:19)
    at require (internal/modules/cjs/helpers.js:93:18)
    at Object.95e6 (/Users/ebuster/Developer/dashboard/ui3/node_modules/vue3-apexcharts/dist/vue3-apexcharts.common.js:185:18)
    at __webpack_require__ (/Users/ebuster/Developer/dashboard/ui3/node_modules/vue3-apexcharts/dist/vue3-apexcharts.common.js:21:30)
    at Module.fb15 (/Users/ebuster/Developer/dashboard/ui3/node_modules/vue3-apexcharts/dist/vue3-apexcharts.common.js:224:74)
(node:22769) UnhandledPromiseRejectionWarning: Unhandled promise rejection. This error originated either by throwing inside of an async function without a catch block, or by rejecting a promise which was not handled with .catch(). To terminate the node process on unhandled promise rejection, use the CLI flag `--unhandled-rejections=strict` (see https://nodejs.org/api/cli.html#cli_unhandled_rejections_mode). (rejection id: 2)
App started by typical command: quasar dev -m ssr
Dependencies:
    "quasar": "^2.0.0",
    //...
    "apexcharts": "^3.30.0",
    "vue3-apexcharts": "^1.4.1",
   //...
    "vue": "^3.2.24",
  },
Is there any way to make the chart only show the specific series when clicking on the legend for that series. For current option, toggleDataSeries, I only can trigger the series to show/hide. I want it to hide other series when I clicking on it and only shows the series I clicked.
Hey all,
I've spent the last few hours trying to programatically call zoomX on a chart and I claim defeat :)
I've got an async mounted() hook so I am assuming it's fair that the DOM isn't ready yet.
But then I use a sync updated() hook and all I can get access to it always a Proxy.
this.$ref.myChart
is always a proxy and from there I have no idea what to do right.
this.$ref.myChart.chart
remains undefined.
I even tried a composition API approach but with the same result. How do I get access to functions like zoomX? :D
A declarative, efficient, and flexible JavaScript library for building user interfaces.
🖖 Vue.js is a progressive, incrementally-adoptable JavaScript framework for building UI on the web.
TypeScript is a superset of JavaScript that compiles to clean JavaScript output.
An Open Source Machine Learning Framework for Everyone
The Web framework for perfectionists with deadlines.
A PHP framework for web artisans
Bring data to life with SVG, Canvas and HTML. 📊📈🎉
JavaScript (JS) is a lightweight interpreted programming language with first-class functions.
Some thing interesting about web. New door for the world.
A server is a program made to process requests and deliver data to clients.
Machine learning is a way of modeling and interpreting data that allows a piece of software to respond intelligently.
Some thing interesting about visualization, use data art
Some thing interesting about game, make everyone happy.
We are working to build community through open source technology. NB: members must have two-factor auth.
Open source projects and samples from Microsoft.
Google ❤️ Open Source for everyone.
Alibaba Open Source for everyone
Data-Driven Documents codes.
China tencent open source team.