Giter VIP home page Giter VIP logo

atop's Introduction

Created/maintained by Gerlof Langeveld [email protected]

Introduction

Atop is an ASCII full-screen performance monitor for Linux that is capable of reporting the activity of all processes (even if processes have finished during the interval), daily logging of system and process activity for long-term analysis, highlighting overloaded system resources by using colors, etcetera. At regular intervals, it shows system-level activity related to the CPU, memory, swap, disks (including LVM) and network layers, and for every process (and thread) it shows e.g. the CPU utilization, memory growth, disk utilization, priority, username, state, and exit code. In combination with the optional kernel module netatop, it even shows network activity per process/thread. In combination with the optional daemon atopgpud, it also shows GPU activity on system level and process level. Furthermore cgroup-level resource consumption can be shown, optionally with the processes contained by these cgroups.

Highlights

The command atop has some major advantages compared to other performance monitoring tools:

  • Text mode for details and bar graph mode for global overview. In text mode details are shown about the utilization of system resources and the resource consumption by processes. In bar graph mode a (character-based) graphical overview is given about the utilization of the processors, disks, network interfaces and memory on system level.

  • Cgroups overview. In text mode the cgroups hierarchy can be shown with the utilization of CPU, memory and disk resources and the processes contained by these cgroups.

  • Resource consumption by all processes. It shows the resource consumption by all processes that were active during the interval, so also the resource consumption by those processes that have finished during the interval.

  • Utilization of all relevant resources. Obviously it shows system-level counters concerning utilization of cpu and memory/swap, however it also shows disk I/O and network utilization counters on system level.

  • Permanent logging of resource utilization. It is able to store raw counters in a file for long-term analysis on system level and process level. These raw counters are compressed at the moment of writing to minimize disk space usage. By default, the daily logfiles are preserved for 28 days. System activity reports can be generated from a logfile by using the atopsar command.

  • Highlight critical resources. It highlights resources that have (almost) reached a critical load by using colors for the system statistics.

  • Scalable window width. It is able to add or remove columns dynamically at the moment that you enlarge or shrink the width of your window.

  • Resource consumption by individual threads. It is able to show the resource consumption for each thread within a process.

  • Watch activity only. By default, it only shows system resources and processes that were really active during the last interval, so output related to resources or processes that were completely passive during the interval is by default suppressed.

  • Watch deviations only. For the active system resources and processes, only the load during the last interval is shown (not the accumulated utilization since system boot or process startup).

  • Accumulated process activity per user. For each interval, it is able to accumulate the resource consumption for all processes per user.

  • Accumulated process activity per program. For each interval, it is able to accumulate the resource consumption for all processes with the same name.

  • Accumulated process activity per container. For each interval, it is able to accumulate the resource consumption for all processes within the same container.

  • Network activity per process. In combination with the optional kernel module netatop or the BPF module netatop-bpf, it shows process-level counters concerning the number of TCP and UDP packets transferred, and the consumed network bandwidth per process.

  • GPU activity on system level and per process. In combination with the optional daemon atopgpud, it shows system-level and process-level counters concerning the load and memory utilization per GPU.

Links

atop's People

Contributors

7h3w1zz avatar algebra970 avatar atoptool avatar blackikeeagle avatar c0rn3j avatar codebling avatar db48x avatar eladso avatar ffontaine avatar gleventhal avatar hashworks avatar hunter1016 avatar jbd avatar jubnzv avatar liutingjieni avatar meinhardzhou avatar natoscott avatar pizhenwei avatar roadrunner2 avatar rpungartnik avatar shirleyfei avatar sjonhortensius avatar sylmarch avatar theesm avatar thesamesam avatar ton31337 avatar vinc17fr avatar xixiliguo avatar zlandau avatar zugschlus avatar

Stargazers

 avatar  avatar  avatar  avatar  avatar  avatar  avatar  avatar  avatar  avatar  avatar  avatar  avatar  avatar  avatar  avatar  avatar  avatar  avatar  avatar  avatar  avatar  avatar  avatar  avatar  avatar  avatar  avatar  avatar  avatar  avatar  avatar  avatar  avatar  avatar  avatar  avatar  avatar  avatar  avatar  avatar  avatar  avatar  avatar  avatar  avatar  avatar  avatar  avatar  avatar  avatar  avatar  avatar  avatar  avatar  avatar  avatar  avatar  avatar  avatar  avatar  avatar  avatar  avatar  avatar  avatar  avatar  avatar  avatar  avatar  avatar  avatar  avatar  avatar  avatar  avatar  avatar  avatar  avatar  avatar  avatar  avatar  avatar  avatar  avatar  avatar  avatar  avatar  avatar  avatar  avatar  avatar  avatar  avatar  avatar  avatar  avatar  avatar  avatar  avatar

Watchers

 avatar  avatar  avatar  avatar  avatar  avatar  avatar  avatar  avatar  avatar  avatar  avatar  avatar  avatar  avatar  avatar  avatar  avatar  avatar  avatar  avatar  avatar  avatar  avatar  avatar  avatar  avatar

atop's Issues

Problem with numerical scaling

I'm having a formatting issue with the RDDSK and WRDSK stats, where if there's ~10M/s or more usage, the stats render as 0.0G/s.

Tried to isolate the issue, but I'm not certain exactly where the problem is, maybe around here? Something might be overflowing, anyone more familiar with the code can take a look?

atopacctd does not start gracefully if process accounting is stopped

This is me forwarding https://bugs.debian.org/cgi-bin/bugreport.cgi?bug=851875

The chain of events is:

  • I paused process accounting using the mentioned command
  • I started the upgrade
  • postinst tries to start atopacct
    (invoke-rc.d atopacct start, generated by dh_installinit
  • atopacct waits for new accounting entries to appear, fails
    after some timeout
  • invoke-rc.d returns failure, breaking the update

So it really looks like a different bug. -> new ticket opened.

Thanks to Jan Niehusman

Use DKMS to build netatop kernel module

Is there a reason this isn't already implemented? I was about to dig into the man page for DKMS and see if I couldn't figure it out, then I thought it'd be prudent to ask those who've been active on the project if it was even a worthwhile endeavor. All thoughts and experiences are welcome.

atop: logging writing to a full disk ?

Hi,
i'm using atop 2.2-2.1 on a SLES 12 SP4 HA-Cluster.
I'm logging each second. This creates of course some waste of disk space and some CPU time, but i have enough cores and only a few logfiles are kept, the rest is discarded.
Some days ago i had the problem that several virtual machines (kvm) were paused, all at the same moment.
I think that a logical volume in which i store temporary some snapshots filled up, but i'm not sure because the snapshots are created by a script and at the end of the script they are deleted.
I'm thinking now of looking in atop if data is still written to that LV after the time i got e-Mails from my monitoring system that the virtual machines don't respond any longer.
My question is now: does atop monitor write requests to a full disk/LV ?
Maybe as a kind of "Trying to write" ?

Bernd

Binary log doesn't record usernames, just user IDs

When writing to the binary log with the -w option, then transferring that log to another machine, and reading with the -r option, the username IDs are looked up against the local machines users file, rather than being recorded by atop. This ends up with inconsistent results.

atop/atopsar - compress: failed due to lack of room in buffer

Hi,

I'm experiencing an issue which I do not know how to debug but I know how to reproduce it.

Make a vm in DigitalOcean with these specs:
size: 1core 1gig
region: london
OS: FreeBSD 11.2 x64 UFS

install atop and start it

it dies after 30 seconds "atop/atopsar - compress: failed due to lack of room in buffer"

It used to work on these machines but I assume it was broken either by an update on Digital Ocean or FreeBSD

Mention dependencies in README

It would be useful to mention, that before make systemdinstall you have to ./mkdate and install libncurses5-dev and libz-dev, otherwise the build would fail.

Consider using the precise pressure stall information ("total" collumn)

E.g. in practice, the "10 second average" takes several ten second intervals in order to update fully. You can test this with IO pressure: start an IO hog on an idle system.

Have you considered using the running "total" column from /proc/pressure/*, to get the precise average pressures over the atop interval? I think this could be more helpful, particularly when analyzing atop log files.

The kernel can't calculate the real "recent average" unless it keeps a cyclic buffer of historical values, which it does not bother to do. Instead it works similar uses the exact same function as the load average (EWMA).


The cpu file contains one line:

some avg10=2.04 avg60=0.75 avg300=0.40 total=157656722

The averages give the percentage of walltime in which one or more
tasks are delayed on the runqueue while another task has the
CPU. They're recent averages over 10s, 1m, 5m windows, so you can tell
short term trends from long term ones, similarly to the load average.

The total= value gives the absolute stall time in microseconds. This
allows detecting latency spikes that might be too short to sway the
running averages. It also allows custom time averaging in case the
10s/1m/5m windows aren't adequate for the usecase (or are too coarse
with future hardware).

atop Crash with: Malloc failed for new pinfo, also Error opening terminal: xterm-256color

Starting atop as non-root, results usually in "Malloc failed for new pinfo", and sometimes instead in "Error opening terminal: xterm-256color.".

Using htop and top instead works fine in same place (also as same user, non-root).

atop -V
Version: 2.3.0 - 2017/03/25 09:59:59

testfiber@Blitz:~$ atop ; free ; uname -a ; lsb_release -a ; ps aux | wc -l

Error opening terminal: xterm-256color.

          total        used        free      shared  buff/cache   available

Mem: 65917596 46154740 1283056 3684 18479800 19018152
Swap: 33554428 3030272 30524156

Linux Blitz 4.18.0-2-amd64 #1 SMP Debian 4.18.10-2 (2018-10-07) x86_64 GNU/Linux

No LSB modules are available.
Distributor ID: Debian
Description: Debian GNU/Linux testing (buster)
Release: testing
Codename: buster

726

testfiber@Blitz:~$ atop
Malloc failed for new pinfo

testfiber@Blitz:~$ atop ; free ; uname -a ; lsb_release -a ; ps aux | wc -l
Malloc failed for new pinfo
total used free shared buff/cache available
Mem: 65917596 46208788 1222880 3704 18485928 18964156
Swap: 33554428 3030016 30524412

Linux Blitz 4.18.0-2-amd64 #1 SMP Debian 4.18.10-2 (2018-10-07) x86_64 GNU/Linux

No LSB modules are available.

Distributor ID: Debian
Description: Debian GNU/Linux testing (buster)
Release: testing
Codename: buster

726

avio metric questions

Dear atop developer,

Hi, I am confused that 'avio' metric seems not as the document said.

The manual says "average number of milliseconds needed by a request (`avio') for seek, latency and data transfer". So I expect that avio should be something like await of iostat. But it turn out they are not(you could find it by using fio with iodepth>1). await represent the average time for IO request. But avio is not. Maybe it it not designed that way. But the manual of atop is misleading.

I try to find the different of avio and await. It seem avio is calculated by io_ms/iotot. io_ms is get from io_tics from /proc/diskstat which is as the kernel document says:
io_ticks milliseconds total time this block device has been active
(see kernel document Document/block/stat.txt. ) It do not increase if we have multiple IO inflight at same time. While await is calculated by
((sdc->rd_ticks - sdp->rd_ticks) + (sdc->wr_ticks - sdp->wr_ticks)) /((double) (sdc->nr_ios - sdp->nr_ios)) (see source common.c in sysstat v10.1.5).

So please give some help explaining avio.

An improved service file without atop.daily

I've improved my atop.service a little bit to don't use atop.daily. Maybe, this is helpful for you. Otherwise silently close this issue.

[Unit]
AssertPathExists=/usr/bin/atop

[Service]
PIDFile=/run/atop.pid
ExecStart=
ExecStart=/bin/sh -c 'exec /usr/bin/atop -w /var/log/atop/atop_`date +%%Y%%m%%d` 60'
ExecStartPost=/bin/sh -c 'echo $MAINPID > /run/atop.pid'
ExecStartPost=/usr/bin/find /var/log/atop -name "atop_*" -mtime +28 -exec rm {} \; -printf "Removed " -print

Debian #933067 atop terminates with buffer overflow

Hi,

please take a look at https://bugs.debian.org/cgi-bin/bugreport.cgi?bug=933067, where a user reports atop terminating with "*** buffer overflow detected ***: atop terminated" right after startup and attaches an strace (where one can see atop reading time zone data and /etc/localtime before terminating).

The strace also contains evidence of atop searching for /lib/terminfo/x/xterm-256color, not finding the file and not printing an error message about this. On my reference machine, after removing /lib/terminfo/x/xterm-256color, I get a clear "Error opening terminal" error message.

Greetings
Marc

Add option to disable sorting, or sort by device name rather than activity.

I don't see an option to prevent sorting completely in the man page. When reading columns on the far right it can be frustrating when the order of rows keeps changing because one drive has more activity than the other and it might keep swapping back and forth. So it would be nice to an option that sorts by device name perhaps and not activity to prevent things from "bouncing around".

atop rocks btw!

"ipc notavail" warning in version 2.4

I recently upgraded several installations of atop from version 2.3.0 to version 2.4.0. I noticed that the column with "#tlspu 0" at the top no longer shows guest percentages, but now shows the warning "ipc notavail". Is this something that is configurable in atop or is it a bug?

sysv init script "let" command and "#! /bin/sh"

We have issue with forementioned as standard shell don't have "let" command - bash and ksh do.
I don't know if using "#! /bin/bash" in init script is a good idea or getting rid of "let" is better.

using cleanstop() causes non-zero exit, but does not show an error message (because it clears the screen)

$ rpm -q atop
atop-2.3.0-10.fc28.x86_64

When atop hits a fatal error, it does not show an error message.

I happened to run atop after I had changed directory (cd) into a mounted USB stick. The "error" was that the USB connection was lost. Then atop died without printing any error (and returned exit status 53).

$ atop
$ echo $?
53

src/atop$ grep -r 'exit[ ]*[(]' .
...
various.c
577:		exit(13);
590:	exit(exitcode);
...
src/atop$ grep -r '53' .
...
photosyst.c
101:** Revision 1.16  2004/05/06 09:53:31  gerlof
107:** Revision 1.14  2003/07/08 13:53:21  gerlof
305:		cleanstop(53);
...

In the function photosyst():

	if ( getcwd(origdir, sizeof origdir) == NULL)
	{
		perror("save current dir");
		cleanstop(53);
	}

I see atop tries to print an error message. But then I expect cleanstop() restores the original screen. So it wipes out the error message :-).

What is with the body-less if statements?

I'd love to know the reasoning behind statements like:

if ( (chdir("../..") == -1 ) );
continue

Could you please explain what this is? I assume it's related to some compiler warnings?

netatop module needs updating for kernel >= 4.13.0

module build fails:

netatop-1.0/module/netatop.c: In function ‘init_module’:
netatop-1.0/module/netatop.c:1753:2: error: implicit declaration of function ‘nf_register_hook’ [-Werror=implicit-function-declaration]
  nf_register_hook(&hookin_ipv4);   // register hook
  ^~~~~~~~~~~~~~~~
netatop-1.0/module/netatop.c: In function ‘cleanup_module’:
netatop-1.0/module/netatop.c:1783:2: error: implicit declaration of function ‘nf_unregister_hook’ [-Werror=implicit-function-declaration]
  nf_unregister_hook(&hookin_ipv4);
  ^~~~~~~~~~~~~~~~~~
cc1: some warnings being treated as errors

cronjob to rotate file should be smarter

Hi,

this is me forwarding https://bugs.debian.org/cgi-bin/bugreport.cgi?bug=848708

When using "atop" on a machine that's not running 24/7, the cronjob at
00:00 is not run more often than not (depending on your usage pattern, of
course ;). This makes some use of "atop" harder than necessary; "atop -r y"
doesn't work, you'll need the right amount of "y"esterdays to find the
right file.

So, either

  1. the cronjob could be smarter, to check whether the date has
    changed (and then would need to run every minute?),
  2. or "atop" could be handling that (just open the file for every write,
    ie. by default every 600 seconds, with the correct path newly calculated),
  3. or things like suspend/resume could signal atop to start a new file.

I guess option 2 would be the easiest one to implement, and the most likely
to be correct.

Thank you for your consideration!

(thanks to Ph Marek for filing this)

process table format ugly when kernel.pid_max > 99999

This is me forwarding https://bugs.debian.org/cgi-bin/bugreport.cgi?bug=850189

I run atop on a system where kernel.pid_max = 4194303.
Since all PIDs can be longer than 5 characters this leads to
an ugly jagged look in the process table once this happens:

   PID    TID  THR  SYSCPU USRCPU  VGROW   RGROW  RDDSK  WRDSK  ST EXC S  CPUNR  CPU CMD         1/6
1818110      -    1   0.12s  0.06s     0K      0K     0K     0K  --   - S      2   2% apps.plugin
1023550      -   10   0.02s  0.05s     0K      0K     0K     0K  --   - S      3   1% netdata
3885756      -   31   0.03s  0.01s     0K      0K     0K     0K  --   - S      0   0% mysqld
1023566      -    5   0.00s  0.04s     0K      0K     0K     0K  --   - S      3   0% python
1934013      -    1   0.03s  0.01s     0K      0K     0K     0K  --   - R      2   0% atop  
3950051      -    1   0.03s  0.01s     0K      0K     0K     0K  --   - S      0   0% gkrellmd
1917616      -    1   0.00s  0.02s     0K      0K     0K     0K  --   - S      0   0% bash
966886      -    1   0.00s  0.01s     0K      0K     0K     0K  --   - S      2   0% tor
303558      -   11   0.00s  0.01s     0K      0K     0K     0K  --   - S      1   0% syncthing
    38      -    1   0.01s  0.00s     0K      0K     0K     0K  --   - S      3   0% ksmd
1281656      -    7   0.00s  0.00s     0K      0K     0K     0K  --   - S      2   0% named
1167743      -    1   0.00s  0.00s     0K      0K     0K     0K  --   - S      2   0% php-fpm7.0
587618      -    7   0.00s  0.00s     0K      0K     0K     0K  --   - S      1   0% fail2ban-serve

This of course is only a minor cosmetic bug.
(To be fair, this is quite common upon tools displaying
PIDs, glances for example has the same problem.)

Thanks to Sven Hartge

How to automatically start netatop in centos 7?

My system is centos 7.4 with atop 2.3.

When I start atop -n,got notice kernel module 'netatop' not active request ignored.
I already installed netatop, how to automatically start netatop in centos 7?

Thanks in advance!

Parseable PRG output

Hello,

the exit code field in parseable output can show -2147483648 as a value while the atop interactive output shows 0.

If I'm reading the source code correctly, in parseable output mode, the excode is printed as-is in function print_PRG (parseable.c) , while the interactive code use the procprt_EXC_e function (showprocs.c):

char *
procprt_EXC_e(struct tstat *curstat, int avgval, int nsecs)
{
        static char buf[4];


        sprintf(buf, "%3d",
                 curstat->gen.excode & 0xff ?
                          curstat->gen.excode & 0x7f :
                          (curstat->gen.excode>>8) & 0xff);
        return buf;
}

Maybe I'm missing something, but is there a reason not to "transform" the exit code in parseable output the same way ?

interval cannot be customized anymore

This is me forwarding https://bugs.debian.org/cgi-bin/bugreport.cgi?bug=861874

The user suggests making the INTERVAL in atop.daily configurable from a defaults file.

The idiom should be something along:
`
#!/bin/bash

CURDAY=date +%Y%m%d
LOGPATH=/var/log/atop
BINPATH=/usr/bin
PIDFILE=/run/atop.pid
INTERVAL=600 # interval 10 minutes

if [ -e "/etc/atop/defaults" ] ; then
. /etc/atop/defaults
fi

`

So that the local user can create a defaults file and have the settings made there honored without the need to modify the script itself.

Greetings
Marc

virtual network interfaces shown as 10mbit

problem

It seems that atop shows the vnet interfaces on a qemu+kvm host system as 10mbit, even though there is no actual physical link speed. When more than 10mbit is transported through the interface, the line shows up as red, but there is no actual problem.

desired output

I would prefer the device interface speed to be shown as "virt" or something similar, so no indication of speed is given where not actually present. Also the line colour should only turn red if the througput is equal to the speed of the physical interface connected to the bridge or to the limit imposed by the VM configuration (bandwidth limiters).

Segmentation fault

Atop seems to exit after a SIGSEGV when running for a while (ranges from tens of minutes to hours). I switch between s, d and n views regularly.

Versions:
Atop built from repo (fa4db43)
netatop 2.0 built from source tgz
Ubuntu kernel 4.18.0-15-generic

Stacktrace:

#0  _int_malloc (av=av@entry=0x7ffff71bfc40 <main_arena>, bytes=bytes@entry=0) at malloc.c:4028
#1  0x00007ffff6e6b0fc in __GI___libc_malloc (bytes=0) at malloc.c:3057
#2  0x000055555559087e in netatop_exitstore () at netatopif.c:350
#3  0x000055555555fe5c in engine () at atop.c:945
#4  0x000055555555f8e6 in main (argc=1, argv=0x7fffffffebb8) at atop.c:704

Filtering by user if not available on the local machine

Hello,

I don't seem to able to filter (U) by user regex if this user is not available on the machine I'm running atop -r. I'm aggregating atop archive in a central repository and remote user are not always available (or have been simply removed) on the host I'm replaying the archive.

I was wondering why 'U' filtering was not working on a machine connected to an LDAP server with
all users accessible. It's because I'm using SSSD without enumeration enabled (getent passwd returns only /etc/passwd users but getent password my_ldap_user returns an entry).

One possibility would be to enable enumeration, but it makes me nervous with tens of thousands of entries. Another one would be to offer an exact user match option instead of a regex.

If a user vanishes, or an UID is reused by another user, or replay an atop log on a different machine with a different set of users, atop -r will show me an "incorrect" login for a given timeframe.

If atop could also store the resolved uid at the capture time and use it to filter on login name afterwards, I guess it would be OK. Easier say than done, but are you OK with what I said with the problem and the need to have the resolved uid as a new field ?

Jean-Baptiste

atop on aws: "ena: Feature 27 isn't supported"

Using atop in recent aws instances that use ena (t3, c5, m5, probably others) makes the dmesg full of warnings ena: Feature 27 isn't supported every 10 min

From AWS documentation, ena network driver do not support polling nor ethtool requests. Atop is probably query the network driver for their usage or speed and make the ena drive issue the warning.
To supress the warning in the driver, it requires editing the code and recompile, not very friendly, so lets try to make atop more ena friendly.

I can see that atop on those machines do not report usage %, next to the name, so i'm suspecting it is the current network speed query that is failing.

So please either detect that the driver is ena and disable that query, or add a option to disable this driver request, so we can still use atop but keeping dmesg clean.

Add delay accounting

Hello,

is there any plan to add delay accounting in atop ?

From https://github.com/torvalds/linux/blob/master/Documentation/accounting/delay-accounting.txt:

The per-task delay accounting functionality measures
the delays experienced by a task while

a) waiting for a CPU (while being runnable)
b) completion of synchronous block I/O initiated by the task
c) swapping in pages
d) memory reclaim

and makes these statistics available to userspace through
the taskstats interface.

Code example from the kernel: https://github.com/torvalds/linux/blob/master/tools/accounting/getdelays.c
(recent) Implementation in htop: hishamhm/htop#665

Nice blog post about the htop implementation: https://andrestc.com/post/linux-delay-accounting/

Hide "SWP" row when swap is disabled.

When a swap partition doesn't exist, atop shows a "SWP" row with 0.0M total and 0.0M free, and highlights it in red, I'm assuming because there is 0.0M free. If swap total is 0.0M, perhaps just hide this row completely?

Self rotating logs

Instead of maintaining shell scripts (etc) for dealing with log rotation, what do you think about specifying a size-boundary and a maximum retention time-span in the Atop CLI parameters, and then just having atop deal with log rotation directly?

I'm happy to write the code, but I would rather do it knowing that there is some chance that you would like to upstream it since I'd rather not fork atop for myself.

NVMe SSDs are not shown.

Ever since upgrading to a NVMe SSDs, I can't get it to show in atop anymore. It shows all my other disks, and raid/LVM devices, but NVMe SSD isn't shown.

atop rocks btw!

init script broken due to bash vs sh syntax

ran into this on ubuntu trusty but really more of a portable shell gotcha.

/bin/sh on linux is just a special case of /bin/bash as you know, but only enables a subset of bash functionality when called as /bin/sh.

in atop.init your shebang uses /bin/sh but uses a bashism on line 50 (let CNT+=1). i've tested this two ways, whichever you prefer to fix it:

  1. change the let line to be "CNT=expr $CNT + 1"
  2. change atop.init to use /bin/bash (probably better for consistency, since you use /bin/bash elsewhere?)

without one of these, you will get log spam about that syntax on each run/restart.

hth

atop stops with buffer overflow

Hi,
i have a linux system which stops responding for several hours. No ssh-login possible, no local login. Just responding to ping.
I have on all of my linux systems atop running which logs each second. So i can investigate afterwards what was going on on that system. Unfortunately, when i jump with 'b' some seconds before system didn't respond anymore, and then approach with 't', i get a buffer overflow.
System is SLES 10 SP4, atop is atop-1.27.3-2.1. Is it possible that the logfile is corrupt and this causes the buffer overflow ? Is there a way to "fix" that file ?
I tried to open the file with more recent versions of atop but i got:
ha-idg-1:~ # atop -r atop_20190917
raw file atop_20190917 has incompatible format
(created by version 1.27 - current version 2.2)
trying to activate atop-1.27....
activation of atop-1.27 failed!

Does each version have its own format ? Which version could be helpful ?
Or is there a way to convert the logfile into a more recent format ?
Thanks.

Bernd

atopsar stalled due to corrupt atop file

We have a custom script that calls atopsar to collect system metrics.
However, for certain days, the call to atopsar stalls (the process keeps on running and no response is obtained) and does not continue. Killing these atopsar commands result in <defunct> processes.
Upon further inspection, we found out that this is being caused due to corrupt atop file. We could not pinpoint or replicate the condition in which the file is corrupted, but I have attached the corrupt file here.
The commands running atopsar are:

  1. atopsar -xG -b date --date=\"-19 minutes\" +%H:%M | tail -2
  2. atopsar -xD -b date --date=\"-19 minutes\" +%H:%M | tail -2
  3. atopsar -xO -b date --date=\"-19 minutes\" +%H:%M | tail -2

atop_20190509.zip

A feature request -- '-l 0:99:99', or custom profiles

Hi there -- thank you for a great program, it is an absolute joy to use!

Do you think it is possible to have a several atop aliases targeting disk activity, cpu etc, and save even more keystrokes? This would also make scripting in batch mode a bit easier.

In particular, when debugging disk-related issues, it is nice to have limitedlines() setting maxcpulines = 0, but keeping maxdsklines big.

If there were syntax like atop -l 0:99:99:.. to set these limits, or an option to have a custom rc file, one could make a few different atop aliases like atopd=atop -l 0:99:99:... or atopd=atop --rcfile=atoprc.disk ; I can see a quick and dirty way to have a custom rc file using an environment variable, but I'm not sure if that would go with the general style:

====
$ diff -u atop.c.2017-10-07 atop.c 
--- atop.c.2017-10-07	2017-10-07 22:25:26.079844329 +1100
+++ atop.c	2017-10-07 23:21:27.239578628 +1100
@@ -466,14 +466,32 @@
        */
        readrc("/etc/atoprc", 1);
 
-	if ( (p = getenv("HOME")) )
+        /* for local atoprc, p == NULL will mean "file not found" */
+        p = NULL ; /* NULL : no local rcfile */
+
+        /* try $ATOPRC first */
+	if ( (p = getenv("ATOPRC")) )
        {
-		char path[1024];
+                /* if we can read it -- let's read it */
+                if( access( p, R_OK ) != -1 ) {
+                        readrc(p, 0);
+                } else {
+                    /* if we can't -- let's try HOME next */
+                    p = NULL ;
+                }
+	}
+        
+        /* go for $HOME/.atoprc next */
+        if ( ( NULL == p ) ) {
+                if ( (p = getenv("HOME")) )
+                {
+                        char path[1024];
 
-		snprintf(path, sizeof path, "%s/.atoprc", p);
+                        snprintf(path, sizeof path, "%s/.atoprc", p);
 
-		readrc(path, 0);
-	}
+                        readrc(path, 0);
+                }
+        }
 
        /*
        ** check if we are supposed to behave as 'atopsar'
====

Do not change owner to root

For users wanting to build Atop themselves, or for build tests with unprivileged users, explicitly calling chown root … is problematic.

atop/Makefile

Lines 146 to 159 in 3e0b68c

cp atop $(DESTDIR)$(BINPATH)/atop
chown root $(DESTDIR)$(BINPATH)/atop
chmod 04711 $(DESTDIR)$(BINPATH)/atop
ln -sf atop $(DESTDIR)$(BINPATH)/atopsar
cp atopacctd $(DESTDIR)$(SBINPATH)/atopacctd
chown root $(DESTDIR)$(SBINPATH)/atopacctd
chmod 0700 $(DESTDIR)$(SBINPATH)/atopacctd
cp atopgpud $(DESTDIR)$(SBINPATH)/atopgpud
chown root $(DESTDIR)$(SBINPATH)/atopgpud
chmod 0700 $(DESTDIR)$(SBINPATH)/atopgpud
cp atop $(DESTDIR)$(BINPATH)/atop-$(VERS)
ln -sf atop-$(VERS) $(DESTDIR)$(BINPATH)/atopsar-$(VERS)
cp atopconvert $(DESTDIR)$(BINPATH)/atopconvert
chown root $(DESTDIR)$(BINPATH)/atopconvert

I think, it’s common practice to keep the owner of binaries the same as the build user.

atop stops rotating logs

Hello,

I have encountered this on all my CentOS 7 servers over time, atop just stops rotating logs, these are the latest ones:

-rw-r--r-- 1 root root 2305250 May 1 23:50 atop_20180501
-rw-r--r-- 1 root root 2655114 May 2 20:00 atop_20180502
-rw------- 1 root root 66 May 2 20:23 atop.log-20180503
-rw------- 1 root root 0 Aug 1 13:30 atop.log
-rw-r--r-- 1 root root 344698 Aug 1 13:30 atop_20180801

Weird is the name of the atop.log-20180503, I don't know why this one has a .log in its name while others doesn't have it and seems like the last log file had name atop.log-20180503 but it should be atop_20180503.

I have found this link so it is present on Debian Strech also https://blog.pyshonk.in/2016/11/11/atop-log-does-not-rotate-in-debian-stretch/

but CentOS 7 doesn't use invoke-rc.

Should the cron have "restart" instead of "try-restart? Like this:

0 0 * * * root /bin/systemctl restart atop.service > /dev/null 2>&1 || :

instead of this:

0 0 * * * root /bin/systemctl try-restart atop.service > /dev/null 2>&1 || :

fails to build with gcc-8.2.1

[filiperosset@raw atop]$ gcc -v
Using built-in specs.
COLLECT_GCC=/usr/bin/gcc
COLLECT_LTO_WRAPPER=/usr/libexec/gcc/x86_64-redhat-linux/8/lto-wrapper
OFFLOAD_TARGET_NAMES=nvptx-none
OFFLOAD_TARGET_DEFAULT=1
Target: x86_64-redhat-linux
Configured with: ../configure --enable-bootstrap --enable-languages=c,c++,fortran,objc,obj-c++,ada,go,lto --prefix=/usr --mandir=/usr/share/man --infodir=/usr/share/info --with-bugurl=http://bugzilla.redhat.com/bugzilla --enable-shared --enable-threads=posix --enable-checking=release --enable-multilib --with-system-zlib --enable-__cxa_atexit --disable-libunwind-exceptions --enable-gnu-unique-object --enable-linker-build-id --with-gcc-major-version-only --with-linker-hash-style=gnu --enable-plugin --enable-initfini-array --with-isl --enable-libmpx --enable-offload-targets=nvptx-none --without-cuda-driver --enable-gnu-indirect-function --enable-cet --with-tune=generic --with-arch_32=i686 --build=x86_64-redhat-linux
Thread model: posix
gcc version 8.2.1 20180905 (Red Hat 8.2.1-3) (GCC)
[filiperosset@raw atop]$ make -Wall
cc -O2 -I. -Wall -c -o atop.o atop.c
atop.c:274:19: warning: ‘rcsid’ defined but not used [-Wunused-const-variable=]
static const char rcsid[] = "$Id: atop.c,v 1.49 2010/10/23 14:01:00 gerlof Exp $";
^~~~~
cc -O2 -I. -Wall -c -o version.o version.c
cc -O2 -I. -Wall -c -o various.o various.c
various.c:101:19: warning: ‘rcsid’ defined but not used [-Wunused-const-variable=]
static const char rcsid[] = "$Id: various.c,v 1.21 2010/11/12 06:16:16 gerlof Exp $";
^~~~~
cc -O2 -I. -Wall -c -o deviate.o deviate.c
deviate.c:171:19: warning: ‘rcsid’ defined but not used [-Wunused-const-variable=]
static const char rcsid[] = "$Id: deviate.c,v 1.45 2010/10/23 14:02:03 gerlof Exp $";
^~~~~
cc -O2 -I. -Wall -c -o procdbase.o procdbase.c
procdbase.c:61:19: warning: ‘rcsid’ defined but not used [-Wunused-const-variable=]
static const char rcsid[] = "$Id: procdbase.c,v 1.8 2010/04/23 12:19:35 gerlof Exp $";
^~~~~
cc -O2 -I. -Wall -c -o acctproc.o acctproc.c
acctproc.c:116:19: warning: ‘rcsid’ defined but not used [-Wunused-const-variable=]
static const char rcsid[] = "$Id: acctproc.c,v 1.28 2010/04/23 12:20:19 gerlof Exp $";
^~~~~
cc -O2 -I. -Wall -c -o photoproc.o photoproc.c
photoproc.c:139:19: warning: ‘rcsid’ defined but not used [-Wunused-const-variable=]
static const char rcsid[] = "$Id: photoproc.c,v 1.33 2010/04/23 12:19:35 gerlof Exp $";
^~~~~
cc -O2 -I. -Wall -c -o photosyst.o photosyst.c
photosyst.c: In function ‘lvmmapname’:
photosyst.c:1482:19: error: called object ‘major’ is not a function or function pointer
dmp->major = major(statbuf.st_rdev);
^~~~~
photosyst.c:1437:25: note: declared here
lvmmapname(unsigned int major, unsigned int minor,
~~~~~~~~~~~~~^~~~~
photosyst.c:1483:19: error: called object ‘minor’ is not a function or function pointer
dmp->minor = minor(statbuf.st_rdev);
^~~~~
photosyst.c:1437:45: note: declared here
lvmmapname(unsigned int major, unsigned int minor,
~~~~~~~~~~~~~^~~~~
At top level:
photosyst.c:152:19: warning: ‘rcsid’ defined but not used [-Wunused-const-variable=]
static const char rcsid[] = "$Id: photosyst.c,v 1.38 2010/11/19 07:40:40 gerlof Exp $";
^~~~~
make: *** [: photosyst.o] Error 1
[filiperosset@raw atop]$

atop writes to corrupted file after system hang

After a system hang/crash/whatever, atop just continues writing to file for the current day.
But atop -r bombs out at the point-in-time where the crash happens when browsing with t/T or jumping with b.

So, either atop needs to scan current file on startup and if needed fix it up so that appending more to it is actually readable later, or for instance use magic record headers so that a corrupted file doesn't hinder reading.

Please document SIGUSR2 behavior

Hi,

comments in atop.daily and the atop.c file suggest that SIGUSR2 can be sent to the atop daemon to have it take a final sample and exit.

That should be documented in the atop man page.

Greetings
Marc

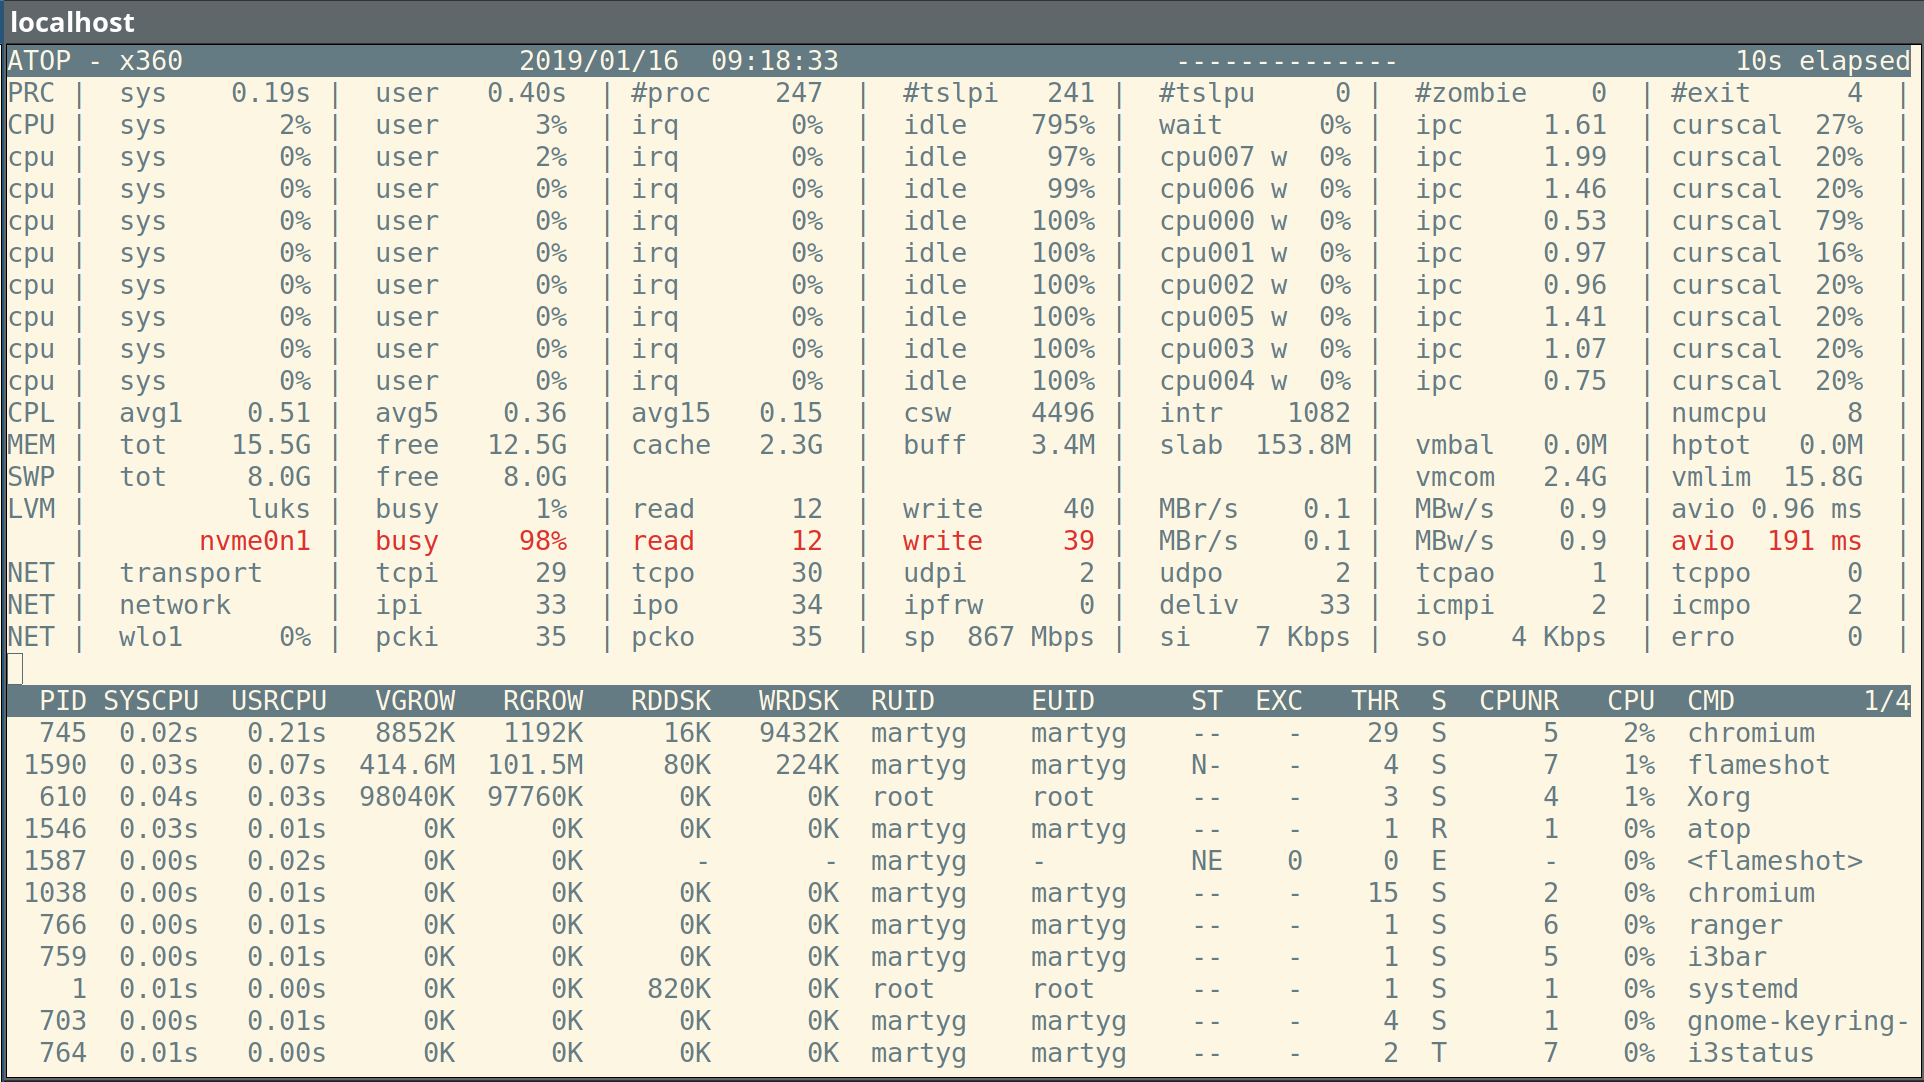
Incorrect Busy/AVIO metrics -- NVME device

Updated to 2.4.0-1 on Arch Linux. This is the first time I see this very useful tool expose nvme devices.

The numbers I am getting from atop don't look right. (Busy and avio metrics on idle system)
atop I can't see how my machine would be so badly misconfigured, and the system does not look/feel to have IO bottlenecks from the user perspective.

I see the same behavior on kernels 4.19 and 4.20. I am attaching an iostat sample for reference.
iostat.txt

Not sure where to go with this. atop bug? kernel bug? Arch packaging problem? Broken machine?
Could you point me in the right direction, please? Thanks!

cannot read raw logs from pipe

Atop sometimes fails when reading from a raw file which is a pipe - for example something like atop -r myfifo -P cpu along with cat atop_log > myfifo will sometimes fail.

In atopconvert.c many of the reads do something like this:

    if ( read(rawfd, compbuf, complen) < complen)
    {
        free(compbuf);
        fprintf(stderr,
            "Failed to read %d bytes for system\n", complen);
        return 0;
    }

In pipes/fifos it is expected that read may read less than complen bytes even if more bytes might be available later

Recommend Projects

  • React photo React

    A declarative, efficient, and flexible JavaScript library for building user interfaces.

  • Vue.js photo Vue.js

    🖖 Vue.js is a progressive, incrementally-adoptable JavaScript framework for building UI on the web.

  • Typescript photo Typescript

    TypeScript is a superset of JavaScript that compiles to clean JavaScript output.

  • TensorFlow photo TensorFlow

    An Open Source Machine Learning Framework for Everyone

  • Django photo Django

    The Web framework for perfectionists with deadlines.

  • D3 photo D3

    Bring data to life with SVG, Canvas and HTML. 📊📈🎉

Recommend Topics

  • javascript

    JavaScript (JS) is a lightweight interpreted programming language with first-class functions.

  • web

    Some thing interesting about web. New door for the world.

  • server

    A server is a program made to process requests and deliver data to clients.

  • Machine learning

    Machine learning is a way of modeling and interpreting data that allows a piece of software to respond intelligently.

  • Game

    Some thing interesting about game, make everyone happy.

Recommend Org

  • Facebook photo Facebook

    We are working to build community through open source technology. NB: members must have two-factor auth.

  • Microsoft photo Microsoft

    Open source projects and samples from Microsoft.

  • Google photo Google

    Google ❤️ Open Source for everyone.

  • D3 photo D3

    Data-Driven Documents codes.