Giter VIP home page Giter VIP logo

graphical-debugging's Introduction

Graphical Debugging

Extension for Visual Studio

VS Marketplace Installs Rating License Donate

This extension allows to display graphical representation of C++ and C# variables during debugging.

Graphical Debugging

It supports Boost.Geometry and Boost.Polygon models, Boost.Variant, STL/Boost containers of values and points, C-style arrays, C# arrays, List and LinkedList as well as user-defined geometry types. The extension has the following components:

  • Debugger visualizers for Boost.Array, Boost.CircularBuffer, Boost.Container, Boost.Geometry, Boost.MPL, Boost.Polygon, Boost.Tuple and Boost.Variant
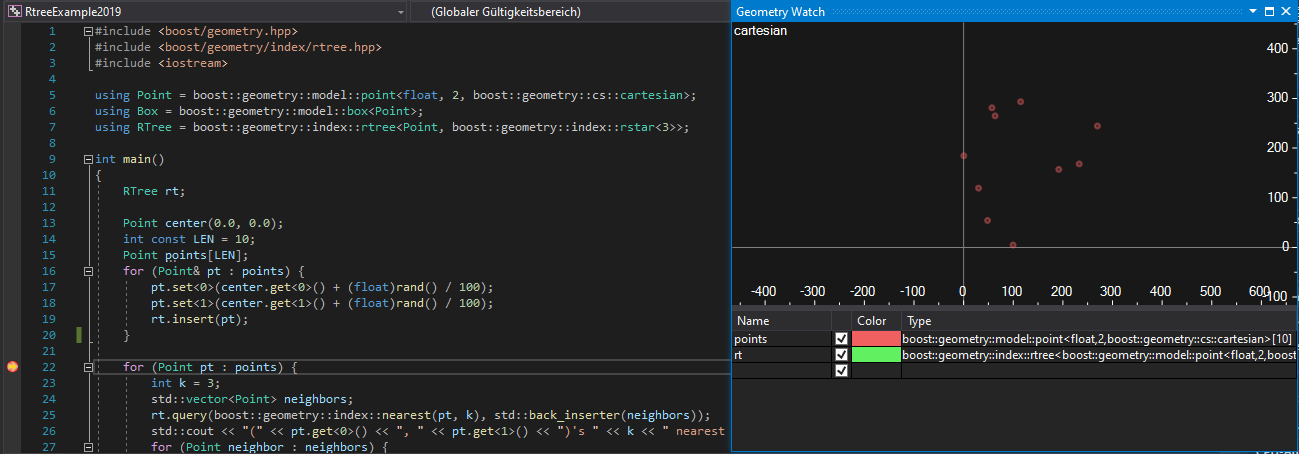
  • Geometry Watch tool window displaying geometries in a common coordinate system, e.g. Boost.Geometry, Boost.Polygon polygons, etc.
  • Graphical Watch tool window displaying graphical representation of variables, e.g. Boost.Geometry models, Boost.Gil images, vectors of values, etc.
  • Plot Watch tool window displaying plot representation of variables, e.g. vector of doubles, array of pairs, etc.

Feel free to report bugs, propose features and create pull requests. Any help is appreciated.

Download

You can download this extension from Visual Studio Marketplace or GitHub.

Supported Versions

Visual Studio 2013, 2015, 2017 and 2019 - version 0.34

Visual Studio 2022 - version 0.50 and newer

Instructions

  1. place a breakpoint somewhere in the code
  2. start debugging
  3. after a breakpoint hit enable the tool window from the menu
    • View->Other Windows->Geometry Watch
    • View->Other Windows->Graphical Watch
    • View->Other Windows->Plot Watch
  4. write the name of a variable in an edit box on the list

Debugger visualizers

Watch

Supported:

  • Boost.Array: array
  • Boost.CircularBuffer: circular_buffer
  • Boost.Container: vector, static_vector
  • Boost.Geometry:
    • de9im: mask, matrix, static_mask
    • index: rtree
    • model: point, point_xy, box, segment, referring_segment, linestring, polygon, multi_point, multi_linestring, multi_polygon, nsphere
  • Boost.MPL: int_, size_t, integral_c, vector, vector_c
  • Boost.Polygon: point_data, interval_data, segment_data, rectangle_data, polygon_data, polygon_with_holes_data
  • Boost.Tuple: tuple
  • Boost.Variant: variant

Geometry Watch

Watch window displaying graphical representation of variables in a single image. This allows to compare the variables easily. Variables can be of any supported type (see below) representing a geometrical object, e.g. point, polygon, ray, container of complex numbers, etc.

Geometry Watch

Geometries in spherical_equatorial and geographic coordinate systems are displayed in a way allowing to see what coordinates were used to define a geometry. Note that various libraries may require coordinates in a certain range. This extension tries to display any coordinates as good as possible.

Segments may be densified in order to reflect the curvature of the globe. This behavior is enabled by default but can be disabled in Tools->Options->Graphical Debugging->Geometry Watch.

Geometry Watch Spherical

where geometries are Boost.Geometry types:

polygon_sd_t poly_sd{{{-100, 0},{100, 0},{100, 50},{-100, 50},{-100, 0}},
                     {{-150, 10},{-150, 20},{150, 20},{150, 10},{-150, 10}}};
multi_polygon_sd_t mpoly_sd{{{{0, 0},{90, 10},{170, 20},{-170, 30},{-150, 60}},
                             {{0, 10},{-15, 20},{-50, 50},{0, 60}}}};
multi_point_sd_t mpt_sd{{0, 0},{90, 10},{170, 20},{-170, 30}};

Graphical Watch

Watch window displaying graphical representations of variables in a list. Each variable is placed and visualized in a separate row. Variables can be of any supported type (see below) incl. images (see below).

Graphical Watch

Geometries in spherical_equatorial and geographic coordinate systems are displayed in a convenient, compact way.

Segments may be densified in order to reflect the curvature of the globe. This behavior is enabled by default but can be disabled in Tools->Options->Graphical Debugging->Graphical Watch.

Graphical Watch Spherical

where

polygon_sd_t poly_sd{{{-100, 0},{100, 0},{100, 50},{-100, 50},{-100, 0}},
                     {{-150, 10},{-150, 20},{150, 20},{150, 10},{-150, 10}}};
multi_polygon_sd_t mpoly_sd{{{{0, 0},{90, 10},{170, 20},{-170, 30},{-150, 60}},
                             {{0, 10},{-15, 20},{-50, 50},{0, 60}}}};
multi_point_sd_t mpt_sd{{0, 0},{90, 10},{170, 20},{-170, 30}};

Plot Watch

Watch window displaying plot representation of variables in a single image. Type of plot can be set in Options. Variables can be of any supported type (see below) representing a container of values or points incl. complex and pair.

Plot Watch

Supported types

  • Containers of values convertible to double, points and other geometries
    • C-style array
    • Pointer to elements with size specifier e.g.: ptr,5
    • Sequence of containers of point coordinates e.g.: vec_x;vec_y
    • STL: array, vector, deque, list, set
    • Boost.Array: array
    • Boost.CircularBuffer: circular_buffer
    • Boost.Container: vector, static_vector
    • C#: array, List, LinkedList, IList, IEnumerable
    • VB: array, List (containers of values only)
    • user-defined containers (see below)
  • 2D cartesian geometries
    • Boost.Geometry: point, point_xy, box, segment, referring_segment, linestring, polygon, multi_point, multi_linestring, multi_polygon, nsphere
    • Boost.Polygon: point_data, segment_data, rectangle_data, polygon_data, polygon_with_holes_data
    • STL: pair
    • user-defined geometry types (see below)
  • Non-cartesian geometries (spherical_equatorial and geographic)
    • Boost.Geometry: point, box, segment, referring_segment, linestring, polygon, multi_point, multi_linestring, multi_polygon, nsphere
  • Spatial indexes
    • Boost.Geometry: rtree
  • Complex numbers
    • STL: complex
  • Values
    • STL: chrono::duration (incl. aliases, e.g. chrono::milliseconds, chrono::seconds, etc.)
  • Images
    • Boost.Gil: image (incl. aliases, e.g. rgb8_image_t, abgr16_image_t, cmyk32_image_t, rgb64f_planar_image_t, etc.)
  • Variants of geometries
    • Boost.Variant: variant

User-defined types

The extension offers support for the following user-defined geometries for both C++ and C# types:

  • Box (aka rectangle)
  • Line
  • Linestring
  • MultiLinestring
  • MultiPoint
  • MultiPolygon
  • Point
  • Polygon (polygon with holes)
  • Ray
  • Ring (polygon without holes)
  • Segment

as well as user defined containers for C++:

  • Array
  • LinkedList

They can be defined in XML file similar to *.natvis file. Path to this file can be set in options under Tools->Options->Graphical Debugging->General. An example XML file defining C++ types MyPoint, MyRing and MyPolygon in global namespace might look like this:

<?xml version="1.0" encoding="utf-8"?>
<GraphicalDebugging>

  <Point Id="MyPoint">
    <Coordinates>
      <X>x</X>
      <Y>y</Y>
    </Coordinates>
  </Point>

  <Ring Id="MyRing">
    <Points>
      <Array>
        <Pointer>points_ptr</Pointer>
        <Size>points_size</Size>
      </Array>
    </Points>
  </Ring>

  <Polygon Id="MyPolygon">
    <ExteriorRing>
      <Name>outer</Name>
    </ExteriorRing>
    <InteriorRings>
      <Container>
        <Name>inners</Name>
      </Container>
    </InteriorRings>
  </Polygon>

</GraphicalDebugging>

Current limitations:

  • only one entry per type
  • in C# elements stored in containers has to be ValueTypes, Points and Boxes has to be structs

See more examples at GitHub.

Direct memory access

The extension attempts to obtain data through direct memory access if possible. From this feature benefit all supported containers of fundamental numeric types and geometries using such coordinate types. E.g.:

  • int arr[5]
  • std::array<float, 5>
  • std::vector<double>
  • std::deque<std::pair<float> >
  • std::list<std::complex<double> >
  • boost::container::vector<int>
  • boost::geometry::model::linestring< boost::geometry::model::point<double, 2, boost::geometry::cs::cartesian> >
  • boost::polygon::polygon_data<int>
  • double[] (C#)
  • etc.

This behavior is enabled by default but can be disabled in options under Tools->Options->Graphical Debugging->General

Zooming/cropping

Geometry Watch and Plot Watch has zooming/cropping feature. Mouse wheel can be used to zoom in/out as well.

Geometry Watch Zoom

Geometry Watch Zoomed

Options

Options for each Watch can be found under Tools->Options->Graphical Debugging

Plot Watch Various

graphical-debugging's People

Contributors

awulkiew avatar mloskot avatar

Stargazers

 avatar  avatar  avatar  avatar  avatar  avatar  avatar  avatar  avatar  avatar  avatar  avatar  avatar  avatar  avatar  avatar  avatar  avatar  avatar  avatar  avatar  avatar  avatar  avatar  avatar  avatar  avatar  avatar  avatar  avatar  avatar  avatar  avatar  avatar  avatar  avatar  avatar  avatar  avatar  avatar  avatar  avatar  avatar  avatar  avatar  avatar  avatar  avatar  avatar  avatar  avatar  avatar  avatar  avatar  avatar  avatar  avatar  avatar  avatar  avatar  avatar  avatar  avatar  avatar  avatar  avatar  avatar  avatar  avatar  avatar  avatar  avatar  avatar  avatar  avatar  avatar  avatar  avatar  avatar  avatar  avatar  avatar  avatar  avatar  avatar  avatar  avatar  avatar  avatar  avatar  avatar  avatar  avatar  avatar  avatar  avatar  avatar  avatar  avatar  avatar

Watchers

 avatar  avatar  avatar  avatar  avatar  avatar  avatar  avatar  avatar  avatar  avatar  avatar  avatar  avatar  avatar  avatar  avatar

graphical-debugging's Issues

Add labels for visible points

In the Geometry Watch there are no labels giving any indication as to which point is which (from a vector of points).

Please add either labels (that appear or disappear according to the zoom level and the data they would otherwise obstruct) or add tooltips when hovering over a point.

Not work user rect type

In xml:

  <Box Id="Rect" CoordinateSystem="Cartesian" Unit="None">
    <Coordinates>
      <MinX>left</MinX> <!-- or <Left> or <MaxX> or <Right> -->
      <MinY>top</MinY> <!-- or <Bottom> or <MaxY> or <Top> -->
      <Width>width</Width>
      <Height>height</Height>
    </Coordinates>
  </Box>

code:

struct Rect
{
public:
	float left, top, width, height;
};

I tried different labels in xml for coordinates as in example, but not successfully.

Support for 3D

  • 3D cartesian
  • spherical and geographic on 3D sphere/spheroid

User-defined type improvement

Add ability to define a user-defined container from another known container or user-defined geometry from another known geometry. Consider a wrapper class containing a container or geometry member or a class derived from other known type.

Plot Watch does not draw the graphs if 'Hexadecimal Display' is enabled

Just noticed that Plot Watch stopped working, even though it used to work just fine a couple of days back. I tried many things to get it working again, in the end, what did the trick, was disabling the 'Hexadecimal Display' option in the right click menu of VS's Watch window, and resetting or editing the watched values in Plot Watch window.

Provide information on when user defined types are reloaded

In the documentation I couldn't find any information on when the *.xml files with user-defined types are actually loaded. If I didn't oversee this it would be nice to have this documented somewhere, possibly even printed out to debug output in VS. If this is unknown it's hard to know when a change will apply once the *.xml file was changed. Does it apply immediately? After restarting the debug session? After restarting VS? After rebooting the OS?

How to access to derived from abstract class ?

Example:

class SomePoint
{
	double x, y;
}

class Shape
{
private:
	virtual void dosome();
	SomePoint points[10];
}

class Circle : public Shape
{

}

I'm tried to integrate SFML (https://github.com/SFML/SFML) but not work
with xml code

  <Point Id="sf::Vertex">
    <Coordinates>
      <X>position.x</X>
      <Y>position.y</Y>
    </Coordinates>
  </Point>

  <Ring Id="sf::Shape">
    <Points>
      <Array>
        <Pointer>m_vertices.m_vertices._Mypair._Myval2._Myfirst</Pointer>
        <Size>m_vertices.m_vertices._Mypair._Myval2._Mylast - m_vertices.m_vertices._Mypair._Myval2._Myfirst</Size>
      </Array>
    </Points>
  </Ring>

Advanced container plotting

  • plot a subset of elements
    • plot an array with a given interval, for example, plot a vector data with interval 2 by plotting v[0], v[2], v[4], and so on
    • start from some position
    • end at some position
  • sizes and offsets defined by variables, not only constants, variable size specifier
  • defining points in one container with interleaved coordinates

Simplify debugging custom style files

In order to support the creation of user defined type it would be helpful to get some debug output whenever loading or applying a custom style file was loaded. Otherwise it is hard to know why the extension doesn't behave as expected. Maybe there is already such a debugging possibility but I couldn't find any so far.

Possible implementation:

  1. User sets some CustomFileTypes.xml in the settings.
  2. User starts debugging session
  3. In the output window at "Debug" an error message appears, if applicable e.g.:
    • Graphical Debugging: Error loading type "NameSpace::Of::SomeC$lass"; invalid characters
    • Graphical Debugging: Didn't load type "NameSpace::Of::AnotherClass"; already defined

Wait popup non-blockable

The wait popup whenever there is a large geometry to be displayed is very annoying; would be very helpful a way to disable it or at least make that popup window not blockable and let the thread continue to process while it is open and waiting an input from the user; in case that happens first it will just auto close it too

Is development supported using VS 2017 or 2019?

The Build section in current README says:

You need Microsoft Visual Studio 2015 Update 3, .NET Framework 4.5.2 and Visual Studio 2015 SDK.

Does it mean a minimal VS version or exact VS version required?

Is it possible to develop and build the extension using VS 2017 or 2019?


Sorry, but I didn't find a better place to ask questions about the extension development.

Visual Studio Code Support?

Hi Adam, this project looks very interesting! Have you looked into what it would take to make this work inside Visual Studio Code? Do you know if anyone is working on something similar for that IDE?

Add support for more primitives

  • Geodesic (1, 2) (G, S)
  • InfiniteLine (1, 2, 3, 4) (C)
  • Ray (1, 2, 3) (C)
  • RhumbLine (2) (G, S)
  • Segment (1) (C, G, S)
  • Vector?
  • VectorField?

(1) may be defined by 2 points
(2) may be defined by point and angle
(3) may be defined by point and direction
(4) may be defined by line equation

(C) cartesian
(G) geographic
(S) spherical equatorial

Geodesic could also be defined as InfiniteLine in G and S.

Plotting custom types and structs as values

I have a type that looks something like this:

```c++
class CAttenEntry {
    float   m_atten = -1.0f;
public:
    CAttenEntry() : m_atten( -1 ) {}
    float    atten() const         { return m_atten >= 0 ? m_atten : 0.5f; }
    bool    calculated() const  { return m_atten >= 0; }
    operator double() const   {  return atten(); }
};

I added the operator double() function to try to get the value to plot in this extension, but I can't get it to work so far. The values are in a C-style array, but I have tried copying the values into a vector and that still doesn't work. As of now I am copying the atten() values to a vector every time the array changes and that "works", but is very slow.

Using C++ and Visual Studio 2019

reference type not supported

I have a user-defined point type "Point" and it's displayed fine. But a reference to Point is not displayed. E.g.
Point p(100,100); // p is displayed OK
Point& pr=p; // pr is not shown
Anyone know any solution? Thanks!

Several plot watch windows

Hi Adam,
Is it possible to open several plot watch windows or split the current plot watch into several horizontal sections? This would be a very nice feature if it's not possible today.

Zooming?

Are there any plans to add zooming?

Add solution specific style files

It would be nice to not only have the possibility to add one global style file in the settings per language but also to have a solution specific style file (maybe at a fixed location and with a fixed name, e.g. "GraphicalDebuggingCpp.xml" in the same directory as the *.sln file to make things simple).
It that is possible the style file can be checked into source control with all connected advantages.

Representation of matrices/vectors as heatmap

It would be very helpful if you have for example a std::vector of length 10000, you could specify that this is to be interpreted as a 100x100 matrix and you could then display the entries as a heatmap.

Port to VS Code

How hard would it be to port this plugin for VS Code?
Both MSVS and VS Code use the VSIX format and both use the Debug Adapter Protocol Interface.

Install problem

Hi,

I have some problem with adding the extension to VS Code.

  • I couldn't find the package in VS Code market place (Ctrl+Shift+X in VS Code, then search)
  • I tried to download .vsix file from the website (marketplace.visualstudio.com) and install, but VS Code give error message:
    extension/package.json not found inside zip.

IList isn't supported in .Net

Hi,
It's a useful tool, but I didn't understand at first why I didn't have any plot.

It seems that IList isn't supported, even if the object is really an standard List. In the screenshot below, baseline don't display anything, but temp works fine (temp = baseline.ToList())

image

VB.Net support?

Is there a workaround to get this extension working with VB.Net data?
Plot watch detects the correct array type from the given variable name but doesn't plot it.

Histogram support

If not hard to implement, it would be really useful to be able to display the histogram of an array. For ex for a selected vector, the user selects histogram and inputs the range and bin size. Or the user selects to vectors, one defining the data and the other the bins.

Great tool, thank you!

How display derived class

Hi,
I have this code:

class GDBRLinea : public GDBR { ... }

GDBR *pRecPs( new GDBRLinea(p0,p1) );

debug work (GDBRLinea)pRecPs
debug not work *pRecPs

how can I do?

Faster adding a watches

Hi, I have another Idea :)
It would be quite handy if one could add entries to one of the graphical wathces directly by context menu from the locals/autos/watches window selection. Or even directly from the source code context menu (like you can choose "Add Watch/Add Quick Watch...: there). I am not sure if this is technically possible but to me it would be a huge workflow ease.

Not able to view System.Drawing.Point in C#

What am I doing wrong when System.Drawing.Points don't show up in the view?
I've added the xml for User-defined types, but it doesn't display anything.

In the plot view options, I've set everything to true.

Sorry if this should be obvious...

image

Axes in logarithmic scale

  • y-axis of plot watch
  • x-axis could be useful too for containers of points
  • in case of Geometry Watch it's an open question

Zoom display with free-selection area

Area selection for plot zoom in Geometry Watch and Plot Watch is currently constrained to the window's aspect ratio.

Would it be possible to add an option for free-area-selection (unconstrained) when doing zoom on a Geometry or Plot Watch? Presently it is constrained to the same aspect ratio of the window. It seems like it should only require the addition of a true/false selection in, e.g., GeometryWatchOptions.cs and a conditional statement in (e.g.) GeometryWatchControl.xaml.cs imageGrid_MouseMove(...). I tried editing that myself and it did allow me to create a selection box unconstrained, but it seems like the actual zoom is still constrained. I'm not as familiar with debugging something like this in C#, but I'm guessing it's either correcting the variables h and w in that method, or the method zoom in Viewport.cs is doing something. Thoughts?

Custom data types support

While I see examples of adding support for new point types, how do we add support for custom geometry types, ex a custom polygon structure?

VS2022 Support Patch

I don't know if you are planning a VS2022 support soon but here is a patch that worked for me on VS2022
0001-may-work-with-vs2022.zip

This is NOT a patch for making the project work on all VS versions in a backward compatible way.

There are multitude of changes in VS2022 API. One of the problematic changes is they removed deprecated support for embedding interop types and provided Microsoft.VisualStudio.Interop package.

When I first tried to make ot work with old assemblies, errors for multiple definitions of EnvDTE were all over the place. So, instead of making a compatible PR, I ended up with a somewhat working patch for VS2022.

One of the main issues with the patch is, it removes all existing references to VS DLLs and adds a single reference to SDK itself. While that makes it easy to work with extension code, since it does not add required DLLs into the VSIX package, removes support for old VS versions (including 2019).

For package manifest, having amd64 installation targets for new versions can coexist with old installation targets. But, I removed old installation targets so that people may not accidentally install over valid versions of the extension.

Hope this helps for people like me. But, for maintainers, I am sorry this is all I can do.

How to draw points as polygons

Hi,

I've added my own type as follows:

  <Point Type="glm::vec&lt;*&gt;" Id="glm::vec">
    <Coordinates>
      <X>x</X>
      <Y>y</Y>
    </Coordinates>
  </Point>

which displays std::vector<glm::vec3> as a collection of points in the Geometry Watch, but I can't figure out how to display those points as a polygon. I was hoping that would happen automatically.

How can I do that?

Add support for more libraries

Hiding/Showing data changes the viewport position

I'm viewing several lists of points in the Geometry Watch window and I've noticed when I show or hide different variables the viewport position is jumping around. Presumably to recentre itself on the remaining points, but that's monumentally unhelpful when I'm just trying to see what the differences are in the region I'm focused on.

Hiding and showing data should not adjust either the position or the scale of the viewport. There should be separate controls for that.

Advanced display capabilities

Hi. Very handy tool! It would be very nice if there was some additional functionality:

  1. A checkbox (or similar) to temporarily disable display of a watch, without having to remove/re-add it
  2. Color choice for each watch

Thanks!

Add ability to define x and y points

It would be nice to be able to be able to plot independent x and y values in the Plot Watch similar to ArrayPlotter.

For example I have std::vector<double> x and std::vector<double> y. I am currently creating a std::vector<std::pair<double, double>> from to the two vectors but it would be nice to be able to use the data structures in place.

Recommend Projects

  • React photo React

    A declarative, efficient, and flexible JavaScript library for building user interfaces.

  • Vue.js photo Vue.js

    ๐Ÿ–– Vue.js is a progressive, incrementally-adoptable JavaScript framework for building UI on the web.

  • Typescript photo Typescript

    TypeScript is a superset of JavaScript that compiles to clean JavaScript output.

  • TensorFlow photo TensorFlow

    An Open Source Machine Learning Framework for Everyone

  • Django photo Django

    The Web framework for perfectionists with deadlines.

  • D3 photo D3

    Bring data to life with SVG, Canvas and HTML. ๐Ÿ“Š๐Ÿ“ˆ๐ŸŽ‰

Recommend Topics

  • javascript

    JavaScript (JS) is a lightweight interpreted programming language with first-class functions.

  • web

    Some thing interesting about web. New door for the world.

  • server

    A server is a program made to process requests and deliver data to clients.

  • Machine learning

    Machine learning is a way of modeling and interpreting data that allows a piece of software to respond intelligently.

  • Game

    Some thing interesting about game, make everyone happy.

Recommend Org

  • Facebook photo Facebook

    We are working to build community through open source technology. NB: members must have two-factor auth.

  • Microsoft photo Microsoft

    Open source projects and samples from Microsoft.

  • Google photo Google

    Google โค๏ธ Open Source for everyone.

  • D3 photo D3

    Data-Driven Documents codes.