Giter VIP home page Giter VIP logo

docker-elastic-stack's Introduction

el-stack-logo

Elastic Stack Dockerfile

CircleCI License Docker Stars Docker Pulls Docker Image

This repository contains a Dockerfile of the Elastic Stack.

Dependencies

Image Tags

$ docker images

REPOSITORY                    TAG                 VIRTUAL SIZE
blacktop/elastic-stack        latest              1.91GB
blacktop/elastic-stack        7.13                1.91GB
blacktop/elastic-stack        7.12                1.26GB
blacktop/elastic-stack        7.11                1.26GB
blacktop/elastic-stack        7.10                1.26GB
blacktop/elastic-stack        7.9                 1.16GB
blacktop/elastic-stack        7.8                 1.16GB
blacktop/elastic-stack        7.7                 1.15GB
blacktop/elastic-stack        7.6                 976MB
blacktop/elastic-stack        7.5                 856MB
blacktop/elastic-stack        7.4                 870MB
blacktop/elastic-stack        7.3                 880MB
blacktop/elastic-stack        7.2                 850MB
blacktop/elastic-stack        7.1                 850MB
blacktop/elastic-stack        7.0                 801MB
blacktop/elastic-stack        6.8                 801MB
blacktop/elastic-stack        6.7                 801MB
blacktop/elastic-stack        6.6                 1.13GB
blacktop/elastic-stack        6.5                 1.16GB
blacktop/elastic-stack        6.4                 668MB
blacktop/elastic-stack        6.3                 717MB
blacktop/elastic-stack        6.2                 698MB
blacktop/elastic-stack        6.1                 620MB
blacktop/elastic-stack        6.0                 561MB
blacktop/elastic-stack        5.6                 543MB
blacktop/elastic-stack        5.5                 537MB
blacktop/elastic-stack        5.4                 539MB
blacktop/elastic-stack        5.3                 538MB
blacktop/elastic-stack        geoip               558MB
blacktop/elastic-stack        5.2                 537MB
blacktop/elastic-stack        4.6                 450.9MB
blacktop/elastic-stack        3.1                 363.3MB

NOTE: tag geoip is the same as tag latest, but includes the ingest-geoip and the ingest-user-agent plugins.

Getting Started

$ docker run -d --name elstack -p 80:80 -p 9200:9200 blacktop/elastic-stack

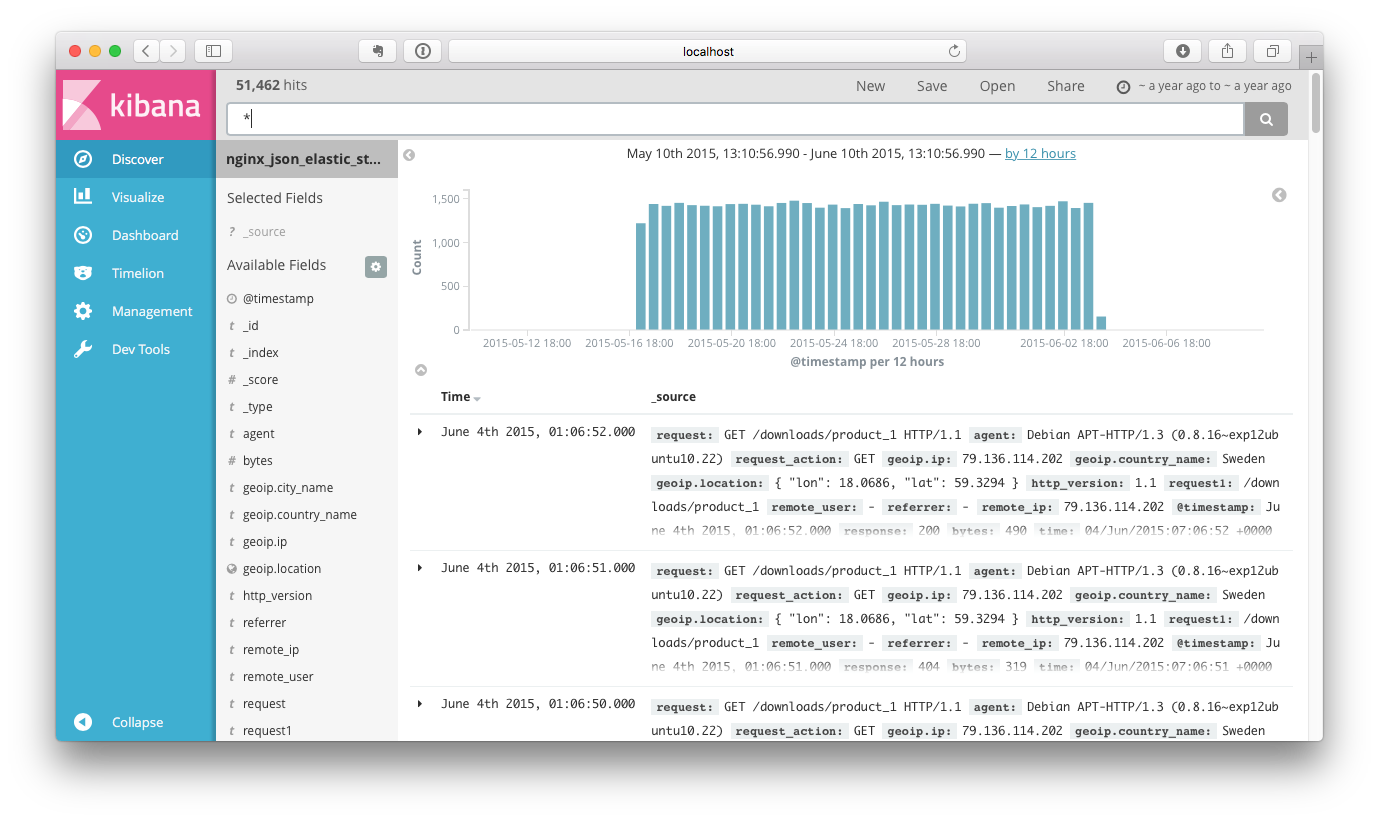
Now Navigate To

elk-logo

You can also use each part of the stack independently

Documentation

Known Issues โš ๏ธ

I have noticed when running the new 5.0 version on a linux host you need to increase the memory map areas with the following command

echo "vm.max_map_count=262144" | sudo tee -a /etc/sysctl.conf
sudo sysctl -w vm.max_map_count=262144

Issues

Find a bug? Want more features? Find something missing in the documentation? Let me know! Please don't hesitate to file an issue

Credits

Heavily (if not entirely) influenced by all the elastic official docker images

Todo

  • Install/Run Elastic Stack
  • Start Daemon and watch folder with supervisord
  • Expose Logstash config folder as well as Nginx sites folder as Volumes
  • Build ES test data docker image
  • Add Nginx entrypoint to pass USER/PASS in as env vars
  • Add SSL (auto-create certs if not found)
  • Add back a 3.0 version of the stack (elk stack)
  • Integrate with Bro-IDS

License

MIT Copyright (c) 2014-2020 blacktop

docker-elastic-stack's People

Contributors

blacktop avatar cwdavies avatar nixnux86 avatar timbotetsu avatar

Stargazers

 avatar  avatar  avatar  avatar  avatar  avatar  avatar  avatar  avatar  avatar  avatar  avatar  avatar  avatar  avatar  avatar  avatar  avatar  avatar  avatar  avatar  avatar  avatar  avatar  avatar  avatar  avatar  avatar  avatar  avatar  avatar  avatar  avatar  avatar  avatar  avatar  avatar  avatar  avatar  avatar  avatar  avatar  avatar  avatar  avatar  avatar  avatar  avatar  avatar  avatar  avatar  avatar  avatar  avatar  avatar  avatar  avatar  avatar  avatar  avatar  avatar  avatar  avatar  avatar  avatar  avatar  avatar  avatar  avatar  avatar  avatar  avatar  avatar  avatar  avatar  avatar  avatar  avatar  avatar  avatar  avatar  avatar  avatar  avatar  avatar  avatar  avatar  avatar  avatar  avatar  avatar  avatar  avatar  avatar  avatar  avatar  avatar  avatar  avatar  avatar

Watchers

 avatar  avatar  avatar  avatar  avatar  avatar  avatar  avatar  avatar  avatar  avatar  avatar  avatar  avatar  avatar  avatar  avatar  avatar  avatar  avatar  avatar  avatar  avatar  avatar  avatar

docker-elastic-stack's Issues

Supervisor running as root, privileges not dropped

2022-04-30 14:31:12,287 CRIT Supervisor is running as root.  Privileges were not dropped because no user is specified in the config file.  If you intend to run as root, you can set user=root in the config file to avoid this message.
<snip>
2022-04-30 14:14:41,900 INFO gave up: kibana entered FATAL state, too many start retries too quickly

And kibana cannot load. This seems to be perhaps a recent change in docker, needing to set the user command in a docker-compose file (maybe), but I was unable to resolve it. This image "just worked" for the longest time, and it did not come back up after restarting it today. Any suggestions to remedy are welcome, thank you!

Add curl to base image?

Hi, first off thanks for all the hard work you've put into this image!

Would you consider adding 'curl' to the base image? It would let users interact with the ELK API via compose or other .sh scripts. My specific use case would be to import some dashboard/visualizations from a .ndjson file that I would like to have ready to go when I start the container.

curl -X POST "localhost:5601/api/saved_objects/_import" -H "kbn-xsrf: true" --form [email protected] for example

Or perhaps you know a different way to get Kibana to import a dashboard without needing curl?

Thanks again, your work is appreciated

Question: Need to make changes to the dockerfile and then copy to

Hello Team Blacktop,

Full disclosure, I have been working with docker for only a week. That is 12 hours a day though. So, I could be asking for totally stupid questions.

The elastic stack container is perfect for my needs. I need the ability to spin up an ELK stack and load some data. This is just for a demo on how digital forensics timelines could be loaded on the fly. Loading these timelines into ELK is nothing new. It is the ability to stand up the capability and have millions of row loaded int 15 min that it. The test I have run show that it is easily doable.

What I need to do is to be able to put 2 - 3 small logstash config files in the container and have them be persistent. I have experimented with volumes and they work great for having a connection to the host to get to the data that need to be loaded. I don't know how to make volumes hold this data and still be able to distribute the volume along with the image.

I was thinking that I could use the docker file to add those files into the image/container with COPY or ADD. Would that be reasonable? Is there a location where the files could be placed and remain after a commit?

If I make changes like that to my local GitHub repo, how can I push those back to my GitHub and eventually to my Docker Hub?

Is this even allowed? Meaning would this violate your license?

Any guidance is appreciated.

Thanks
Mark Hallman

Incorrect version 7.3 deploy

Hi,

I think last deploy has incorrect version:

blacktop/elastic-stack 7.3 869MB

When I deploy the image, the version is 7.2.1:

	NODE_VERSION=10.15.2
	YARN_VERSION=1.13.0
	STACK=7.2.1
	JAVA_HOME=/usr/lib/jvm/java-1.8-openjdk
	LS_SETTINGS_DIR=/etc/logstash
	ES_TMPDIR=/usr/share/elasticsearch/tmp

Volumes: /etc/logstash/conf.d
/etc/nginx
/usr/share/elasticsearch/data

Best regards.

Kibana could not start normally in version 7.9

reproduce:

docker run -d --name elkstack blacktop/elastic-stack:7.9

after a while tap docker logs -f elkstack will show:

2020-10-10 06:32:28,667 CRIT Supervisor is running as root.  Privileges were not dropped because no user is specified in the config file.  If you intend to run as root, you can set user=root in the config file to avoid this message.
2020-10-10 06:32:28,669 INFO supervisord started with pid 7
2020-10-10 06:32:29,673 INFO spawned: 'elasticsearch' with pid 9
2020-10-10 06:32:29,675 INFO spawned: 'kibana' with pid 10
2020-10-10 06:32:29,677 INFO spawned: 'logstash' with pid 11
2020-10-10 06:32:29,679 INFO spawned: 'nginx' with pid 12
2020-10-10 06:32:29,971 INFO exited: kibana (exit status 1; not expected)
2020-10-10 06:32:31,211 INFO success: elasticsearch entered RUNNING state, process has stayed up for > than 1 seconds (startsecs)
2020-10-10 06:32:31,212 INFO spawned: 'kibana' with pid 112
2020-10-10 06:32:31,213 INFO success: logstash entered RUNNING state, process has stayed up for > than 1 seconds (startsecs)
2020-10-10 06:32:31,213 INFO success: nginx entered RUNNING state, process has stayed up for > than 1 seconds (startsecs)
2020-10-10 06:32:31,479 INFO exited: kibana (exit status 1; not expected)
2020-10-10 06:32:33,482 INFO spawned: 'kibana' with pid 170
2020-10-10 06:32:34,026 INFO exited: kibana (exit status 1; not expected)
2020-10-10 06:32:38,021 INFO spawned: 'kibana' with pid 188
2020-10-10 06:32:38,627 INFO exited: kibana (exit status 1; not expected)
2020-10-10 06:32:38,924 INFO gave up: kibana entered FATAL state, too many start retries too quickly

docker exec elkstack cat /var/log/kibana.stderr.log will show:

[WARN  tini (10)] Tini is not running as PID 1 and isn't registered as a child subreaper.
Zombie processes will not be re-parented to Tini, so zombie reaping won't work.
To fix the problem, use the -s option or set the environment variable TINI_SUBREAPER to register Tini as a child subreaper, or run Tini as PID 1.
Kibana does not support the current Node.js version v10.21.0. Please use Node.js v10.22.0.
[WARN  tini (112)] Tini is not running as PID 1 and isn't registered as a child subreaper.
Zombie processes will not be re-parented to Tini, so zombie reaping won't work.
To fix the problem, use the -s option or set the environment variable TINI_SUBREAPER to register Tini as a child subreaper, or run Tini as PID 1.
Kibana does not support the current Node.js version v10.21.0. Please use Node.js v10.22.0.
[WARN  tini (170)] Tini is not running as PID 1 and isn't registered as a child subreaper.
Zombie processes will not be re-parented to Tini, so zombie reaping won't work.
To fix the problem, use the -s option or set the environment variable TINI_SUBREAPER to register Tini as a child subreaper, or run Tini as PID 1.
Kibana does not support the current Node.js version v10.21.0. Please use Node.js v10.22.0.
[WARN  tini (188)] Tini is not running as PID 1 and isn't registered as a child subreaper.
Zombie processes will not be re-parented to Tini, so zombie reaping won't work.
To fix the problem, use the -s option or set the environment variable TINI_SUBREAPER to register Tini as a child subreaper, or run Tini as PID 1.
Kibana does not support the current Node.js version v10.21.0. Please use Node.js v10.22.0.

seems that Node.js version should be bump v10.22.0+

Unable to connect to Elasticsearch at http://localhost:9200.

Hello,

I'm trying to install elastic stack on my cloud (On a scaleway server, docker image server), but status is always red.

I have the message below :
Unable to connect to Elasticsearch at http://localhost:9200.

To try in more simple environment, I tried on a ubuntu VM on my local laptop, but I have the same issue. Do you have any idea how to solve my problem ?

Below you can see the logs of elstack container :

2017-03-23 11:27:59,587 CRIT Supervisor running as root (no user in config file)
2017-03-23 11:27:59,590 INFO supervisord started with pid 5
2017-03-23 11:28:00,593 INFO spawned: 'nginx' with pid 8
2017-03-23 11:28:00,596 INFO spawned: 'elasticsearch' with pid 9
2017-03-23 11:28:00,606 INFO spawned: 'logstash' with pid 10
2017-03-23 11:28:00,612 INFO spawned: 'kibana' with pid 11
2017-03-23 11:28:01,755 INFO success: nginx entered RUNNING state, process has stayed up for > than 1 seconds (startsecs)
2017-03-23 11:28:01,755 INFO success: elasticsearch entered RUNNING state, process has stayed up for > than 1 seconds (startsecs)
2017-03-23 11:28:01,755 INFO success: logstash entered RUNNING state, process has stayed up for > than 1 seconds (startsecs)

Thanks ;)

What changes need for Ubuntu18.10

Hi ,
Please guide me to make image for Ubuntu 18.10. I am getting issue with add user and installing software like libc6-compact and libzmq.

Getting issue to add user on Ubuntu. Command throws error.

Also, what is the purpose of using nodejs, apache2-utils. Without these how to create images.

Please help.

Thanks

Document how to add a configuration file

Once you have the docker container up and running, you will get the following errors in the logs.

core@core-01 ~ $ docker logs elk
2015-01-14 22:20:13,821 CRIT Supervisor running as root (no user in config file)
2015-01-14 22:20:13,821 WARN Included extra file "/etc/supervisor/conf.d/supervisord.conf" during parsing
2015-01-14 22:20:13,843 INFO RPC interface 'supervisor' initialized
2015-01-14 22:20:13,844 WARN cElementTree not installed, using slower XML parser for XML-RPC
2015-01-14 22:20:13,844 CRIT Server 'unix_http_server' running without any HTTP authentication checking
2015-01-14 22:20:13,844 INFO supervisord started with pid 1
2015-01-14 22:20:14,847 INFO spawned: 'nginx' with pid 9
2015-01-14 22:20:14,848 INFO spawned: 'elasticsearch' with pid 10
2015-01-14 22:20:14,850 INFO spawned: 'logstash' with pid 11
2015-01-14 22:20:15,852 INFO success: nginx entered RUNNING state, process has stayed up for > than 1 seconds (startsecs)
2015-01-14 22:20:15,856 INFO success: elasticsearch entered RUNNING state, process has stayed up for > than 1 seconds (startsecs)
2015-01-14 22:20:15,856 INFO success: logstash entered RUNNING state, process has stayed up for > than 1 seconds (startsecs)
2015-01-14 22:20:29,089 INFO exited: logstash (exit status 1; not expected)
2015-01-14 22:20:30,090 INFO spawned: 'logstash' with pid 78
2015-01-14 22:20:31,093 INFO success: logstash entered RUNNING state, process has stayed up for > than 1 seconds (startsecs)
2015-01-14 22:20:40,455 INFO exited: logstash (exit status 1; not expected)
2015-01-14 22:20:41,457 INFO spawned: 'logstash' with pid 103
2015-01-14 22:20:42,460 INFO success: logstash entered RUNNING state, process has stayed up for > than 1 seconds (startsecs)
2015-01-14 22:20:51,883 INFO exited: logstash (exit status 1; not expected)
2015-01-14 22:20:52,887 INFO spawned: 'logstash' with pid 127

I assume that this is because a config file has not been made. It would be nice if the documentation explained how to add a config file to the volumes

Port 9300 bound to localhost - not usable from outside by default

I just tried the image together with the java client. That client communicates over port 9300. While the image exposes port 9300, the elastic configuration binds by default to localhost.

http://localhost:9200/_nodes/http?pretty:

"nodes" : {
    "transport_address" : "127.0.0.1:9300",

Suggestion: Uncomment the line #transport.host: 0.0.0.0 in elasticsearch.yaml. As it's still up to the user to map 9300 in docker if needed, this should not be a security give-away.

Thanks for the great image!

nginx problem in 5.4?

I've just updated to the 5.4 image, and nginx would not come up but complain:

Generating a 4086 bit RSA private key
......++
...........................................................................++
writing new private key to '/etc/nginx/ssl/kibana.key'
-----
rm: can't remove '/etc/nginx/conf.d/kibana.conf': No such file or directory
nginx: [emerg] a duplicate default server for [::]:80 in /etc/nginx/conf.d/ssl.kibana.conf:2

Seems port 80 was defined in both default.conf and kibana.conf. Deleting default.conf solved it (not sure if it's the right way though)

ELK Stack 6.0-rc1 Deployment issue IOError: [Errno 13] Permission denied: '/supervisord.log'

Hi,

I have using below command to create a docker image build.Just added a few path to the filebeat.yaml as below where they are on the my host where Docker file on the same host

    - /var/log/secure
    - /var/log/messages
    - /var/log/tip.log

And also same way added to the new filter file to the logstash config/logstash/conf.d/12-tip-filter.conf

Then i have run docker build command with my internal registry

docker build . -t 172.30.145.28:5000/elk/elk-stack:6.0-rc1

after push it to the my registry and when i deploy it on openshift i have got below error.

Nov 06 15:20:40 openshiftnode-3.linkplus.int dockerd-current[1388]: Traceback (most recent call last):
Nov 06 15:20:40 openshiftnode-3.linkplus.int dockerd-current[1388]: File "/usr/bin/supervisord", line 11, in
Nov 06 15:20:40 openshiftnode-3.linkplus.int dockerd-current[1388]: load_entry_point('supervisor==3.2.4', 'console_scripts', 'supervisord')()
Nov 06 15:20:40 openshiftnode-3.linkplus.int dockerd-current[1388]: File "/usr/lib/python2.7/site-packages/supervisor/supervisord.py", line 367, in main
Nov 06 15:20:40 openshiftnode-3.linkplus.int dockerd-current[1388]: go(options)
Nov 06 15:20:40 openshiftnode-3.linkplus.int dockerd-current[1388]: File "/usr/lib/python2.7/site-packages/supervisor/supervisord.py", line 377, in go
Nov 06 15:20:40 openshiftnode-3.linkplus.int dockerd-current[1388]: d.main()
Nov 06 15:20:40 openshiftnode-3.linkplus.int dockerd-current[1388]: File "/usr/lib/python2.7/site-packages/supervisor/supervisord.py", line 77, in main
Nov 06 15:20:40 openshiftnode-3.linkplus.int dockerd-current[1388]: info_messages)
Nov 06 15:20:40 openshiftnode-3.linkplus.int dockerd-current[1388]: File "/usr/lib/python2.7/site-packages/supervisor/options.py", line 1389, in make_logger
Nov 06 15:20:40 openshiftnode-3.linkplus.int dockerd-current[1388]: stdout = self.nodaemon,
Nov 06 15:20:40 openshiftnode-3.linkplus.int dockerd-current[1388]: File "/usr/lib/python2.7/site-packages/supervisor/loggers.py", line 346, in getLogger
Nov 06 15:20:40 openshiftnode-3.linkplus.int dockerd-current[1388]: handlers.append(RotatingFileHandler(filename,'a',maxbytes,backups))
Nov 06 15:20:40 openshiftnode-3.linkplus.int dockerd-current[1388]: File "/usr/lib/python2.7/site-packages/supervisor/loggers.py", line 172, in init
Nov 06 15:20:40 openshiftnode-3.linkplus.int dockerd-current[1388]: FileHandler.init(self, filename, mode)
Nov 06 15:20:40 openshiftnode-3.linkplus.int dockerd-current[1388]: File "/usr/lib/python2.7/site-packages/supervisor/loggers.py", line 98, in init
Nov 06 15:20:40 openshiftnode-3.linkplus.int dockerd-current[1388]: self.stream = open(filename, mode)
Nov 06 15:20:40 openshiftnode-3.linkplus.int dockerd-current[1388]: IOError: [Errno 13] Permission denied: '/supervisord.log'

elasticsearch exit accidentally

env:
ubuntu 16.04 with vmware

the command was this
sudo docker run -p 80:80 -p 9200:9200 blacktop/elastic-stack:5.1

the result was:
image

and the kibana ui turned out:
image

Could you help me to find out the cause?

error message when trying to import data via logstash

NotImplementedError: stat.st_dev unsupported or native support failed to load; see http://wiki.jruby.org/Native-Libraries
                    inode at /usr/share/logstash/vendor/bundle/jruby/2.3.0/gems/filewatch-0.9.0/lib/filewatch/watch.rb:106
           block in watch at /usr/share/logstash/vendor/bundle/jruby/2.3.0/gems/filewatch-0.9.0/lib/filewatch/watch.rb:97
  block in _discover_file at /usr/share/logstash/vendor/bundle/jruby/2.3.0/gems/filewatch-0.9.0/lib/filewatch/watch.rb:313
                     each at org/jruby/RubyArray.java:1734
                     each at org/jruby/RubyEnumerator.java:323
                     each at org/jruby/RubyEnumerator.java:329
           _discover-bash: NotImplementedError:: command not found
_file at /usr/share/logstash/vendor/bundle/jruby/2.3.0/gems/filewatch-0.9.0/lib/filewatch/watch.rb:304
           block in watch at /usr/share/logstash/vendor/bundle/jruby/2.3.0/gems/filewatch-0.9.0/lib/filewatch/watch.rb:95
    block in synchronized at /usr/share/logstash/vendor/bundle/jruby/2.3.0/gems/filewatch-0.9.0/lib/filewatch/watch.rb:357
              synchronize at org/jruby/ext/thread/Mutex.java:148
             synchronized at /usr/share/logstash/vendor/bundle/jruby/2.3.0/gems/filewatch-0.9.0/lib/filewatch/watch.rb:357
                    watch at /usr/share/logstash/vendor/bundle/jruby/2.3.0/gems/filewatch-0.9.0/lib/filewatch/watch.rb:92
                     tail at /usr/share/logstash/vendor/bundle/jruby/2.3.0/gems/filewatch-0.9.0/lib/filewatch/tail_base.rb:73
                     tail at /usr/share/logstash/vendor/jruby/lib/ruby/stdlib/forwardable.rb:189
   block in begin_tailing at /usr/share/logstash/vendor/bundle/jruby/2.3.0/gems/logstash-input-file-4.0.3/lib/logstash/inputs/file.rb:299
                     each at org/jruby/RubyArray.java:1734
            begin_tailing at /usr/share/logstash/vendor/bundle/jruby/2.3.0/gems/logstash-input-file-4.0.3/lib/logstash/inputs/file.rb:299
                      run at /usr/share/logstash/vendor/bundle/jruby/2.3.0/gems/logstash-input-file-4.0.3/lib/logstash/inputs/file.rb:303
              inputworker at /usr/share/logstash/logstash-core/lib/logstash/pipeline.rb:574
     block in start_input at /usr/share/logstash/logstash-core/lib/logstash/pipeline.rb:567

It is related to this
docker-library/logstash@49503dc

This fixed the problem (tested with 5.6 and latest)
apk update && apk add libc6-compat

Unable to connect to Elasticsearch at http://localhost:9200.

I get the above error in Kibana at localhost:80. I recieve the following log file from docker logs of the image then I try and spin up the cointaner.

2017-06-16 12:51:51,999 CRIT Supervisor running as root (no user in config file)
2017-06-16 12:51:52,001 INFO supervisord started with pid 6
2017-06-16 12:51:53,004 INFO spawned: 'nginx' with pid 9
2017-06-16 12:51:53,005 INFO spawned: 'elasticsearch' with pid 10
2017-06-16 12:51:53,006 INFO spawned: 'logstash' with pid 11
2017-06-16 12:51:53,007 INFO spawned: 'kibana' with pid 12
2017-06-16 12:51:54,527 INFO success: nginx entered RUNNING state, process has stayed up for > than 1 seconds (startsecs)
2017-06-16 12:51:54,650 INFO success: elasticsearch entered RUNNING state, process has stayed up for > than 1 seconds (startsecs)
2017-06-16 12:51:54,652 INFO success: logstash entered RUNNING state, process has stayed up for > than 1 seconds (startsecs)
2017-06-16 12:51:58,723 INFO success: kibana entered RUNNING state, process has stayed up for > than 5 seconds (startsecs)
2017-06-16 12:52:00,796 INFO exited: elasticsearch (exit status 1; not expected)
2017-06-16 12:52:01,855 INFO spawned: 'elasticsearch' with pid 82
2017-06-16 12:52:03,886 INFO success: elasticsearch entered RUNNING state, process has stayed up for > than 1 seconds (startsecs)
2017-06-16 12:52:10,927 INFO exited: elasticsearch (exit status 1; not expected)
2017-06-16 12:52:11,624 INFO spawned: 'elasticsearch' with pid 138
2017-06-16 12:52:12,625 INFO success: elasticsearch entered RUNNING state, process has stayed up for > than 1 seconds (startsecs)
2017-06-16 12:52:27,410 INFO exited: elasticsearch (exit status 1; not expected)
2017-06-16 12:52:27,962 INFO spawned: 'elasticsearch' with pid 194
2017-06-16 12:52:28,858 INFO success: elasticsearch entered RUNNING state, process has stayed up for > than 1 seconds (startsecs)
2017-06-16 12:52:41,573 INFO exited: elasticsearch (exit status 1; not expected)
2017-06-16 12:52:42,148 INFO spawned: 'elasticsearch' with pid 250
2017-06-16 12:52:43,153 INFO success: elasticsearch entered RUNNING state, process has stayed up for > than 1 seconds (startsecs)
2017-06-16 12:52:55,206 INFO exited: elasticsearch (exit status 1; not expected)
2017-06-16 12:52:56,299 INFO spawned: 'elasticsearch' with pid 306
2017-06-16 12:52:57,355 INFO success: elasticsearch entered RUNNING state, process has stayed up for > than 1 seconds (startsecs)
2017-06-16 12:53:10,543 INFO exited: elasticsearch (exit status 1; not expected)
2017-06-16 12:53:10,632 INFO spawned: 'elasticsearch' with pid 362
2017-06-16 12:53:11,635 INFO success: elasticsearch entered RUNNING state, process has stayed up for > than 1 seconds (startsecs)
2017-06-16 12:53:23,833 INFO exited: elasticsearch (exit status 1; not expected)
2017-06-16 12:53:24,771 INFO spawned: 'elasticsearch' with pid 418
2017-06-16 12:53:25,776 INFO success: elasticsearch entered RUNNING state, process has stayed up for > than 1 seconds (startsecs)

Failed to start elasticsearch

initial heap size [268435456] not equal to maximum heap size [2147483648]; this can cause resize pauses and prevents mlockall from locking the entire heap
at org.elasticsearch.bootstrap.BootstrapCheck.check(BootstrapCheck.java:125)
at org.elasticsearch.bootstrap.BootstrapCheck.check(BootstrapCheck.java:85)
at org.elasticsearch.bootstrap.BootstrapCheck.check(BootstrapCheck.java:65)
at org.elasticsearch.bootstrap.Bootstrap$5.validateNodeBeforeAcceptingRequests(Bootstrap.java:183)
at org.elasticsearch.node.Node.start(Node.java:337)
at org.elasticsearch.bootstrap.Bootstrap.start(Bootstrap.java:198)
at org.elasticsearch.bootstrap.Bootstrap.init(Bootstrap.java:257)
at org.elasticsearch.bootstrap.Elasticsearch.init(Elasticsearch.java:96)
at org.elasticsearch.bootstrap.Elasticsearch.execute(Elasticsearch.java:91)
at org.elasticsearch.cli.SettingCommand.execute(SettingCommand.java:54)
at org.elasticsearch.cli.Command.mainWithoutErrorHandling(Command.java:91)
at org.elasticsearch.cli.Command.main(Command.java:53)
at org.elasticsearch.bootstrap.Elasticsearch.main(Elasticsearch.java:70)
at org.elasticsearch.bootstrap.Elasticsearch.main(Elasticsearch.java:63)
Refer to the log for complete error details.
OpenJDK 64-Bit Server VM warning: INFO: os::commit_memory(0x0000000085330000, 2060255232, 0) failed; error='Cannot allocate memory' (errno=12)
root@4f38578f03e7:/# service elasticsearch restart
Stopping Elasticsearch Server: Elasticsearch Server is not running but pid file exists, cleaning up.
Starting Elasticsearch Server:sysctl: setting key "vm.max_map_count": Read-only file system
failed!

Unable to start Elastic docker

When I've use the docker stack, it can't start with Elastic server always exit with code 1;

Please check, to reproduce just start the docker from this repo.

Thanks

Enabling x-pack-reporting?

Hello all,
I would like to enable x-pack reporting when running elastic-stack (e.g with v6.6)
I tried setting it through an environment variable when running the docker image:
docker run -p 80:80 -p 9200:9200 --name elstack -e XPACK_MONITORING_ENABLED=true blacktop/elastic-stack:6.6
But, unfortunately without any success!
Any way to do it without having to build my own image?
Thanks,
Thom

IOError: [Errno 13] Permission denied: '/supervisord.log'

Hi,

thanks you for support this docker image.

I have installed Elastic Stack 7.0.0 in Openshift, and don't deploy. This is the error log:

Traceback (most recent call last):
File "/usr/bin/supervisord", line 11, in
load_entry_point('supervisor==3.3.4', 'console_scripts', 'supervisord')()
File "/usr/lib/python2.7/site-packages/supervisor/supervisord.py", line 357, in main
go(options)
File "/usr/lib/python2.7/site-packages/supervisor/supervisord.py", line 367, in go
d.main()
File "/usr/lib/python2.7/site-packages/supervisor/supervisord.py", line 71, in main
self.options.make_logger()
File "/usr/lib/python2.7/site-packages/supervisor/options.py", line 1423, in make_logger
stdout = self.nodaemon,
File "/usr/lib/python2.7/site-packages/supervisor/loggers.py", line 346, in getLogger
handlers.append(RotatingFileHandler(filename,'a',maxbytes,backups))
File "/usr/lib/python2.7/site-packages/supervisor/loggers.py", line 172, in init
FileHandler.init(self, filename, mode)
File "/usr/lib/python2.7/site-packages/supervisor/loggers.py", line 98, in init
self.stream = open(filename, mode)
IOError: [Errno 13] Permission denied: '/supervisord.log'

Best regards.

Elasticsearch init fails, because it failed to obtain node locks

Elasticsearch starts with this Error:

[2017-07-06T08:11:25,465][INFO ][o.e.n.Node               ] [] initializing ...
[2017-07-06T08:11:25,502][WARN ][o.e.b.ElasticsearchUncaughtExceptionHandler] [] uncaught exception in thread [main]
org.elasticsearch.bootstrap.StartupException: java.lang.IllegalStateException: failed to obtain node locks, tried [[/usr/share/elasticsearch/data/elasticsearch]] with lock id [0]; maybe these locations are not wr
itable or multiple nodes were started without increasing [node.max_local_storage_nodes] (was [1])?
	at org.elasticsearch.bootstrap.Elasticsearch.init(Elasticsearch.java:127) ~[elasticsearch-5.4.3.jar:5.4.3]
	at org.elasticsearch.bootstrap.Elasticsearch.execute(Elasticsearch.java:114) ~[elasticsearch-5.4.3.jar:5.4.3]
	at org.elasticsearch.cli.EnvironmentAwareCommand.execute(EnvironmentAwareCommand.java:67) ~[elasticsearch-5.4.3.jar:5.4.3]
	at org.elasticsearch.cli.Command.mainWithoutErrorHandling(Command.java:122) ~[elasticsearch-5.4.3.jar:5.4.3]
	at org.elasticsearch.cli.Command.main(Command.java:88) ~[elasticsearch-5.4.3.jar:5.4.3]
	at org.elasticsearch.bootstrap.Elasticsearch.main(Elasticsearch.java:91) ~[elasticsearch-5.4.3.jar:5.4.3]
	at org.elasticsearch.bootstrap.Elasticsearch.main(Elasticsearch.java:84) ~[elasticsearch-5.4.3.jar:5.4.3]
Caused by: java.lang.IllegalStateException: failed to obtain node locks, tried [[/usr/share/elasticsearch/data/elasticsearch]] with lock id [0]; maybe these locations are not writable or multiple nodes were start
ed without increasing [node.max_local_storage_nodes] (was [1])?
	at org.elasticsearch.env.NodeEnvironment.<init>(NodeEnvironment.java:261) ~[elasticsearch-5.4.3.jar:5.4.3]
	at org.elasticsearch.node.Node.<init>(Node.java:262) ~[elasticsearch-5.4.3.jar:5.4.3]
	at org.elasticsearch.node.Node.<init>(Node.java:242) ~[elasticsearch-5.4.3.jar:5.4.3]
	at org.elasticsearch.bootstrap.Bootstrap$5.<init>(Bootstrap.java:232) ~[elasticsearch-5.4.3.jar:5.4.3]
	at org.elasticsearch.bootstrap.Bootstrap.setup(Bootstrap.java:232) ~[elasticsearch-5.4.3.jar:5.4.3]
	at org.elasticsearch.bootstrap.Bootstrap.init(Bootstrap.java:350) ~[elasticsearch-5.4.3.jar:5.4.3]
	at org.elasticsearch.bootstrap.Elasticsearch.init(Elasticsearch.java:123) ~[elasticsearch-5.4.3.jar:5.4.3]
	... 6 more
Caused by: java.io.IOException: failed to obtain lock on /usr/share/elasticsearch/data/nodes/0
	at org.elasticsearch.env.NodeEnvironment.<init>(NodeEnvironment.java:240) ~[elasticsearch-5.4.3.jar:5.4.3]
	at org.elasticsearch.node.Node.<init>(Node.java:262) ~[elasticsearch-5.4.3.jar:5.4.3]
	at org.elasticsearch.node.Node.<init>(Node.java:242) ~[elasticsearch-5.4.3.jar:5.4.3]
	at org.elasticsearch.bootstrap.Bootstrap$5.<init>(Bootstrap.java:232) ~[elasticsearch-5.4.3.jar:5.4.3]
	at org.elasticsearch.bootstrap.Bootstrap.setup(Bootstrap.java:232) ~[elasticsearch-5.4.3.jar:5.4.3]
	at org.elasticsearch.bootstrap.Bootstrap.init(Bootstrap.java:350) ~[elasticsearch-5.4.3.jar:5.4.3]
	at org.elasticsearch.bootstrap.Elasticsearch.init(Elasticsearch.java:123) ~[elasticsearch-5.4.3.jar:5.4.3]
	... 6 more
Caused by: java.io.IOException: Mount point not found
	at sun.nio.fs.LinuxFileStore.findMountEntry(LinuxFileStore.java:91) ~[?:?]
	at sun.nio.fs.UnixFileStore.<init>(UnixFileStore.java:65) ~[?:?]
	at sun.nio.fs.LinuxFileStore.<init>(LinuxFileStore.java:44) ~[?:?]
	at sun.nio.fs.LinuxFileSystemProvider.getFileStore(LinuxFileSystemProvider.java:51) ~[?:?]
	at sun.nio.fs.LinuxFileSystemProvider.getFileStore(LinuxFileSystemProvider.java:39) ~[?:?]
	at sun.nio.fs.UnixFileSystemProvider.getFileStore(UnixFileSystemProvider.java:368) ~[?:?]
	at java.nio.file.Files.getFileStore(Files.java:1461) ~[?:1.8.0_121]
	at org.elasticsearch.env.ESFileStore.getMatchingFileStore(ESFileStore.java:107) ~[elasticsearch-5.4.3.jar:5.4.3]
	at org.elasticsearch.env.Environment.getFileStore(Environment.java:351) ~[elasticsearch-5.4.3.jar:5.4.3]
	at org.elasticsearch.env.NodeEnvironment$NodePath.<init>(NodeEnvironment.java:108) ~[elasticsearch-5.4.3.jar:5.4.3]
	at org.elasticsearch.env.NodeEnvironment.<init>(NodeEnvironment.java:227) ~[elasticsearch-5.4.3.jar:5.4.3]
	at org.elasticsearch.node.Node.<init>(Node.java:262) ~[elasticsearch-5.4.3.jar:5.4.3]
	at org.elasticsearch.node.Node.<init>(Node.java:242) ~[elasticsearch-5.4.3.jar:5.4.3]
	at org.elasticsearch.bootstrap.Bootstrap$5.<init>(Bootstrap.java:232) ~[elasticsearch-5.4.3.jar:5.4.3]
	at org.elasticsearch.bootstrap.Bootstrap.setup(Bootstrap.java:232) ~[elasticsearch-5.4.3.jar:5.4.3]
	at org.elasticsearch.bootstrap.Bootstrap.init(Bootstrap.java:350) ~[elasticsearch-5.4.3.jar:5.4.3]
	at org.elasticsearch.bootstrap.Elasticsearch.init(Elasticsearch.java:123) ~[elasticsearch-5.4.3.jar:5.4.3]
	... 6 more

It is started without any volumes so it can't be another instace of elasticsearch creating this node lock.

It ran for month on the same machine. I think an update of docker caused the problem. I will make an downgrade and try again.

This is the current docker version and kernel information:
docker info output:

Containers: 2
 Running: 2
 Paused: 0
 Stopped: 0
Images: 29
Server Version: 17.05.0-ce
Storage Driver: overlay2
 Backing Filesystem: extfs
 Supports d_type: true
 Native Overlay Diff: true
Logging Driver: json-file
Cgroup Driver: cgroupfs
Plugins: 
 Volume: local
 Network: bridge host macvlan null overlay
Swarm: inactive
Runtimes: runc
Default Runtime: runc
Init Binary: docker-init
containerd version: 9048e5e50717ea4497b757314bad98ea3763c145
runc version: 9c2d8d184e5da67c95d601382adf14862e4f2228
init version: 949e6fa
Security Options:
 seccomp
  Profile: default
Kernel Version: 4.11.7-1-ARCH
Operating System: Arch Linux
OSType: linux
Architecture: x86_64
CPUs: 4
Total Memory: 7.727GiB
Name: asiafix
Docker Root Dir: /var/lib/docker
Debug Mode (client): false
Debug Mode (server): false
Username: *******
Registry: https://index.docker.io/v1/
Experimental: false
Insecure Registries:
 127.0.0.0/8
Live Restore Enabled: false

Recommend Projects

  • React photo React

    A declarative, efficient, and flexible JavaScript library for building user interfaces.

  • Vue.js photo Vue.js

    ๐Ÿ–– Vue.js is a progressive, incrementally-adoptable JavaScript framework for building UI on the web.

  • Typescript photo Typescript

    TypeScript is a superset of JavaScript that compiles to clean JavaScript output.

  • TensorFlow photo TensorFlow

    An Open Source Machine Learning Framework for Everyone

  • Django photo Django

    The Web framework for perfectionists with deadlines.

  • D3 photo D3

    Bring data to life with SVG, Canvas and HTML. ๐Ÿ“Š๐Ÿ“ˆ๐ŸŽ‰

Recommend Topics

  • javascript

    JavaScript (JS) is a lightweight interpreted programming language with first-class functions.

  • web

    Some thing interesting about web. New door for the world.

  • server

    A server is a program made to process requests and deliver data to clients.

  • Machine learning

    Machine learning is a way of modeling and interpreting data that allows a piece of software to respond intelligently.

  • Game

    Some thing interesting about game, make everyone happy.

Recommend Org

  • Facebook photo Facebook

    We are working to build community through open source technology. NB: members must have two-factor auth.

  • Microsoft photo Microsoft

    Open source projects and samples from Microsoft.

  • Google photo Google

    Google โค๏ธ Open Source for everyone.

  • D3 photo D3

    Data-Driven Documents codes.