Giter VIP home page Giter VIP logo

bluebrain / vessmorphovis Goto Github PK

View Code? Open in Web Editor NEW
33.0 8.0 5.0 65.63 MB

A lightweight, interactive, extensible and cross-platform framework for building, visualizing and analyzing vasculature (or blood vessels) morphologies.

Home Page: https://portal.bluebrain.epfl.ch/

License: GNU General Public License v3.0

Python 99.51% Shell 0.49%
bbp blender-addon blood-vessels blue-brain-project meshing morphology simulation-based-neuroscience vascular-flow vascular-networks visualization

vessmorphovis's Introduction

DOI

Introduction

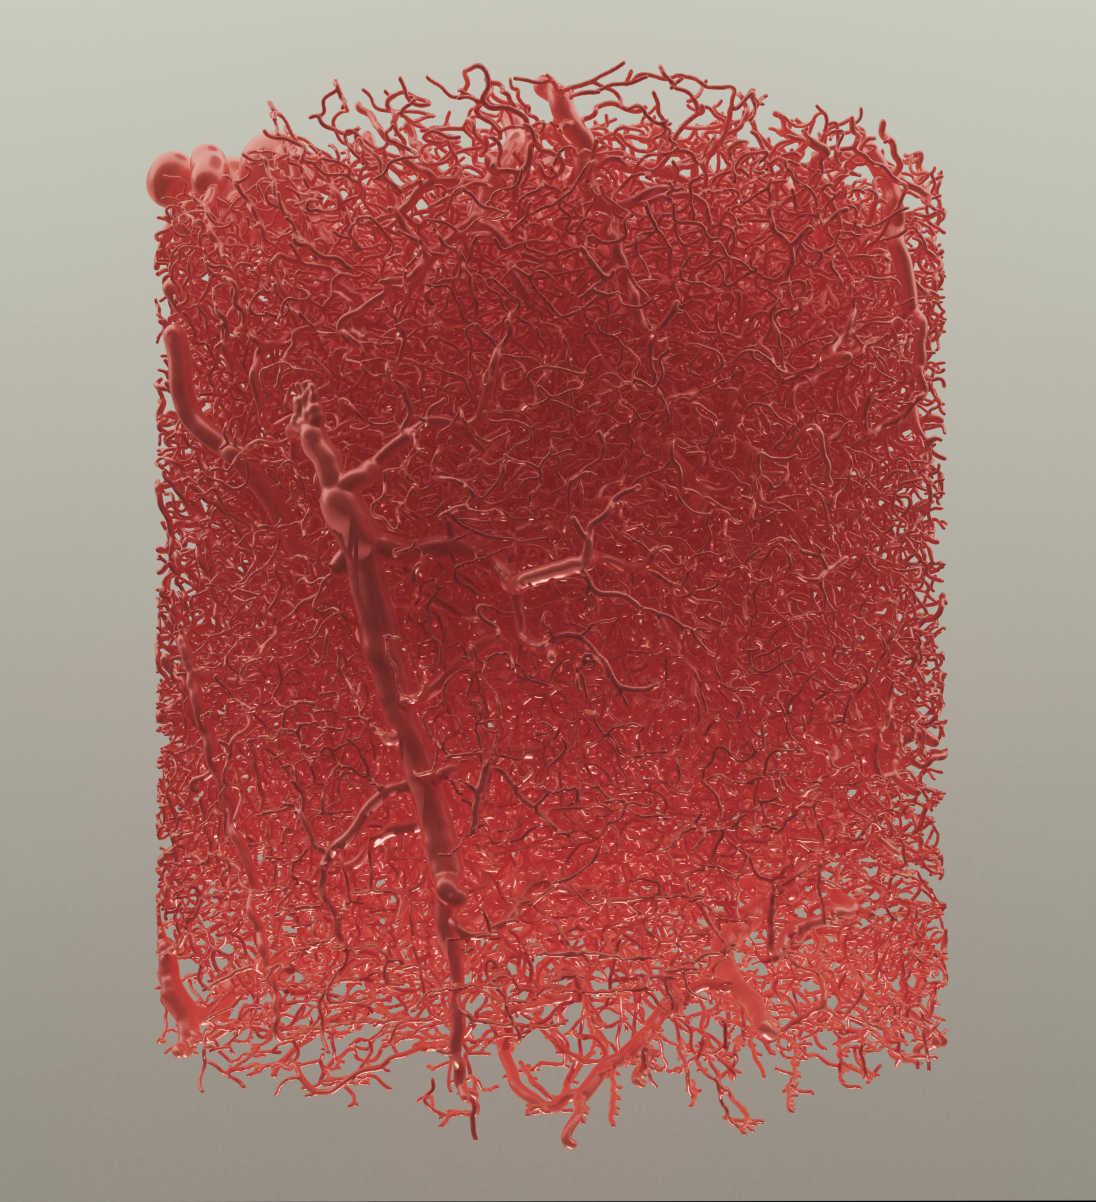
VessMorphoVis is an integrated suite of toolboxes for interactive visualization and analysis of vast brain vascular networks represented by morphological graphs segmented originally from imaging or microscopy stacks. Our workflow leverages the outstanding potentials of Blender, aiming to establish an integrated, extensible and domain-specific framework capable of interactive visualization, analysis, repair, high-fidelity meshing and high-quality rendering of vascular morphologies. VessMorphoVis is developed as an extension to its sister NeuroMorphoVis.

Features

  • Interactive visualization, analysis and automated repair of large-scale vasculature morphology skeletons (up to millions of samples).

  • Sketching and building three-dimensional representations of the vascular morphology skeletons using various methods for visual analytics.

  • Analysis of neuronal morphology skeletons that are digitally reconstructed from imaging or microscopy stacks.

  • An easy context to load broken morphology skeletons and repair them manually.

  • Automated reconstruction of polygonal mesh models that represent the surface of the vasvular morphologies based on the piecewise meshing method presented by Abdellah et al., 2017.

  • Accurate mesh reconstruction with MetaBalls to create watertight meshes for reaction-diffusion simulations.

  • Large scale and efficient rendering of the vascular morphologies and meshes using the Workbench renderer.

  • Automated high quality rendering of the vascular morphologies and their corresponding meshes using different shading nodes with Cycles.

  • Exporting the reconstructed meshes in several file formats including PLY, OBJ, STL and also as a Blender file (.blend).

Package Details

VessMorphoVis is mainly based on Blender. Blender is a free software and can be downloaded from Blender.org. Blender is released under the GNU General Public License (GPL, or “free software”). The current version of VessMorphoVis is compatible with the following Blender versions:

VessMorphoVis can be downloaded as a binary archive bundled within Blender that can be easily extracted and used out-of-the-box. The optional dependencies are already shiped within this archive using pip on each respective platform. This package (released every minor version update of the software) is recommended for Windows users or those who cannot use the Terminal. Otherwise, users can just download an installation script that will automatically install the entire package to a user-specified directory. This script does not require sudo permissions.

Documentation

The documentation is available here.

Known Bugs or Feature Requests

Please refer to the github issue tracker for fixed and open bugs. User can also report any bugs and request new features needed for their research. We are happy to provide direct support .

Gallery

Publications & Citation

If you use VessMorphoVis for your research, media design or other purposes, please cite our paper Interactive visualization and analysis of morphological skeletons of brain vasculature networks with VessMorphoVis using the following entry:

@article{abdellah2020interactive,
  title={Interactive visualization and analysis of morphological skeletons of brain vasculature 
         networks with VessMorphoVis},
  author={Abdellah, Marwan and Guerrero, Nadir Román abd Lapere, Samule and Coggan, Jay S. and 
          Coste, Benoit and Dagar, Snigdha and Keller, Daniel and Courcol, Jean-Denis and 
          Markram, Henry and Sch{\"u}rmann, Felix},
  journal={Bioinformatics},
  volume={In press},
  year={2020},
  publisher={Oxford University Press}
}

Acknowledgement & Funding

VessMorphoVis is developed by the Visualization team at the Blue Brain Project, Ecole Polytechnique Federale de Lausanne (EPFL). This study was supported by funding to the Blue Brain Project, a research center of the École polytechnique fédérale de Lausanne (EPFL), from the Swiss government’s ETH Board of the Swiss Federal Institutes of Technology.

License

VessMorphoVis is available to download and use under the GNU General Public License (GPL, or “free software”). The code is open sourced with approval from the open sourcing committee and principal coordinators of the Blue Brain Project in June 2020.

Copyright (c) 2019-2022 Blue Brain Project/EPFL

Attributions

Contact

For more information on VessMorphoVis, comments or suggestions, please contact:

Marwan Abdellah
Scientific Visualiation Expert
Visualization Team, Computing Division
Blue Brain Project
[email protected]
marwan-abdellah.com

vessmorphovis's People

Stargazers

 avatar  avatar  avatar  avatar  avatar  avatar  avatar  avatar  avatar  avatar  avatar  avatar  avatar  avatar  avatar  avatar  avatar  avatar  avatar  avatar  avatar  avatar  avatar  avatar  avatar  avatar  avatar  avatar  avatar  avatar  avatar  avatar

Watchers

 avatar  avatar  avatar  avatar  avatar  avatar  avatar  avatar

vessmorphovis's Issues

Issue: discontinuous colormap for 3D directions (angle vs. sine)

Hi Marwan,

Thanks again for adding the 3D directional color-coding feature...

I noticed some choppiness (discontinuities) in the colormap. Did you perhaps encode the angle to each axis or the sines of those angles in the colormap? I believe the sines of those angles (the 3-space components of the direction unit vector) to be the better quantity to encode because it will utilize the color-space more evenly.

Proof: a random variable uniformly distributed on the surface of the unit sphere will be uniformly distributed in three components (sine of angle from axis) independently, but will have an uneven distribution when binned by the angles.

For example, looking at this authentic in vivo anatomy:

image

Here is the histogram of segment directions binned by Z-component (quite uniform):

image

And here is the histogram of (area-weighted) section directions binned by angle from Z axis (the histogram is heavily concentrated on 0 (because a random direction is more likely to be aligned to a plane than a line).

image

Thanks,
Sam

Request of Access to Supplementary material

Hi,

Thanks for the great work and public-available software. I am particularly interested in the mesh generation. I can see most of the method details are in supplementary materials. However, it seems not able to retrieve the supplementary from the bioinformatics website. https://academic.oup.com/bioinformatics/article/36/Supplement_1/i534/5870503?login=false.

May I ask if there is anywhere else I can find the supplementary materials? Otherwise, would you mind providing a pdf file?

Thanks a lot in advance!

Feature Request: area-weighted analysis

Please include area-weighted quantities (instead of giving each point a weight of one, since this is not robust to arbitrary sampling) in network-wide analyses since, these quantities are more biologically relevant. See figure 4C from the SLAVV methods paper preprint for example area-weighted histograms.

Visualize morphologies w.r.t time

It was required by the cells and circuits team to visualize a time series of the morphology to reveal the differences in several properties like pressure, velocity or diameters, etc ...

Further Connected Section options

  • If the connectivity data is not available, simply don't add the mode to the list.
  • Add a feature to allow the users to use number of pre- and -post samples to be added from the parent and children respectively.

Rendering of isometric views of the datasets

To complete the analysis, we should integrate a way to visualize the datasets (either morphologies or meshes) with an isometric camera (orthographic camera with a 45 degree alignment) from the 3 views. The bounding box should rendered slightly to give an insight on the depth cues.

Section connectivity data.

Add a flag after loading the dataset to indicate if it has the connectivity information or not. Disable the connected sections builder if this flag is set to false.

Feature Request: directional color coding

Please add a color map option that maps vessel direction at each point (by comparing change in position between each point and one or both neighbors) to colors: [ |dx|, |dy|, |dz| ] -> [ R, G, B ] where |dx|, |dy|, |dz| are the absolute-valued difference in position with respect to trace-location along vessel section.

3D rendering

Add a new direction for rendering the datasets from a 3d camera.

Color Coding

Thank you for considering my feature request for the VessMorphoVis plugin: I would like to encode the directions of the vessels as a color (x-alignment->R,y->G,z->B). I may want to encode other attributes in color, so I would love more control over the coloring of the vessel objects. Ideally, I would love it if the last three fields of the point coordinates comprising the vessel centerline locations in the .vmv file could be interpreted as RGB values for that specific location along the vessel.

Thank you,
Pleased user of VessMorphoVis

Radii unififcation

Add a flag to allow the user to unify the radii at the branching points for better and smoother visualization.

Attempting to load any of the supplied .vmv files results in the following error

Traceback (most recent call last):
File "/Applications/Blender.app/Contents/Resources/2.80/scripts/addons/VessMorphoVis/vmv/interface/ui/io_panel.py", line 281, in execute
vmv.scene.clear_scene()
File "/Applications/Blender.app/Contents/Resources/2.80/scripts/addons/VessMorphoVis/vmv/scene/ops/scene_ops.py", line 59, in clear_scene
vmv.utilities.disable_std_output()
File "/Applications/Blender.app/Contents/Resources/2.80/scripts/addons/VessMorphoVis/vmv/utilities/std_output.py", line 39, in disable_std_output
sys.stdout = open('stdout.output', 'w')
PermissionError: [Errno 13] Permission denied: 'stdout.output'

location: :-1

Implementation of the vmvh5 format

To improve the loading and export performance of the datasets, we should implement a similar a binary like format similar to the ascii one in VMV. We can call it .vmvh5 and simply store the vertices and strands in two different datasets.

Visualize full brain morphologies with huge sizes

We recently received a dataset for the full mouse brain that has more than 5 million samples. Using polylines to visualize such a huge dataset is not applicable without commodity GPUs.
To resolve this issue and visualze the dataset, we can sample the loaded section list and visualize a subset of the morphology.

Note that the analysis will be applied on the entire dataset, while the resampled one is only used for the visual representation.

We should also add a note in the UI that we only visualze a subset of the morphology.

Implement a point cloud visualizer

The current samples builder is indeed limited for large scale visualization. It is better to implement or integrate a point cloud visualizer with OpenGL code and some transparency. This will allow us to visualize extremely large scale datasets.

Feature Request: Color coded direction (2D color space: aligned to viewing angle or the perpendicular plane)

Hi Marwan,

Thanks again for completing my other feature request for color-coding 3D direction as XYZ alignment -> RGB color sphere...

Will you please add a similar feature:

I would like again for the colors to represent alignment, but I would like a 2 Dimensional colormap, where one end of the spectrum represents alignment to the viewing angle of the camera, while the other end represents alignment to the plane perpendicular to that axis.

This feature would be nice because it will reduce the number of colors needed to deliver the information, and will still encode the most important directional information (direction in the image plane can be seen without the aid of color-coding).

If it is too hard to change color dynamically to the viewing angle, then we could allow the user to input the (3D spherical) angles, or choose an axis (e.g. Z axis)?

Thank you,
Sam

Feature Request: logarithmic bin limits for color-coding

Please allow for the color bin limits (for color-coding radius, length, area, etc.) to be logarithmically distributed. (Currently linearly distributed. I believe logarithmic should be the default, but having the option would be helpful too. Thank you.

Color interpolation function

To minimize the dependencies, we would like to integrate a function to interpolate colors for a certain range given three colors only.

Analysis of directional components

Further analysis is required to analysis to the total length of the different components in the morphologies along the XYZ coordinates to complement the color-code visual analysis.

Gallery

We must add a gallery for some of the images that are created with VessMorphoVis.

Recommend Projects

  • React photo React

    A declarative, efficient, and flexible JavaScript library for building user interfaces.

  • Vue.js photo Vue.js

    🖖 Vue.js is a progressive, incrementally-adoptable JavaScript framework for building UI on the web.

  • Typescript photo Typescript

    TypeScript is a superset of JavaScript that compiles to clean JavaScript output.

  • TensorFlow photo TensorFlow

    An Open Source Machine Learning Framework for Everyone

  • Django photo Django

    The Web framework for perfectionists with deadlines.

  • D3 photo D3

    Bring data to life with SVG, Canvas and HTML. 📊📈🎉

Recommend Topics

  • javascript

    JavaScript (JS) is a lightweight interpreted programming language with first-class functions.

  • web

    Some thing interesting about web. New door for the world.

  • server

    A server is a program made to process requests and deliver data to clients.

  • Machine learning

    Machine learning is a way of modeling and interpreting data that allows a piece of software to respond intelligently.

  • Game

    Some thing interesting about game, make everyone happy.

Recommend Org

  • Facebook photo Facebook

    We are working to build community through open source technology. NB: members must have two-factor auth.

  • Microsoft photo Microsoft

    Open source projects and samples from Microsoft.

  • Google photo Google

    Google ❤️ Open Source for everyone.

  • D3 photo D3

    Data-Driven Documents codes.