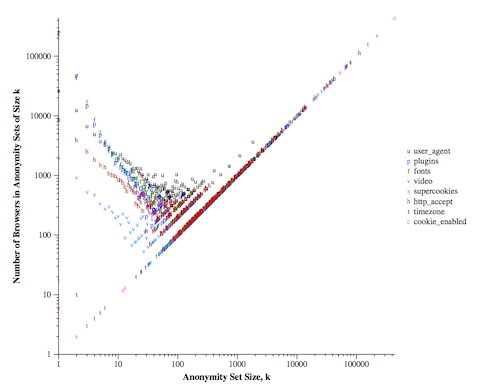
The idea originates from the question how to visualize what is happening with attributes in your data: how unique are the entities in your data. The only visualization that I am aware of is Fig. 3 in the Panopticlick experiment, which shows anonymity set sizes created by each value of each attribute:
While this is a nice figure, it is quite hard to understand it quantitatively, and it can be even more complicated if you want to compare different datasets by using this visualization method. However, it would be nice to understand the state of uniqueness in datasets, especially if you consider different attributes in each case, apply anonymization or other countermeasures to decrease uniqueness.
This is what kmap was created for.
There are two use-cases of kmap based on what we provide to it:
- if we provide attribute classes of a complete dataset,
- or if we provide anonymity sets that we have calculated.
In the first case, kmap calculates anonymity sets. In the second case, it is assumed, that the provided anonymity sets are not partitioning the dataset. For example, lets consider that we create a fingerprints for each users: a fingerprint is a set of attributes selected differently per user that identify them the most. However, there might be similar users, where most attributes are the same, thus fingerprinting will result in anonymity sets instead of characterizing a single user.
In the examples below we use the UCI Adult Data Set as a toy dataset.
The input for kmap is a list of attributes, preferebly in an indexed fashion (to be faster). Like assume that we consider type of residences as
attribute_dictionary = {
	("residence=urban", "age=0-21"): 0,
	("residence=urban", "age=22-49"): 1,
	("residence=urban", "age=50+"): 2,
	("residence=rural", "age=0-21"): 3,
	...
}
so we would have a list characterizing our dataset as
data = [1, 0, 0, 1, 2, 3, ...]This list of attributes can be provided to kmap, which will calculate anonymity sets and make the plot based on that.
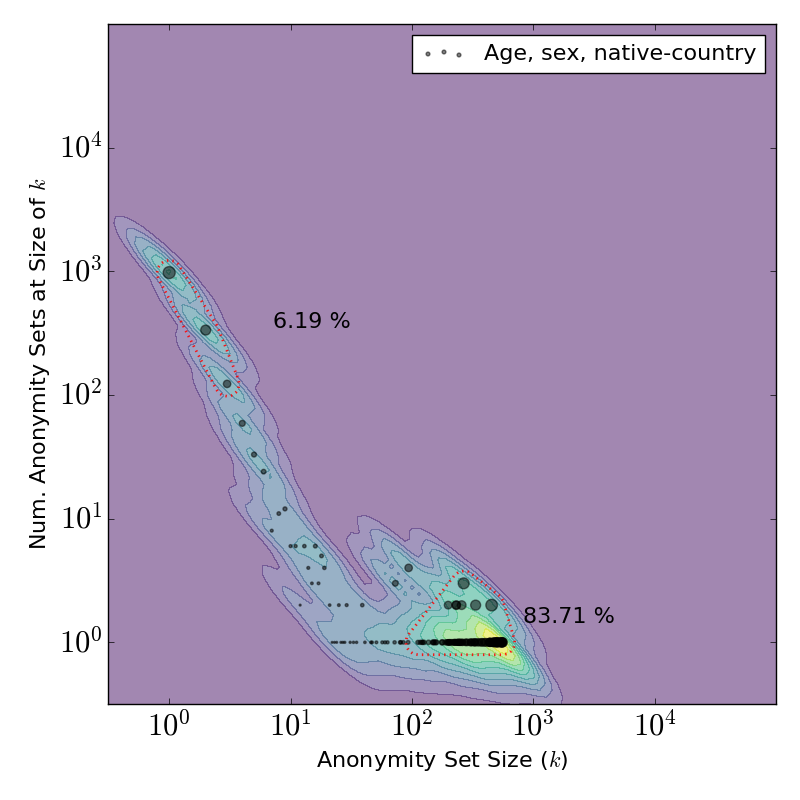
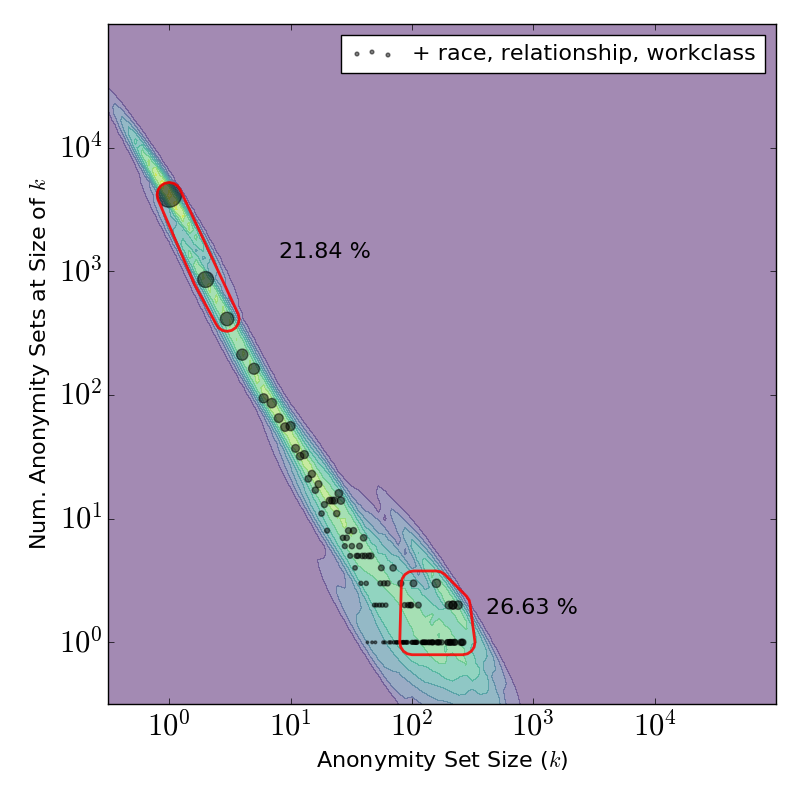
This will result in something like this:
| 3 attributes released | 6 attributes released | 9 attributes released |
|---|---|---|
 |
 |
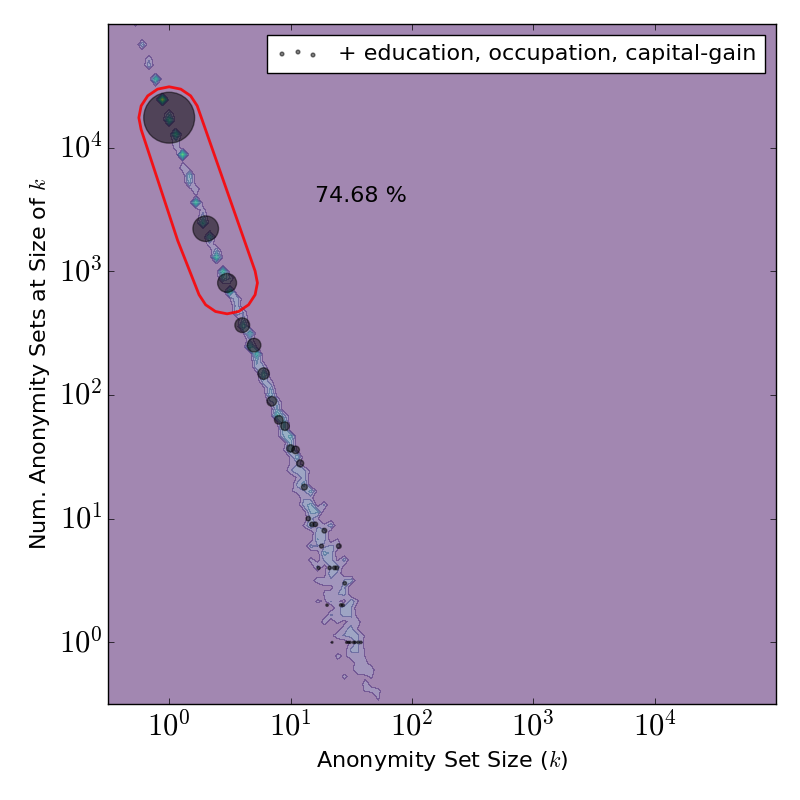 |
Here you can see that how anonymity sets change when we release the Adult Dataset with 3, 6 or 9 attributes.
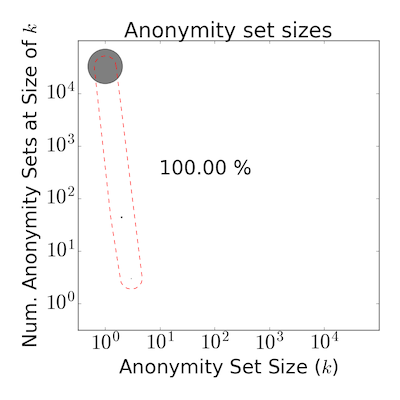
We can also calculate a fingerprints for each user, then check what is the user or anonymity set selected by each fingerprint. In this case we have to provide a dictionary where keys are anonymity set sizes, values are the frequency of such sets, like
data = {1: 32514, 2: 44, 3: 3, ...}After providing this input, kmap will output something like this:
Basically there is a single mandatory parameter and there are a lot of optional ones. By default this is how kmap should be called:
from kmap import plot_kmap
# Note: you should also have matplotlib installed

# First type of use: anonymity sets partition data
data = [1, 0, 0, 1, 2, 3, ...]
plot_kmap(data=data)

# Second type of use: anonymity sets created by something else, like fingerprints
data = {1: 32514, 2: 44, 3: 3, ...}
plot_kmap(data=[sum(data.values()), data], data_raw=False)
The optional parameters are the following:
plot_kmap(data,
	data_raw=True,				# Whether the data is a list of attributes or already a dict
	as_partitions=None,			# If the anonymity sets partitioning the data or not
						# 	(leaving it None will lead to default behavior
						#	regarding if it has to work with raw data or not)
	filename = "",				# Output file path. If only filename provided with
						#	no extension is provided

	# Legend
	plot_legend = False,			# Add a legend (or not)
	data_label = "",			# Label of the data points (to scatter plot)

	# Plot titles and other properties
	title = None,				# Plot title
	title_loc = "center",			# Plot title location
	titlelabelsize = 26,			# Plot title text size
	axlabelsize = 22,			# Axes label sizes
	textsize = 16,				# General text size, e.g., used in legend, contour
	annotationsize = 13,			# Annotation text size

	# Scatter plot properties
	plot_scatter = True,			# On/off
	scatter_ms = None,			# Marker size (use None for dynamic sizing proportionally to anonymity set size)
	scatter_c = 'k',			# Scatter marker color
	scatter_a = .5,				# Scatter marker alpha
	scatter_m = r'.',			# Scatter marker shape

	# Whether add a heatmap to the background
	plot_heatmap=True,			# On/off
	colormap=plt.cm.Greys,			# Colormap

	# Contour (alone or with heathmap)
	plot_contour=False,			# On/off
	plot_contour_lbls=False	,		# With labels (values on contour lines)

	# Plot annotation parameters
	plot_annotation = True,			# Highlight some anonymity sets and show their size;
						#	this should be a list, as [[1, 3], [10, 100]] to highlight
						#	anonymity sets between size 1 and 3, 10 and 100
	annotation_params = None,		# Annotation style parameters, e.g.:
						#	dict(radius=[.2, .5], distance=[.6, .25], linestyle=dict(color='r', width=1, style='--'), location=['right', 'top'])
	tail_threshold = None,			# A line as annotation

	# Misc
	max_val_exp = 5				# Axes exponent (change it with _caution_)

)- I got the error of
ImportError: No module named Tkinter.
Right after the import of matplotlib add matplotlib.use('Agg') (this will change the backend matplotlib tries to use), e.g.:
import matplotlib
matplotlib.use('Agg')
Please cite the first paper where kmap was used:
Gabor Gyorgy Gulyas, Gergely Acs, Claude Castelluccia: Near-Optimal Fingerprinting with Constraints. Proceedings on Privacy Enhancing Technologies. Volume 2016, Issue 4, Pages 470–487, ISSN (Online) 2299-0984, DOI: 10.1515/popets-2016-0051, July 2016
Available online here.
Thank you.
Please let me know, if you use kmap, or know further uses than listed here. It would be great to have feedback on this and see how use it! Thanks.
Gabor Gyorgy Gulyas, Gergely Acs, Claude Castelluccia: Near-Optimal Fingerprinting with Constraints. Proceedings on Privacy Enhancing Technologies. Volume 2016, Issue 4, Pages 470–487, ISSN (Online) 2299-0984, DOI: 10.1515/popets-2016-0051, July 2016
Repository: https://github.com/gaborgulyas/constrainted_fingerprinting

