Giter VIP home page Giter VIP logo

planner's Introduction

Planner

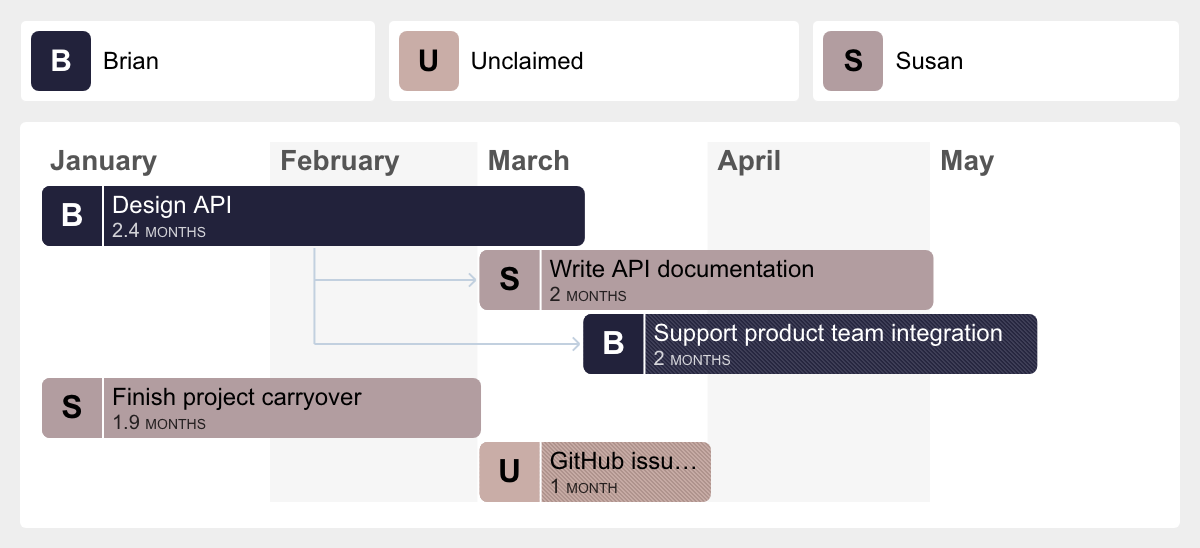
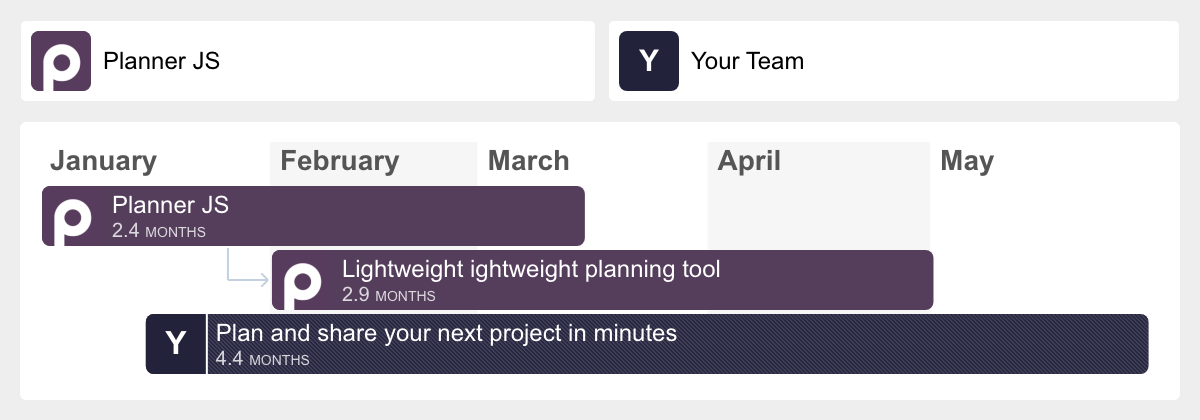
Lightweight, interactive planning tool that visualizes a series of tasks using an HTML canvas.


Planner JS meta-image

Try it yourself at plannerjs.dev

Plans created with Planner are automatically saved to the URL and can be easily shared with others.

If you like this project β˜•οΈ buy me a cup of coffee at patreon.com/bvaughn πŸ˜ƒ


Examples

Planner screenshot

Planner screenshot

Planner screenshot

Planner screenshot


Converting legacy plans

Planner switched from jsurl2 to Base64 encoding due to URL parsing problems jsurl2 caused websites like Twitter. If you created a plan with using the old jsurl2 encoding, you can migrate to the new format at the URL below:

https://plannerjs.dev/api/convert?(your-data-here)

planner's People

Contributors

andrewingram avatar bvaughn avatar clauderic avatar dependabot[bot] avatar pavelfeldman avatar

Stargazers

 avatar  avatar  avatar  avatar  avatar  avatar  avatar  avatar  avatar  avatar  avatar  avatar  avatar  avatar  avatar  avatar  avatar  avatar  avatar  avatar  avatar  avatar  avatar  avatar  avatar  avatar  avatar  avatar  avatar  avatar  avatar  avatar  avatar  avatar  avatar  avatar  avatar  avatar  avatar  avatar  avatar  avatar  avatar  avatar  avatar  avatar  avatar  avatar  avatar  avatar  avatar  avatar  avatar  avatar  avatar  avatar  avatar  avatar  avatar  avatar  avatar  avatar  avatar  avatar  avatar  avatar  avatar  avatar  avatar  avatar  avatar  avatar  avatar  avatar  avatar  avatar  avatar  avatar  avatar  avatar  avatar  avatar  avatar  avatar  avatar  avatar  avatar  avatar  avatar  avatar  avatar  avatar  avatar  avatar  avatar  avatar  avatar  avatar  avatar  avatar

Watchers

 avatar  avatar  avatar  avatar  avatar

planner's Issues

Team metadata should support β€œcolor”

Colors are auto-generated based on the owner’s name (string). This is nice because it’s lightweight, but we should allow overriding the default via the team config object.

Planner (canvas) should support max-height and panning

Currently, a Planner chart grows as needed to show all of the rows. This works well for small plans but large ones can get very tall (taller than the viewport). We should support a max-height prop and vertical panning for the overflow.

Redesign ongoing task type

Ongoing tasks are currently shown as a semi-transparent bar with small chunks filled in:
Screenshot 2022-01-04 at 11 35 34 PM

The idea was to demonstrate that there's some rough amount of work (the combined size of the solid chunks) but that it was spread throughout the remainder of the plan.

I don't think the visualization works that well though. For that matter, I don't think that using the input stop date to infer how big the chunks should be works that well either. Conceptually, an ongoing task might not run until the end of the plan.

I propose changing this type to remove the concept of "duration" (the solid chunks) and instead just render a striped line that respects the stop date. This can indicate an ongoing task that's a fuzzy level of effort. (If a more solid level of effort is required, arguably, the task should be defined as several regular tasks and slotted in somewhere.

Render Timeline with Variable Timescales

Includes need for in-data length units, which I wish were named durations. I'd be happy to take a hack at this. Should be able to support data inputs like:

createTask({
  id: "mile",
  name: "Bar",
  month: 2,
  length: 3d,
  dependency: "m-dep",
  owner: "susan",
});
createTask({
  name: "Foo",
  month: 2,
  length: 1w,
  isOngoing: true,
  owner: "team",
});
createTask({
  name: "Baz",
  month: 2,
  length: 3m,
  isOngoing: true,
  owner: "team",
});

Wrong calculation of `chunkWidth` for ongoing tasks

There's a slight overflow happening in case of ongoing tasks (reproducible in the dummy initial data itself)
Screenshot 2022-01-04 at 11 35 34 PM

I was looking at the implementation and was wondering the possible reason for chunkWidth as follows

const chunkWidth =
      (task.duration * unitWidth) / (MONTHS.length - task.start);

If we change the denominator to 4 then it starts fitting perfectly.

const chunkWidth = (task.duration * unitWidth) / (4);

I was also wondering why you had added Math.min check while drawing the rect. Is it to account for the fact that last month's width may not be equal to unitWidth because we do Math.floor in determining unitWidth?

I was also looking at the implementation and found the sorting logic a little complicated to follow along. Instead of looping through all the tasks for a dependent task and then sorting them in-place via splicing (mutating props too), can't we use the following logic:

1. Loop through all the tasks and maintain `idToTaskMap` and `dependenciesMap`.
2. Initialise a new empty array called `sortedTasks`.
3. Filter out all the parent level tasks out of all tasks and then for each of those parent task, push the parent task itself in the `sortedTasks` first and then  if `dependenciesMap.get(task)?.length` then put all the dependent tasks in `sortedTasks` after sorting them.

In code it would translate to something like this:

    const sortedTasks = [];

    const dependenciesMap = new Map();
    const idToTaskMap = new Map();

    tasks.forEach((task) => {
      idToTaskMap.set(task.id, task);

      if (task.dependency != null) {
        const dependencyId = task.dependency;
        const dependency = idToTaskMap.get(dependencyId);

        if (dependency == null) {
          console.warn(
            `Invalid dependency; no parent task found with id ${dependencyId}`
          );
        } else {
          if (!dependenciesMap.has(dependency)) {
            dependenciesMap.set(dependency, []);
          }
          dependenciesMap.get(dependency).push(idToTaskMap.get(task.id));
        }
      }
    });

    tasks
      .filter((task) => !task.dependency)
      .forEach((task) => {
        sortedTasks.push(task);
        const dependentTasks = dependenciesMap.get(task);
        if (dependentTasks?.length) {
          const sortedDependentTasks = [...dependentTasks].sort((a, b) => {
            if (a.start < b.start) return -1;
            if (a.start === b.start) {
              if (a.duration < b.duration) return -1;
              if (!a.isOngoing && b.isOngoing) return -1;
            }
            return 1;
          });
          sortedTasks.push(...sortedDependentTasks);
        }
      }, []);

Will be happy to open a PR incorporating either or both of the changes as per your suggestions. Thanks in advance!

little error

Hi bro, that's great ❀
i try to added new team metadata, when i changed the "name", i saw a error

Screenshot (68)

i think it can be fix with "?." operator

src/utils/color.js => line 2

export function hexToRgb(hex) {
  if (hex?.length === 4) {

Text clipping bug

Needs to take width of avatar (including text only circle) into account

Awsome little example!

Appreciate you making this public. Good to see how you guys build React apps (from the view of the rest of us). Took me a minute to realize that "loosing focus" updates the data when I type in changes. No need (IMHO) to fix, but might be helpful to add a text note to that behavior.

Generate os:image from chart data

It seems like Planner can generate plan-specific og:image images dynamically by rendering a Canvas on the server and then capturing a screenshot (using Puppeteer or Playwright) and returning that. Some related tweet threads:

Vercel's og-image repo might also be a nice starting point to fork:
https://github.com/vercel/og-image

This would be a nice upgrade from the current behavior which is to just return the following hard-coded og:image:

Planner JS meta-image

Bad readme link URL

The URL on the View days example in the readme points to localhost.

Nice library, thanks !

Planner should support color keywords, not just hex

Example

Assigning a CSS color keyword like black instead of #000000 to color throws error:

Screen Shot 2022-02-03 at 1 21 20 PM

Expected Behavior

  1. If color's value doesn't begin with a #, compare it to a dictionary of CSS colors.
  2. If not in the dictionary, either throw error or use "transparent" (your choice).
  3. If in the dictionary, use that keyword for the color.

Planner should have way to view very long timelines

Example

When planning shorter duration efforts over longer time periods (think weeks in months), the bars get condensed to the point of not being legible at a glance:

Screen Shot 2022-02-03 at 1 39 39 PM

Expected behavior

It would be useful to see a monthly or weekly view with a "map" of the greater whole to one side.

Mural has a feature like this, as an example of what I'm describing:

Screen Shot 2022-02-03 at 1 44 39 PM

Fix avatar URLs

Seems like "next/image" is doing something funky to external image URLs.

Example data set:
https://plannerjs.dev/?data=eyJ0YXNrcyI6W10sInRlYW0iOnsiYnJpYW4iOnsiYXZhdGFyIjoiaHR0cHM6Ly9hdmF0YXJzLmdpdGh1YnVzZXJjb250ZW50LmNvbS91LzI5NTk3IiwibmFtZSI6IkJyaWFuIn19fQ==

Based on the data, the image that should be requested is:

https://avatars.githubusercontent.com/u/29597

But the URL that's actually requested is:

https://plannerjs.dev/_next/image?url=https%3A%2F%2Favatars.githubusercontent.com%2Fu%2F29597&w=32&q=75

Recommend Projects

  • React photo React

    A declarative, efficient, and flexible JavaScript library for building user interfaces.

  • Vue.js photo Vue.js

    πŸ–– Vue.js is a progressive, incrementally-adoptable JavaScript framework for building UI on the web.

  • Typescript photo Typescript

    TypeScript is a superset of JavaScript that compiles to clean JavaScript output.

  • TensorFlow photo TensorFlow

    An Open Source Machine Learning Framework for Everyone

  • Django photo Django

    The Web framework for perfectionists with deadlines.

  • D3 photo D3

    Bring data to life with SVG, Canvas and HTML. πŸ“ŠπŸ“ˆπŸŽ‰

Recommend Topics

  • javascript

    JavaScript (JS) is a lightweight interpreted programming language with first-class functions.

  • web

    Some thing interesting about web. New door for the world.

  • server

    A server is a program made to process requests and deliver data to clients.

  • Machine learning

    Machine learning is a way of modeling and interpreting data that allows a piece of software to respond intelligently.

  • Game

    Some thing interesting about game, make everyone happy.

Recommend Org

  • Facebook photo Facebook

    We are working to build community through open source technology. NB: members must have two-factor auth.

  • Microsoft photo Microsoft

    Open source projects and samples from Microsoft.

  • Google photo Google

    Google ❀️ Open Source for everyone.

  • D3 photo D3

    Data-Driven Documents codes.