Giter VIP home page Giter VIP logo

lineup_app's Introduction

Caleydo - Visualization for Molecular Biology

Build Status

Caleydo is a visualization framework for molecular biology data. It is targeted at analyzing multiple heterogeneous but related tabular datasets (e.g., mRNA expression, copy number status and clinical variables), stratifications or clusters in these datasets and their relationships to biological pathways.

For user documentation please refer to the Caleydo Help. For general information and downloads based on binaries please use the Caleydo Website. This guide assumes that you want to install Caleydo from source.

Installation

Caleydo uses Java, OpenGL and the Eclipse Rich Client Platform (RCP). Things you need to install before being able to run Caleydo:

  • Eclipse Kepler for RCP and RAP Developers, which you can get from the eclipse download page. Other Eclipse versions won't work.
  • Install EGit in Eclipse using software updates.
  • Java SDK >= 1.7

To install Caleydo use EGit within Eclipse and clone the repository. Each directory in the caleydo-dev folder corresponds to an Eclipse project. Here is a good tutorial on how to import Eclipse projects from git.

If you want to use ssh (instead of https) for communicating with github out of eclipse follow these instructions. You will have to generate a new RSA key and save it to you ~/.ssh folder. Remeber to set a passphrase for you key. This will result in a file ida_rsa and ida_rsa.pub turning up in your ssh folder. Save your public rsa key with your eclipse account folder.

When cloning the repository follow the above tutorial. Don't change the username "git" to your username!

Team

Caleydo is an academic project currently developed by members of

Acknowledgements

Caleydo makes use of a range of open source tools, bioinformatics resources and pre-packages several datasets, which we gratefully acknowledge here.

Software Libraries

  • Bubble Sets - A Java implementation of the visualization technique.
  • CDK - The Chemistry Development Kit.
  • JGrahT - A graph library.
  • Jogl - Java bindings for OpenGL.
  • PathVisio - loading and parsing WikiPathways.
  • WordHoard - statistical utilities.

Bioinformatics Resources

Datasets

  • CCLE - BROAD Institute Cancer Cell Line Encyclopedia.
  • TCGA - The Cancer Genome Atlas.

Resources

  • GitHub - Hosting our source code.
  • WebStorm - Free developer licenses for our web projects from JetBrains.

lineup_app's People

Contributors

keckelt avatar sgratzl avatar

Watchers

 avatar  avatar  avatar  avatar

lineup_app's Issues

Prune visualization options for Taggle paper demo

Categorical

  • Item vis: remove Table, Heatmap
  • Group vis: remove None, Table, Heatmap
  • Summary vis: remove Table

image

Numerical

  • Item vis: --
  • Group vis: remove None
  • Summary vis: remove None

image

String

  • Item vis: remove Default, Image, Link
  • Group vis: remove None and Link, rename Default to Samples
  • Summary vis: remove Default

image

Matrix

  • Item vis: remove Bar chart, Bar table, Histogram, Table
  • Group vis: remove None and Table, increase opacity for sparklines
  • Summary vis: remove Bar table, Heatmap, Table

image

Error: Property 'setSplicer' does not exist on type 'MatrixColumn'

  • Release number or git hash: 1fed925
  • Web browser version and OS: Chrome 72

Steps to reproduce

  1. Compile Taggle demo with LineUp latest commit lineupjs/lineupjs@149a333

Observed behavior

See compile error at https://app.netlify.com/sites/caleydo-taggle-user-study/deploys/5c2cecebbd7a5b000af4c0b5

ERROR in D:/dev/repos/caleydo/lineup_app/src/model/MatrixColumn.ts(49,12):
TS2339: Property 'setSplicer' does not exist on type 'MatrixColumn'.

Expected behavior

  • Compile without errors

Wrong overview with multiple aggregated groups

Steps to reproduce

  1. Stratify a categorical column
  2. Aggregate groups
  3. Switch to overview

taggle-fusion-aggregated-groups

Observed behavior

  • Only the first group is visible the others are gone

Expected behavior

  • All aggregated groups should be visible

Error when collapsing a mixed group

Steps to reproduce

  1. Stratify a categorical column
  2. Switch to overview
  3. Select expand region with first row (to get the collapse arrow)
  4. Try to collapse the group

image

Observed behavior

image

Uncaught TypeError: Cannot read property '1' of undefined
    at LineUpJS.js:62
    at Array.forEach (<anonymous>)
    at LineUpJS.js:62
    at Array.forEach (<anonymous>)
    at t.renderColumns (LineUpJS.js:62)
    at t.update (LineUpJS.js:62)
    at e.update (LineUpJS.js:62)
    at Object.<anonymous> (LineUpJS.js:62)
    at o.apply (LineUpJS.js:62)
    at e.a (LineUpJS.js:43)

Expected behavior

  • No error when collapsing

Column texture renderer

  • User switches to the texture overview (#4)
  • current rows (from detail mode) must be hidden
  • Render a texture of all rows as image
  • Place this texture image to column

Aggregated matrix visualizations not scaling after matrix split

Aggregated matrix visualizations are not scaling properly after matrix is split into groups. They seem to retain the width of the original matrix in each column, thus causing overlaps with other columns. Watch the summary row for Africa:
matrix

Steps to reproduce:

  1. Group by categorical attribute
  2. Split matrix

Observed for heatmap, sparklines and boxplots.
Dots seem to be ok, but maybe it's just not visible, because of the shape of the plot.
Histogram doesn't show up at all. Not sure if that's bug or data is too small.

Switch column type after import

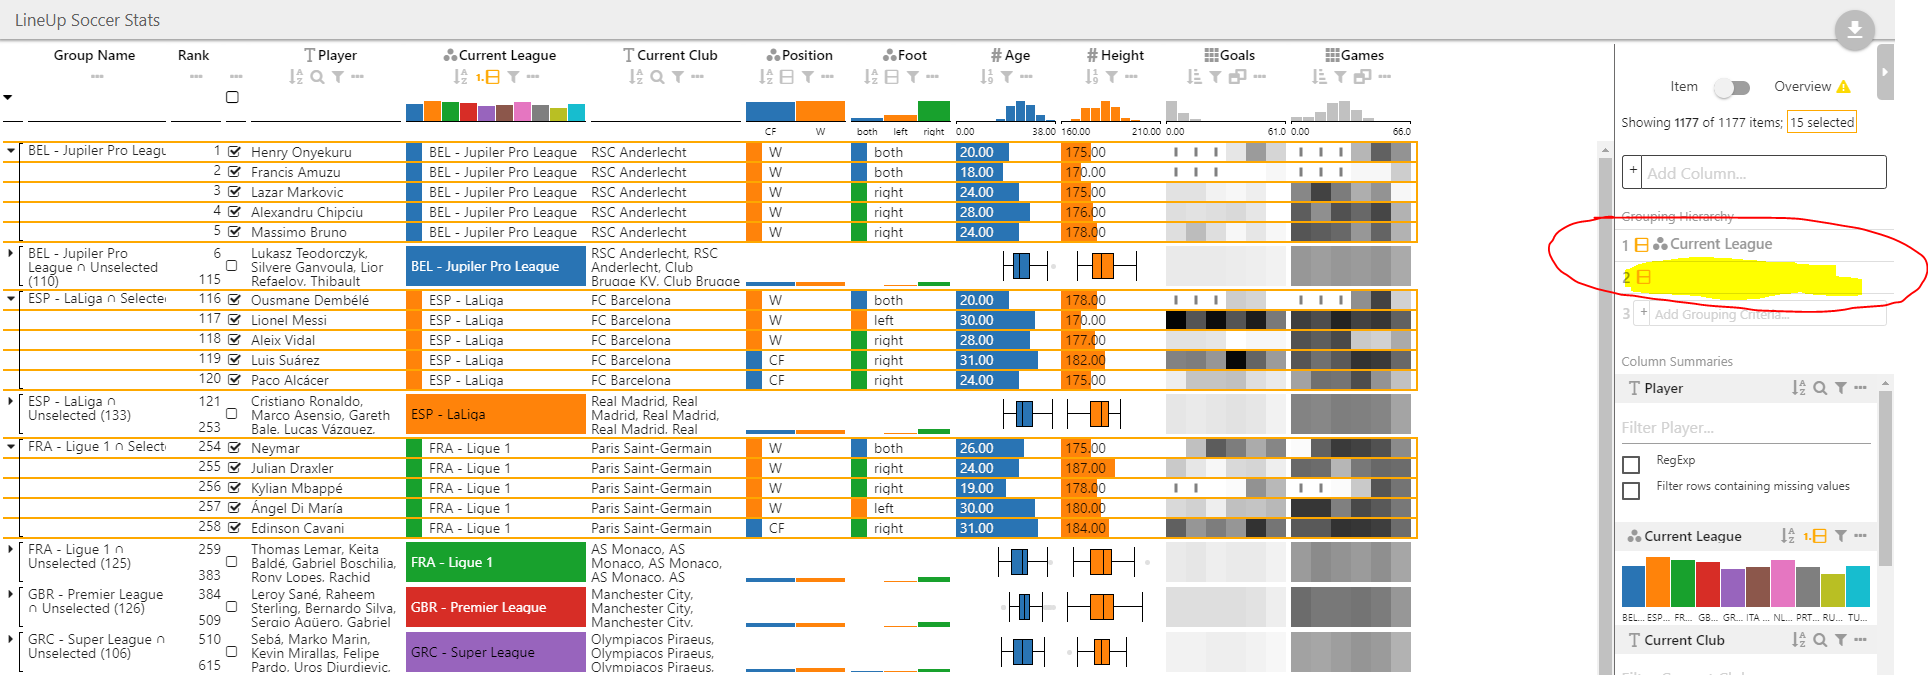
At the moment the user chooses the column type in the import dialog. When we import data directly we have to allow the user to switch column types after import (e.g., if categorical is a string, etc.).
This should be done on click on the visual marker (see Caleydo/lineup#25).

Overview is not space-filling with aggregated groups

Steps to reproduce

  1. Stratify a categorical column
  2. Aggregate one group
  3. Switch to overview

taggle-fusion-non-space-filling

Observed behavior

  • The textures of the remaining columns are too short

Expected behavior

  • The overview should be space-filling

Grouping results in maximum call stack size exceeded for ranking with matrix column

Steps to reproduce

  1. Open https://taggle.caleydoapp.org/#aids
  2. Group by any categorical or numerical column

Observed behavior

  • The ranking is empty and does not show any rows
    grafik
  • The developer console shows the following error:
    grafik

Running it locally shows the reference to interable.js.LazyMap1.mapV:

Uncaught RangeError: Maximum call stack size exceeded
    at LazyMap3../node_modules/lineupjs/src/internal/interable.js.LazyMap1.mapV [as map12] (interable.js:336)
    at LazyMap3../node_modules/lineupjs/src/internal/interable.js.LazyMap1.mapV [as map12] (interable.js:337)
    at LazyMap3../node_modules/lineupjs/src/internal/interable.js.LazyMap1.mapV [as map12] (interable.js:337)
    at LazyMap3../node_modules/lineupjs/src/internal/interable.js.LazyMap1.mapV [as map12] (interable.js:337)
    at LazyMap3../node_modules/lineupjs/src/internal/interable.js.LazyMap1.mapV [as map12] (interable.js:337)
    at LazyMap3../node_modules/lineupjs/src/internal/interable.js.LazyMap1.mapV [as map12] (interable.js:337)
    at LazyMap3../node_modules/lineupjs/src/internal/interable.js.LazyMap1.mapV [as map12] (interable.js:337)
    at LazyMap3../node_modules/lineupjs/src/internal/interable.js.LazyMap1.mapV [as map12] (interable.js:337)
    at LazyMap3../node_modules/lineupjs/src/internal/interable.js.LazyMap1.mapV [as map12] (interable.js:337)
    at LazyMap3../node_modules/lineupjs/src/internal/interable.js.LazyMap1.mapV [as map12] (interable.js:337)

Expected behavior

  • The grouping should work for rankings with MatrixColumns

Recommend Projects

  • React photo React

    A declarative, efficient, and flexible JavaScript library for building user interfaces.

  • Vue.js photo Vue.js

    ๐Ÿ–– Vue.js is a progressive, incrementally-adoptable JavaScript framework for building UI on the web.

  • Typescript photo Typescript

    TypeScript is a superset of JavaScript that compiles to clean JavaScript output.

  • TensorFlow photo TensorFlow

    An Open Source Machine Learning Framework for Everyone

  • Django photo Django

    The Web framework for perfectionists with deadlines.

  • D3 photo D3

    Bring data to life with SVG, Canvas and HTML. ๐Ÿ“Š๐Ÿ“ˆ๐ŸŽ‰

Recommend Topics

  • javascript

    JavaScript (JS) is a lightweight interpreted programming language with first-class functions.

  • web

    Some thing interesting about web. New door for the world.

  • server

    A server is a program made to process requests and deliver data to clients.

  • Machine learning

    Machine learning is a way of modeling and interpreting data that allows a piece of software to respond intelligently.

  • Game

    Some thing interesting about game, make everyone happy.

Recommend Org

  • Facebook photo Facebook

    We are working to build community through open source technology. NB: members must have two-factor auth.

  • Microsoft photo Microsoft

    Open source projects and samples from Microsoft.

  • Google photo Google

    Google โค๏ธ Open Source for everyone.

  • D3 photo D3

    Data-Driven Documents codes.