Giter VIP home page Giter VIP logo

chartbrew / chartbrew Goto Github PK

View Code? Open in Web Editor NEW
2.3K 2.3K 281.0 52.75 MB

Open-source web platform used to create live reporting dashboards from APIs, MongoDB, Firestore, MySQL, PostgreSQL, and more πŸ“ˆπŸ“Š

Home Page: https://chartbrew.com

License: MIT License

JavaScript 98.87% HTML 0.10% CSS 0.19% Dockerfile 0.01% Shell 0.03% EJS 0.79% Stylus 0.01%
analytics api chartjs charts dashboard data-visualization firebase firebase-firestore firestore mongo mongodb mysql nodejs postgresql react reactjs realtime-database redux

chartbrew's Introduction

ChartBrew logo

ChartBrew build

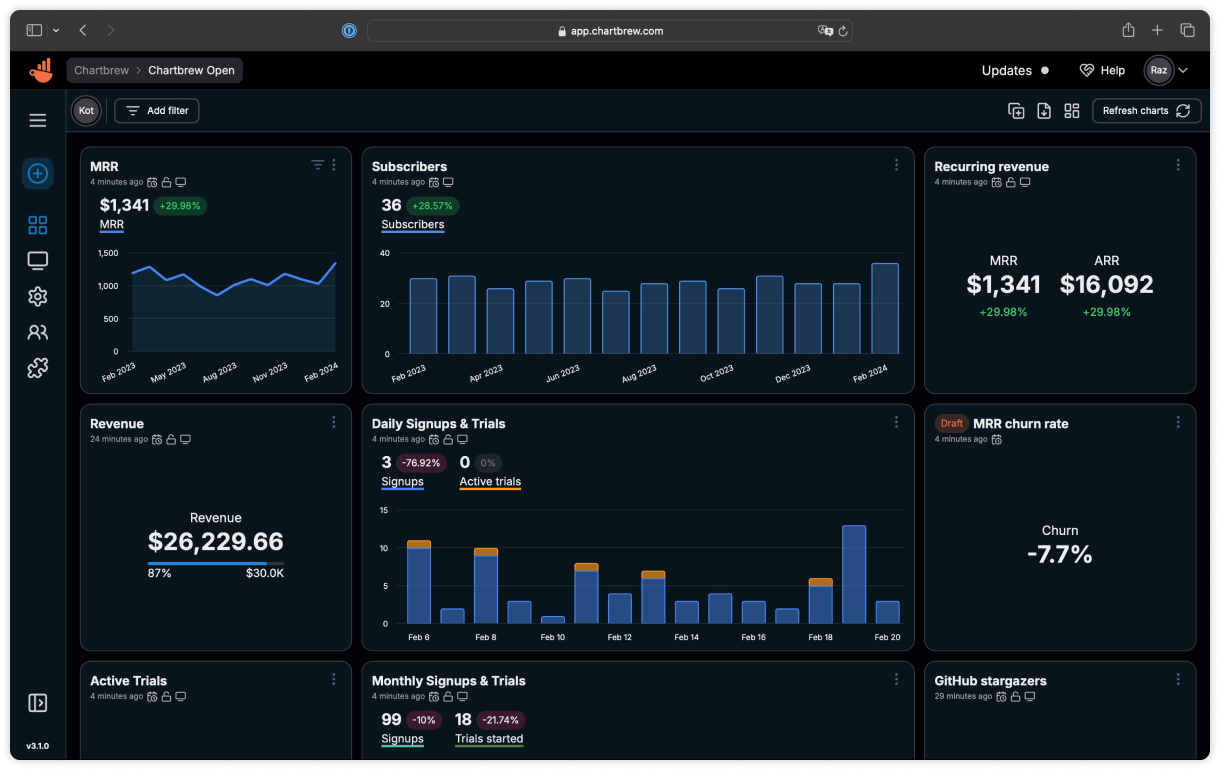
Chartbrew is an open-source web application that can connect directly to databases and APIs and use the data to create beautiful charts. It features a chart builder, editable dashboards, embedable charts, query & requests editor, and team capabilities.

Chartbrew as a service is available here


ChartBrew dashboard


πŸ“š Read the full docs here

πŸ’‘ Have any ideas or discussion topics?

πŸ’¬ Join our Discord

Data sources

Check Chartbrew's website for the latest list of supported data sources

Prerequisites

  • NodeJS v20
  • MySQL (5+) or PostgreSQL (12.5+)

Start

It is recommended you head over to the more detailed documentation to find out how to set up Chartbrew

πŸ“š You can find it here

Set up Chartbrew locally

Create a new database

Chartbrew can run on MySQL or PostgreSQL. Create an empty database that Chartbrew can use.

Clone and setup

git clone https://github.com/chartbrew/chartbrew.git
cd chartbrew && npm run setup

Complete the required environmental variables in chartbrew/.env. Check out which need to be set here.

Run the project in Development

Open two terminals, one for front-end and the other for back-end.

# frontend
cd client/
npm run start

# backend
cd server/
npm run start-dev

Head over to http://localhost:4018 to see the app running and create your first user account.

Deploy Chartbrew on Render

Deploy to Render

Deploy Chartbrew on Heroku and Vercel

Read more on how to do this here

Run with Docker

Check the full guide in the docs.

Quickstart

A Chartbrew docker image is built whenever a new version is released.

Before running the commands below, make sure you have a MySQL server already running and an empty database that Chartbrew can use. The database name should match the value of the CB_DB_NAME variable.

You will need a 32 bytes AES encryption key for the CB_ENCRYPTION_KEY variable. Run the following command to generate one:

node -e "console.log(require('crypto').randomBytes(32).toString('hex'))"
docker pull razvanilin/chartbrew

docker run -p 4019:4019 -p 4018:4018 \
  -e CB_ENCRYPTION_KEY=your_32_bytes_key \
  -e CB_API_HOST=0.0.0.0 \
  -e CB_API_PORT=4019 \
  -e CB_DB_HOST=host.docker.internal \
  -e CB_DB_PORT=3306 \
  -e CB_DB_NAME=chartbrew \
  -e CB_DB_USERNAME=root \
  -e CB_DB_PASSWORD=password \
  -e VITE_APP_CLIENT_HOST=http://localhost:4018 \
  -e VITE_APP_CLIENT_PORT=4018 \
  -e VITE_APP_API_HOST=http://localhost:4019 \
  razvanilin/chartbrew

Acknowledgements

Many thanks to everybody that contributed to this open-source project πŸ™

Start here if you want to become a contributor

chartbrew's People

Contributors

ashish979 avatar dependabot[bot] avatar devcer avatar devinekadeni avatar expatiating avatar gkydev avatar jscastanos avatar kiura avatar kotchaniphapk avatar matthosch avatar mobilpadde avatar ozgunbal avatar razvanilin avatar theaccordance avatar victor21813 avatar visualfanatic avatar warisanwar avatar wesdobry avatar

Stargazers

 avatar  avatar  avatar  avatar  avatar  avatar  avatar  avatar  avatar  avatar  avatar  avatar  avatar  avatar  avatar  avatar  avatar  avatar  avatar  avatar  avatar  avatar  avatar  avatar  avatar  avatar  avatar  avatar  avatar  avatar  avatar  avatar  avatar  avatar  avatar  avatar  avatar  avatar  avatar  avatar  avatar  avatar  avatar  avatar  avatar  avatar  avatar  avatar  avatar  avatar  avatar  avatar  avatar  avatar  avatar  avatar  avatar  avatar  avatar  avatar  avatar  avatar  avatar  avatar  avatar  avatar  avatar  avatar  avatar  avatar  avatar  avatar  avatar  avatar  avatar  avatar  avatar  avatar  avatar  avatar  avatar  avatar  avatar  avatar  avatar  avatar  avatar  avatar  avatar  avatar  avatar  avatar  avatar  avatar  avatar  avatar  avatar  avatar  avatar  avatar

Watchers

 avatar  avatar  avatar  avatar  avatar  avatar  avatar  avatar  avatar  avatar  avatar  avatar  avatar  avatar  avatar  avatar  avatar  avatar  avatar  avatar  avatar  avatar  avatar  avatar

chartbrew's Issues

The "Enable global headers" option gets reversed if changed in any way from the interface

How to reproduce

  • Ensure there is an API connection with global headers already saved in your Chartbrew project
  • Create new chart and prepare your API request in the API request builder
  • Before clicking next untick global headers > press send > tick the global headers again > press send > press next now
  • Configure the dataset in the next step and you will get an error if the request needs the global headers to run
  • Go back to the API request builder to find the global headers ticked but hiding the headers (acting like it's falsy)
  • The unsync nightmare ensues

You can see in the screenshot below that the global headers are not showing
image

API error management

The errors format is currently all over the place. It will be good to have a module that handles all the errors to standardize a format across the whole API - controllers.

This issue will be updated with any discussion points.

Error when execute 'npm run db:migrate'

Hi,

I've got this message when I try to initialise the database with the migrate command.

0 info it worked if it ends with ok
1 verbose cli [ '/usr/bin/node', '/usr/bin/npm', 'run', 'db:migrate' ]
2 info using [email protected]
3 info using [email protected]
4 verbose run-script [ 'predb:migrate', 'db:migrate', 'postdb:migrate' ]
5 info lifecycle [email protected]predb:migrate: [email protected]
6 info lifecycle [email protected]
db:migrate: [email protected]
7 verbose lifecycle [email protected]db:migrate: unsafe-perm in lifecycle true
8 verbose lifecycle [email protected]
db:migrate: PATH: /usr/lib/node_modules/npm/node_modules/npm-lifecycle/node-gyp-bin:/opt/chartbrew/server/node_modules/.bin:/usr/local/sbin:/usr/local/bin:/usr/sbin:/usr/bin:/root/bin
9 verbose lifecycle [email protected]db:migrate: CWD: /opt/chartbrew/server
10 silly lifecycle [email protected]
db:migrate: Args: [ '-c', 'cd models && npx sequelize-cli db:migrate' ]
11 silly lifecycle [email protected]db:migrate: Returned: code: 1 signal: null
12 info lifecycle [email protected]
db:migrate: Failed to exec db:migrate script
13 verbose stack Error: [email protected] db:migrate: cd models && npx sequelize-cli db:migrate
13 verbose stack Exit status 1
13 verbose stack at EventEmitter. (/usr/lib/node_modules/npm/node_modules/npm-lifecycle/index.js:332:16)
13 verbose stack at EventEmitter.emit (events.js:198:13)
13 verbose stack at ChildProcess. (/usr/lib/node_modules/npm/node_modules/npm-lifecycle/lib/spawn.js:55:14)
13 verbose stack at ChildProcess.emit (events.js:198:13)
13 verbose stack at maybeClose (internal/child_process.js:982:16)
13 verbose stack at Process.ChildProcess._handle.onexit (internal/child_process.js:259:5)
14 verbose pkgid [email protected]
15 verbose cwd /opt/chartbrew/server
16 verbose Linux 3.10.0-1062.4.3.el7.x86_64
17 verbose argv "/usr/bin/node" "/usr/bin/npm" "run" "db:migrate"
18 verbose node v10.22.0
19 verbose npm v6.14.6
20 error code ELIFECYCLE
21 error errno 1
22 error [email protected] db:migrate: cd models && npx sequelize-cli db:migrate
22 error Exit status 1
23 error Failed at the [email protected] db:migrate script.
23 error This is probably not a problem with npm. There is likely additional logging output above.
24 verbose exit [ 1, true ]

Regards,

Steve

Cannot delete Projects that have Saved Queries referenced in them

Currently, the SavedQueries have the Project foreign key and it's causing the Project deletion to fail.

Instead of fixing, maybe it's worth making the SavedQueries part of the Team instead of Project. That way the queries can be used across multiple dashboards.

Error when trying to delete a Project that has a SavedQuery:

{
	"name": "SequelizeForeignKeyConstraintError",
	"parent": {
		"code": "ER_ROW_IS_REFERENCED_2",
		"errno": 1451,
		"sqlState": "23000",
		"sqlMessage": "Cannot delete or update a parent row: a foreign key constraint fails (`chartbrew`.`SavedQuery`, CONSTRAINT `SavedQuery_ibfk_1` FOREIGN KEY (`project_id`) REFERENCES `Project` (`id`) ON DELETE NO ACTION ON UPDATE CASCADE)",
		"sql": "DELETE FROM `Project` WHERE `id` = '158'"
	},
	"original": {
		"code": "ER_ROW_IS_REFERENCED_2",
		"errno": 1451,
		"sqlState": "23000",
		"sqlMessage": "Cannot delete or update a parent row: a foreign key constraint fails (`chartbrew`.`SavedQuery`, CONSTRAINT `SavedQuery_ibfk_1` FOREIGN KEY (`project_id`) REFERENCES `Project` (`id`) ON DELETE NO ACTION ON UPDATE CASCADE)",
		"sql": "DELETE FROM `Project` WHERE `id` = '158'"
	},
	"sql": "DELETE FROM `Project` WHERE `id` = '158'",
	"fields": ["project_id"],
	"table": "Project",
	"index": "SavedQuery_ibfk_1",
	"reltype": "parent"
}

Reuse data from query/api request screen while editing the chart to increase the efficiency

What's the issue

When a request is made using the API or Query builder the data is not used further and it causes the preview function to request the same data from the backend (and consequently from the connection) again.

How can this work better

It should follow these steps:

  1. Make/build query or API request
  2. Request the data from the connection
  3. The user goes to the Build Chart step and configures the dataset
  4. When the _onPreview function in the AddChart container fires, it reuses the data from step 2
  5. The Back-end will need to be modified to accept this data without making a new request to the connection
  6. When the user clicks on the Create or Update button to end the editing, the data should be reused again so that the loading doesn't take forever when dealing with big datasets

Add the ability to change the order of the Datasets

Would be nice to be able to change the order of the Datasets, especially on the KPI charts:

  • New field in the Dataset model called order
  • New sequelize migration to reflect the new schema changes
  • Front end rendering based on the new order field
  • Front end functionality to change the order of the datasets - ideally drag-n-drop the elements (top-right of the screenshot below)

image

Add a socket.io service/module in the backend

The motivation

A lot of future tasks will be based on real-time communication through websockets:

  • Collaborative chart creation
  • Collaborative dashboard editing
  • Support for streams of data (Database streams like on MongoDB for example)

Architecture

The socket.io will be a new module in the server-side code. It should have the following functionality:

  • Register new events
  • Put together a standard of how data is formatted
  • Ability to call socket services from the rest of the application
  • Support identifiers so that the broadcasts go to the right users

Export chart in PDF format

Chart.js is drawn on an HTML <canvas /> that should be straightforward to export to a PDF or any other image format.

The option to export to PDF should be included in the contextual menu of every chart (screenshot below). This shouldn't require any back-end work.

image

Refactor every react component to use react-hooks

How to contribute to this issue:

  • Scroll down below to check the existing PRs so you don't open a PR for a component waiting for review
  • Refactor components based on the description below - also check the guidelines for PRs
  • Reference this issue with #58 in the PR description so we can track which components are being worked on
  • Open one PR per component

Examples of final results:

The refactoring should address the following:

class components => functional components

class CoolComponent {
  constructor(props) {}
}

// to

function CoolComponent(props) {
  // deconstruct all the props here, at the beginning
  const { someProp, anotherOne } = props;
}

Lifecycle methods switched to useEffect

componentDidMount()

// to

useEffect(() => {}, []);
componentDidUnmount()

// to

useEffect(() => {
  return () => {
    // do stuff here when closing down the component
  }
}, []);
componentDidUpdate()

// to

useEffect(() => {}, [someProp]);
// someProp should be the prop or multiple props that the component should watch for

Internal this.state => useState

this.state = {
  loading: true,
};

// to

const [loading, setLoading] = useState(true);

All previous class methods should now be constant variables

class CoolComponent {
  _someMethod = () => {}
}

// to

function CoolComponent() {
  const _someMethod = () => {};
}

Option to duplicate projects with all the settings/connections/charts/savedQueries/apirequests

This could work in two different ways:

  1. Have an option in the User dashboard to duplicate the project and everything will be duplicated

This approach might be tricky to implement because of the granularity involved: have to search for all the associated items to duplicate - connections, charts, saved queries, api requests, datasets

  1. The option can be placed on individual items:

For example, a connection can have an option to be copied over to another project. The same with charts, but this entails the same issue identified in 1. where all associated items need to be duplicated as well

The dataFinder module gets confused when selecting a deeper object property

When does it happen?

When the response object is in a format like below:

[
  {
    "url": "https://api.github.com/repos/octocat/Hello-World/commits/6dcb09b5b57875f334f61aebed695e2e4193db5e",
    "commit": {
      "url": "https://api.github.com/repos/octocat/Hello-World/git/commits/6dcb09b5b57875f334f61aebed695e2e4193db5e",
      "author": { // selecting this field
        "name": "Monalisa Octocat",
        "email": "[email protected]",
        "date": "2011-04-14T16:00:49Z"
      },
      "committer": {
        "name": "Monalisa Octocat",
        "email": "[email protected]",
        "date": "2011-04-14T16:00:49Z"
      },
      "message": "Fix all the bugs",
      "tree": {
        "url": "https://api.github.com/repos/octocat/Hello-World/tree/6dcb09b5b57875f334f61aebed695e2e4193db5e",
        "sha": "6dcb09b5b57875f334f61aebed695e2e4193db5e"
      },
      "comment_count": 0,
      "verification": {
        "verified": false,
        "reason": "unsigned",
        "signature": null,
        "payload": null
      }
    },
    "author": { // confused by this field
      "login": "octocat",
      "id": 1,
      ....
    },
    ....

As can be seen in the object above, there are two properties called author; one in the root object and the other one in commit.author.

If the user wants to select commit.author.date as the date field to use for a time series, sometimes the dataFinder modules tries to find this field in the root author folder returning undefined.

Changing the project from the top navigation bar doesn't change the URL

image

What happens

The project and dashboard visually change, but the URL stays the same. This causes page refreshes to go back to the previous project. Some error artefacts like the connection not appearing on the charts happen as well.

Expected behaviour

The URL should change to point towards the new project ID.

Replace simplecrypt because it's using deprecated node cypher API

Deprecation warning: crypto.createCipher is deprecated

simplecrypt is not receiving any other updates and it's using the deprecated API. Needs to be replaced with another library.

A good contender might be: bcrypt

⚠Things to take into account:

  • All the encrypted content in the database might need to be migrated to the new encryption system.
  • Existing users must be able to log in as usual after the move

Incorrect date format chosen when a secondary dataset spans over multiple years

Normally, Chartbrew looks for the span of the dataset, and if it extends over multiple years, it adds the year to the X Label.

If Dataset#1 spans over multiple years the format will be -> YYYY MMM D
Dataset#n will then get the same format


The problem arises when:

Dataset#1 doesn't span over multiple years. The format will then be -> MMM D
Dataset#2 spans over multiple years, it will take the format of the 1st dataset and it will mess up the order of the dates

Create a temporary draft when editing a live chart

At the moment, any changes made when editing a live chart will be visible right away in all places that the chart is made available.

To improve the experience, the #28 PR disabled the autosave flag when editing a live chart to avoid premature edits.

A better experience would be:

  • Click Edit on a live chart
  • A draft gets created and it will record in the database which is the live chart that it represents
  • The user can make any edits and all be saved in the draft
  • When drafting is complete, the user can choose to save the new changes into the live chart
  • The temporary drafts gets removed from the database

✨ New one UI interface for the AddChart container

Follow the design below

Completed? ❌
Code work done here: #24

https://www.figma.com/file/3Ywgwux25q5jpjOwgVt8R6/Chartbrew---AddChart-One-UI

What

This issue will track the design and implementation of a new style of interaction when creating a chart. Instead of the wizzard-type interaction implemented at the moment, the new interface will have all the elements present in one page:

On the same page, a user can do the following:

  • Add the name of the chart
  • Add new connections (multiple connections per chart < insert new issue here when created >)
  • Access to connections configuration
  • Select the type of visualisation

Simplify the roles check in the backend

At the moment, checking the roles (if the current user can access the resource) requires a lot of repetitive code:

return projectController.findById(req.params.project_id)
      .then((project) => {
        return teamController.getTeamRole(project.team_id, req.user.id);
      })
      .then((teamRole) => {
        const permission = accessControl.can(teamRole.role).updateAny("chart");
        if (!permission.granted) {
          throw new Error(401);
        }
        // and only here everything is ready to continue
      })

This also makes the API routing a bit complicated as it's required to always include the project ID in the route.

BUT for starters, it will be good to make the check above shorter by modularising the access role check.

Directory code is missing

Hi,

when you want to use the Dockerfile it returns that "npm ERR! enoent ENOENT: no such file or directory, open '/code/package.json'"
And there is no code directory on the GitHub repository.

Regards,

Steve

Support custom values

I could be reading the setup wrong, but it appears the only way the Y axis value is determined is by the number of records returned in the results. It would be nice to set the value used for y axis in the query itself. For example, if we wanted to see number of users by role we would currently query like this:

SELECT role_name FROM users

It would be nice to offload this to the SQL like this:

SELECT role_name, count(*) as y_axis

This allows for more custom/advanced charts.

Is this already supported and I'm just missing it in the docs?

Can't sign up as new user in synology docker

Hi! After some ups and downs I have been able to configure chartbrew and make it run in my synology docker. The issue that I'm facing is that when I enter the frontend and try to sign-up as new user nothing happens! I mean, I complete name, mail and password but when I press the button nothing happens...

Thanks for your help

Make the client app responsive on mobile

This will be a bigger issue to track since it involves a lot of pages. So here's a checklist with all that needs to be addressed:

  • User Dashboard (just addressed in a6f8160)
  • Project Dashboard (side-menu should go at the bottom with most used items)
  • The Navbar component (get rid of the project selector and move other items to the User Icon dropdown)
  • Account settings page (side menu up top or at the bottom)
  • Team management page (side menu up top or at the bottom)
  • Chart builder page (more complicated, but lower priority since the mobile version will most likely be used for reporting only)

Invisible drafts still take line space

If a line has a draft and a completed chart the line looks like this:

image

The expected behaviour when hiding the draft is for CB Users to go to the left of the line and CB Charts take the place of CB Users.

Instead, this happens:

image

Chart data events

This feature will add events when certain data is detected in the Charts. For example, when the last data node in a chart hits a determined value, Chartbrew will send an email to the user.

Email events

The email event can be the default behavior. Let's say you might track the memory usage of your server and then the memory reaches a certain threshold. You will get an email when that happens.

Webhooks

The event configuration can have the option to configure webhook endpoints. Chartbrew will them make a POST request with a payload that contains:

  • Value that triggered the event
  • Chart configuration
  • Which chart, which project
  • Direct URL to the chart
  • Direct URL to the dashboard
  • Generated image of the chart? πŸ€”πŸ€”πŸ€” (can then be automatically distributed to other people/services for display)

Request your own:

Comment below if you have any other suggestions

[DOCS] The front-end deployment information is not correct

pm2 serve is for serving static sites and it will give a 404 if the user refreshes the page.

pm2 should instead use the external serve module to serve the site and for this it needs a configuration file like so:

{
  apps : [
    {
      name      : "chartbrew-client",
      script    : "npx",
      interpreter: "none",
      args: "serve -s . -p 5100"
    }
  ]
}

Recommend Projects

  • React photo React

    A declarative, efficient, and flexible JavaScript library for building user interfaces.

  • Vue.js photo Vue.js

    πŸ–– Vue.js is a progressive, incrementally-adoptable JavaScript framework for building UI on the web.

  • Typescript photo Typescript

    TypeScript is a superset of JavaScript that compiles to clean JavaScript output.

  • TensorFlow photo TensorFlow

    An Open Source Machine Learning Framework for Everyone

  • Django photo Django

    The Web framework for perfectionists with deadlines.

  • D3 photo D3

    Bring data to life with SVG, Canvas and HTML. πŸ“ŠπŸ“ˆπŸŽ‰

Recommend Topics

  • javascript

    JavaScript (JS) is a lightweight interpreted programming language with first-class functions.

  • web

    Some thing interesting about web. New door for the world.

  • server

    A server is a program made to process requests and deliver data to clients.

  • Machine learning

    Machine learning is a way of modeling and interpreting data that allows a piece of software to respond intelligently.

  • Game

    Some thing interesting about game, make everyone happy.

Recommend Org

  • Facebook photo Facebook

    We are working to build community through open source technology. NB: members must have two-factor auth.

  • Microsoft photo Microsoft

    Open source projects and samples from Microsoft.

  • Google photo Google

    Google ❀️ Open Source for everyone.

  • D3 photo D3

    Data-Driven Documents codes.