Before this lesson , we recommend you go through
- Measures of Location
- Measures of Spread
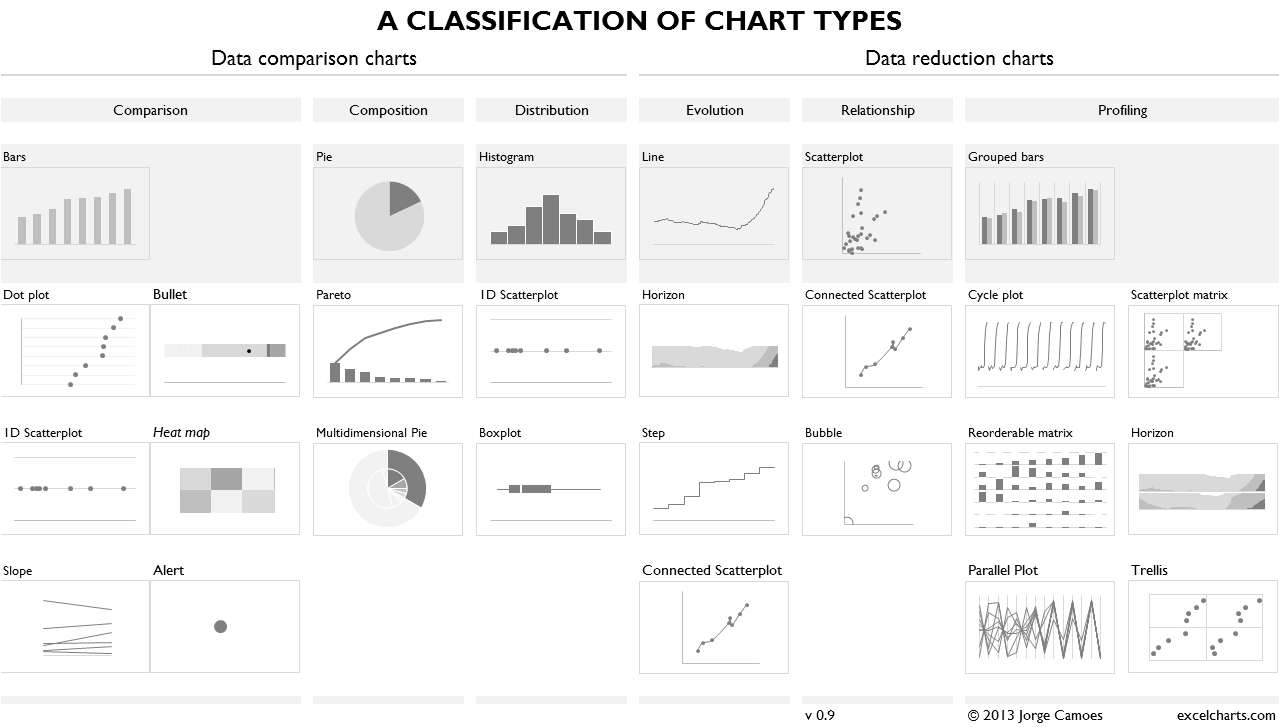
- Taxonomy of charts
- Classification of Chart Types
- Random Variables
- A Gentle Introduction to Scikit-Learn: A Python Machine Learning Library
After this lesson, you'll be able to
- How to get an overview of dataset without any code?
- Deep dive with Pima Indians Diabetes
- Perform Exploratory Data Analysis
- Work with Data
- Have a mathematical feeling of Linear Regression
- Derivation of OLS - Non Calculus
- Derivation in terms of Matrices
- Derivation of OLS - Calculus
- Derivation of OLS - Graphical
- Pima
- Plasma glucose concentration a 2 hours in an oral glucose tolerance test
- Diastolic blood pressure (mm Hg)
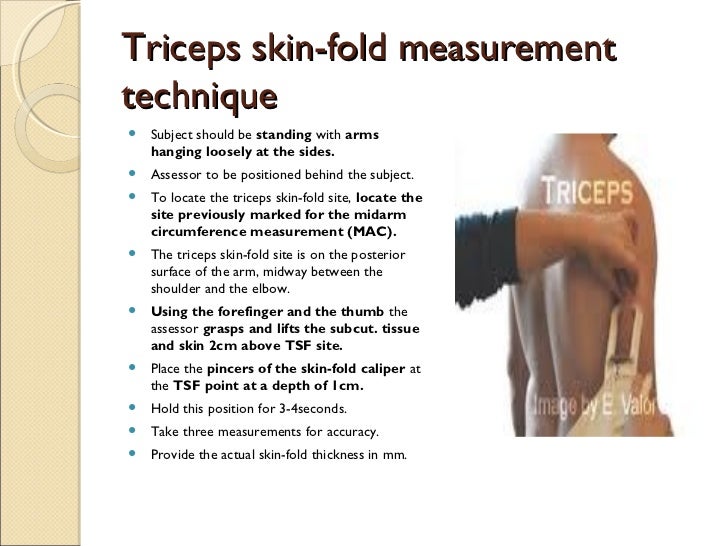
- Triceps skinfold thickness (mm)
- Insulin
- BMI
- EDA is not a compulsary step. Most
- Its not even a step. Its what you call as getting a feel.
- Have your Checklist Ready
- Apply en-masse
- Dimensions of your data - .shape
- Statistical Summary - .describe()
- Get General Highlevel - .info()
- Class Distribution - .groupby('class').size()
- Pairwise Pearson correlations - .corr()
- Skew for each attribute - .skew()
- Head()/ Tail()
- Keep the DAMN thing clean - Don't do a half hearted job at it - Else, don't do it
- What every chart should have?
- Title
- xlabels
- ylabels
- xticks
- yticks
- xmin
- ymin
- legend
- annotate
- Have a default script -
- Know the following
- What kind of insight is best drawn from what kind of chart? Refer Taxonomy
- Sacrilegious mistakes - What kind of features can be plotted? Can't do a scatter plot on catgorical variables
- Know your variable/ feature scales - Nominal/ Ordinal/ Interval/ Ratio
- Most used plots * Q Q Plot * Scatter * Line * Histogram * Correlogram * Box & Whiskers
-
Go to the Data Repository - Select the below 10 Datasets
* Iris * Titanic * Sonar * Pima Indians Diabetes * Water Treatment Plant * Boston Housing * Forest Fires * Fertility * Communities and Crime Data Set * Wine Quality Data Set * Automobile -
Make a Group of 2/3 - Download the Datasets - Read 'Data Set Description'
-
Each team will explain the dataset and corresponding domain required to understand the day * These are extremely popular the Datasets - You will most likely find ready made Python code for EDA - Google it and go through it
- Critical Thinking
- How to treat Outliers?" - Are Outliers Good or Bad?
- Value of Exploratory Analysis
- Use of Excel for EDA
- Excel Data Analysis - Sort/ Filter/ Pivot
- How to Lie with Statistics
- Think Stats
- Scatter Matrix - What to use?


