![]()


If you have your own data that has/hasn't been processed, you should conform to the following structure. Basically, load your data into a Pandas dataframe object and be sure to convert the dates to datetime format, set dates to dataframe object index and include the following lowercase column titles.
              index         high          low         open        close
2017-07-08 11:00:00  2480.186778  2468.319314  2477.279567  2471.314030
2017-07-08 11:30:00  2471.314030  2455.014057  2471.202796  2458.073602
2017-07-08 12:00:00  2480.000000  2456.000000  2458.073602  2480.000000
If you don't have your own data, we've included a useful function for grabbing historical charting data from the Poloniex exchange or from Cryptocompare. In this example, we'll trade the BTC/ETH pair on a 4H timeframe. With the poloniex helper function, it's easy to do that.
from gemini.gemini import Gemini
from gemini.helpers import poloniex as px
from gemini.helpers.analyze import analyze_bokeh

def logic(algo, data):
    """
    Main algorithm method, which will be called every tick.

    :param algo: Gemini object with account & positions
    :param data: History for current day
    """
    pass

pair = "ETH_BTC"    # Use ETH pricing data on the BTC market
period = 1800       # Use 1800 second candles
days_history = 200  # Collect 200 days data

# Request data from Poloniex
df = px.load_dataframe(pair, period, days_history)

# Algorithm settings
sim_params = {
    'capital_base': 10,      # initial capital in BTC
    'fee': {
        'Long': 0.0025,      # fee settings for Long
        'Short': 0.0025,     # fee settings for Short
    },
    'data_frequency': '4H'    # Time frame to use (see /helpers/timeframe_resampler.py for more info
}

# Load data and settings to backtester core
gemini = Gemini(logic=logic, sim_params=sim_params, analyze=analyze_bokeh)

# Start backtesting custom logic with 10 (BTC) initial capital
gemini.run(df, show_trades=True)In addition to loading the data, you must define the strategy you want to test. To do this, we'll create a logic function that can be passed to the backtester when you start. If the data hasn't already been processed, you may process it within the logic function (this makes the simulation more accurate but significantly increases runtime). With those, you may execute long, sell, short, and cover positions directly on the "Account" class based on your strategy.
def logic(algo, data):
    """
    Main algorithm method, which will be called every tick.

    :param algo: Gemini object with account & positions
    :param data: History for current day
    """
    if len(data) < 2:
        # Skip short history
        return

    today = data.iloc[-1]      # Current candle
    yesterday = data.iloc[-2]  # Previous candle

    # close positions
    if len(algo.account.positions) > 0:
        if today['close'] < yesterday['close']:
            exit_price = today['close']
            for position in algo.account.positions:
                if position.type_ == 'Long':
                    algo.account.close_position(position, 1, exit_price)

    # open positions
    elif today['close'] > yesterday['close']:
        risk = 0.03
        entry_price = today['close']
        entry_capital = algo.account.buying_power * risk
        if entry_capital >= 0.00001:
algo.account.enter_position('Long', entry_capital, entry_price)After the backtest, you can analyze your strategy by printing the results to console. As of now, these include simple statistics of your run but we plan to implement more complicated metrics for a stronger understanding of performance.
Buy and Hold : -45.63%
Net profit   : -4.56
B & H MDD    : -52.09%
Strategy     : -4.38%
Net profit   : -0.44
Strategy MDD : -4.49%
Longs        : 269
Sells        : 269
Shorts       : 0
Covers       : 0
--------------------
Total Trades : 538
You can visualize the performance of your strategy by comparing the equity curve with a buy and hold baseline. The equity curve simply tracks your account value throughout the backtest and will optionally show where your algorithm made its trades including longs, sells, shorts, and covers.
gemini.run(df, show_trades=True)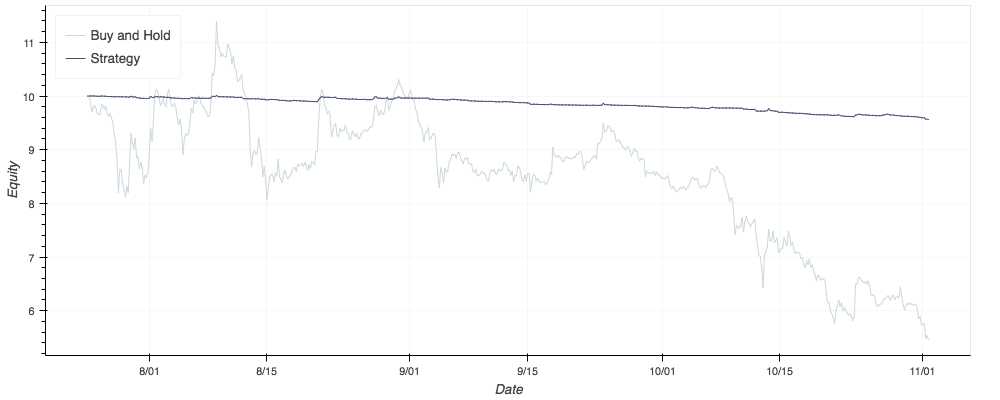
You can find this, and some more examples on /examples/
Please take a look at our contributing guidelines if you're interested in helping!


