Giter VIP home page Giter VIP logo

crunchtabs's Introduction

crunchtabs

Crunchtabs allow for the automatic generation of toplines, crosstabulation and codebooks directly from a crunch dataset.

R-CMD-check codecov

Quick Start

For a broader introduction please see our introductory vignette. For codebooks, see codebooks

1. Install tinytex

To make PDF reports, you'll need a working LaTeX installation. One way to get this is with the tinytex package. Or, see https://www.latex-project.org/get/ to install everything. We strongly recommend installing tinytex because it reduces the number of potential problems.

install.packages('tinytex')
tinytex::install_tinytex()

2. Install crunchtabs

# install.packages("remotes")
remotes::install_github("Crunch-io/crunchtabs")

Create a Topline

Generating a topline report is quick and easy!

# library(crunchtabs)
# login()

ds = loadDataset("Example dataset")
# Use ds = newExampleDataset() if not found!

toplines_summary <- crosstabs(dataset = ds)
writeLatex(toplines_summary, filename = "output", pdf = TRUE) # output.pdf will be written 

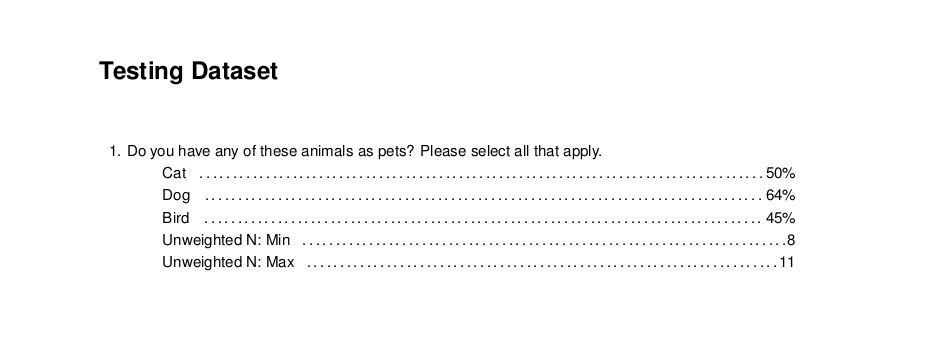
Topline Example from the Example Dataset

Create a recontact or pre/post Topline

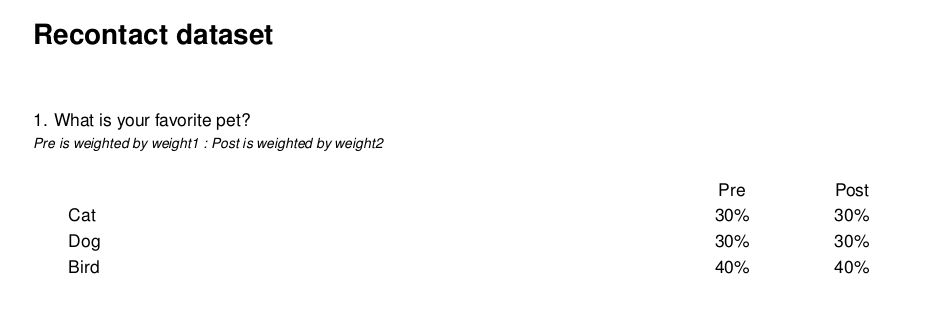
Let's say you have a datasaet where you have asked the same question twice. Once "before" and once "after". recontact_topline generates a report that shows these two side by side as if they were a categorical array. Making it easier for reviewers to identify differences over time.

The function assumes your "before" and "after" questions are named in the same way with a suffix.

  • q1_pre
  • q1_post
  • q3_pre
  • q3_post
<!-- -->
# library(crunchtabs)
# login()
ds <- loadDataset("Your Recontact Survey")
rc <- recontact_toplines(
  ds, 
  questions = c("q1", "q3"), # The base question name without suffixes
  suffixes = c("_pre", "_post"), # The suffixes
  labels = c("Pre", "Post"), # The labels associated with the pre/post
  weights = c("weight1", "weight2") # The weights associated with the pre/post
)

writeLatex(rc, pdf = TRUE)

Recontact Example

Depending on your preferences you can also flip grids if have more categories than waves:

theme <- themeNew(
  default_theme = themeDefaultLatex(), 
  latex_flip_specific_grids = c("q1")
)

writeLatex(rc, theme = theme, pdf = TRUE)

Recontact Example - Flipped Grid

Create a Tracking Report

While recontact reports are designed for questions asked in the same dataset, we also have the ability to present questions asked in multiple datasets in a similar fashion. There are some critical nuances here that should be understood - we recommend reviewing the eponymously named vignette.

# library(crunchtabs)
# login() 

theme <- themeNew(
  default_theme = themeDefaultLatex(), 
  latex_flip_grids = TRUE
)

ds1 <- loadDataset("My DS Wave 1")
ds2 <- loadDataset("My DS Wave 2")
ds3 <- loadDataset("My DS Wave 3")

ct <- trackingReport(
  dataset_list = list(ds1, ds2, ds3), 
  vars = c("question_alias1", "question_alias2", "question_alias3"),
  wave_labels = NULL
)

writeLatex(ct, pdf = TRUE, theme = theme)

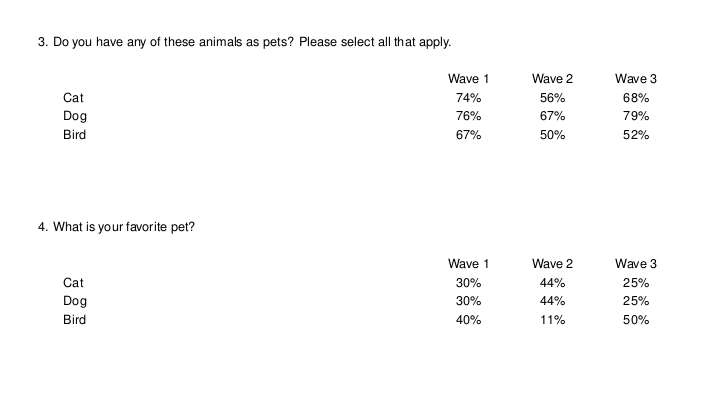
Tracking Report Example - Flipped grids

Create a Cross Tabulation

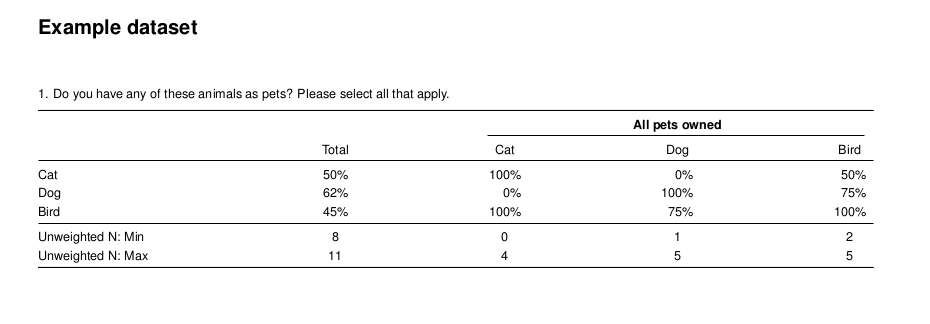
The only additional step required for a cross tab report is to create a banner object. Then, setting it as the banner argument for the crosstabs function. Below, we create a cross tabulation report that shows the type of pet(s) respondents own to our survey for every question in the survey. Once you have run the code, we encourage you to open the resulting output.pdf file. Inside of the report you will find a cross tabulation of all questions by pet ownership.

# library(crunchtabs)
# login()

ds = loadDataset("Example dataset")
# Use ds = newExampleDataset() if not found!

ct_banner <- banner(ds, vars = list(`banner 1` = c('allpets')))
ct_summary <- crosstabs(dataset = ds, banner = ct_banner) # banner parameter set here
writeLatex(ct_summary, filename = "output", pdf = TRUE) # output.pdf will be written 

Cross Tabulation Example from the Example Dataset

Excel

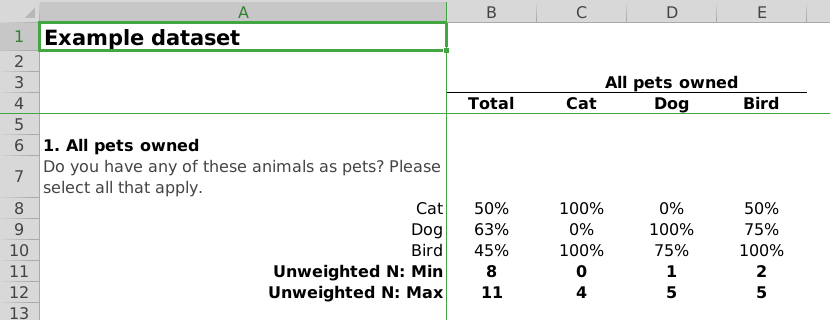
To create documents in excel, the process is the same as that for creating PDF reports. However, in the last line of our example scripts we use writeExcel instead of writeLatex while also removing the pdf = TRUE argument. As with PDF reports, there are a large amount of options that can be set to adjust the look and feel of the resulting Excel spreadsheets.

# ... cross tab
writeExcel(ct_summary, filename = "output") # output.xlsx will be written 

# ... topline, not yet implemented
# writeExcel(toplines_summary, filename = "output") # output.xlsx will be written 

Cross Tabulation Excel Example from the Example Dataset

Generating Codebooks

Generating a codebook is easy!

# library(crunchtabs)
# login()

ds = loadDataset("Example dataset")
# Use ds = newExampleDataset() if not found!

writeCodeBookLatex(ds)

crunchtabs's People

Contributors

1beb avatar deliabailey avatar domjarkey avatar gergness avatar jonkeane avatar ksedr avatar malecki avatar npelikan avatar persephonet avatar stewartjwright avatar

Stargazers

 avatar  avatar  avatar  avatar

Watchers

 avatar  avatar  avatar  avatar  avatar  avatar  avatar  avatar  avatar  avatar  avatar  avatar  avatar  avatar  avatar  avatar  avatar  avatar  avatar  avatar  avatar  avatar  avatar  avatar  avatar  avatar  avatar  avatar  avatar  avatar  avatar  avatar  avatar  avatar  avatar  avatar  avatar  avatar  avatar  avatar  avatar  avatar

crunchtabs's Issues

Relegate warnings

  • Font shape declaration:
LaTeX Warning: Font shape declaration has incorrect series value `mc'.
               It should not contain an `m'! Please correct it.
               Found on input line 20.
  • Fancyheader font size warning:
Package Fancyhdr Warning: \headheight is too small (12.0pt): 
Make it at least 14.68837pt.
We now make it that large for the rest of the document.
This may cause the page layout to be inconsistent, however.

Fix Travis CI environment

R CMD check fails with an error on a Travis worker instance:
Error: package 'testthat' was installed by an R version with different internals; it needs to be reinstalled for use with this R version

Error from writeExcel() in package crunchtabs

I was trying to export reports from crunch using package crunchtabs. I could export pdf report correctly. But I got an error when I exported excel report.

Without option proportions = TRUE in function writeExcel(), there is no error. But I want to see proportions rather than count in the excel report.

With option proportions = TRUE in function writeExcel(), there is an error as below:

Error in names(object) <- nm :
'names' attribute [4] must be the same length as the vector [1]

array names not appearing

in writeExcel, when "name" is not included in show_information, array subvariable names do not appear.

Add survey duration to sample description

I noticed when I was doing it that duration which is numeric is dropped. So we will need to get crunchtabs to do that...

Duration should be included as part of the sample description if available.

Add tests

There aren't any, and there need to be. Start at the highest level with an integration test or two, see what kind of coverage that gets you. Then you can work to refactor and extend the code with greater confidence.

Column widths need to be smarter for grid questions

In the case of grid type questions, where we have one statement per row and potential responses as columns;

Good Bad
Statement 1 x% y%
Statement 1 x% y%

The column containing the statement can span a larger width of the page to accomodate a larger statement and avoid text wrapping. Instead questions of this nature tend to center on the page horizontally, and spread widths equally. Forcing a the statement to wrap where there would otherwise be enough space if the numeric response columns were "squished".

Providing a setting or automatic adjustment based on the length of the statement text + response headers would be useful here.

Vignette

  • Update or create a vignette for the crunchtabs package

error in header for logo

Hello,

This looks to be a small, new error introduced from today's changes. Currently I get

\fancyhead[L]{{\fontsize{16}{24}\textbf{Title}}}
logo.png\newcolumntype{d}{D{.}{.}{3.2}}

which is wrong but fixed by running this:
\fancyhead[L]{{\fontsize{16}{24}\textbf{Title}}\fontsize{12}{18}\textbf{}}
\fancyhead[R]{\includegraphics[scale=.4]{logo.png}}

in the .tex file. If I can help by giving more information, please let me know.

Brian

Organizing Issue

Refer to this issue to see progress on other issues.

In progress:

  • Placeholder

Proposed features:

  • Add option to enforce one table per page #56
  • Gryphon formatting import #55
  • Relegate issues and warnings #47

Add option to enforce one table per page

In some situations where we have a subtable inside of a cross tab, if the number of responses is large, the table can span multiple pages. This is undesireable. Major clients prefer to see a complete table per page, if a table would overrun, the subtable should be shown on the next page.

Internal Note: See Battleground Tracker Dem Presidential Primary Vote by Party/Ideology

Gryphon formatting import

In Gryphon, we often use basic markdown formatting on question text. However, these updates are not typically visible in toplines or crosstab documents created by crunchtabs. Need to explore a method for "copying over" this injected formatting.

In a perfect world - that there was some formatting in the question that the respondent saw would also be replicated in the tabs

  • text wrapped in ** should be converted to \textbf{text}
  • text wrapped in <u></u> should be \underline{} (need to use character entity too, such as < >)
  • <br> or <br /> should be converted to a newline (a carriage return)

The XML export from Gryphon appears to provide all of the information that we need to copy over formatting elements like underline, bold and new lines.

Feature request from client

Focusing on writelatex for toplines here.

Currently, we use long table to extend a table that would run across the bottom of a page. A client would rather have it be so that long table did not intervene and if a new table would have to be spread across multiple pages, then instead it would skip to a new page and start from the top of that page.

I asked them, what about a scenario where you have a table so long that even if it starts on a new page for itself it would run off? They said, then in those cases it's ok to do long table. So might be fairly complicated what they want. They also said that it "almost never" happens in their work where a table that was given a whole new page would run off, but that's specific to them.

Use of double quotation marks in G4 questionnaire leads to errors in latex/pdf creation

Clients ask questions that involve quotes and use double quotation marks in the wording. However, crunchtabs will throw an error if it encounters double quotation marks. Current work around is to replace double quotation marks with single quotation marks, but that seems less than ideal. Is there a way for crunchtabs to identify double quotation marks and handle without error?

Remove appveyor and travis

  • Remove appveyor
  • Remove travis (reporting failure even when it passes, not worth fixing when github action works just fine and wildly faster)

Test failures in working branch

  • Reference doc requires update
test-write-latex.R:67: failure: Write Latex toplines
`tex` not identical to `ref`.
Lengths differ: 367 is not 368
  • Reference doc requires update:
test-write-latex.R:31: failure: Write Latex crosstab
`tex` not identical to `ref`.
Lengths differ: 754 is not 723
  • Reference doc requres update:
test-write-latex.R:40: failure: Write Latex crosstab
tex[90] not equal to "Sample  &  Adults \\\\ ".
1/1 mismatches
x[1]: "\\setlength{\\LTright}{
x[1]: \\fill}"
y[1]: "Sample  &  Adults \\\\ 
y[1]: "

Feature request: hypothesis testing

Testing each category against the other categories for that variable. This is what clients have gotten traditionally and is what they expect.

More tests!

Goal: 80%

crunchtabs Coverage: 68.95%
R/crunchtabs.R: 0.00%
R/banner.R: 1.15%
R/crosstabs.R: 1.43%
R/getters.R: 15.00%
R/tabBooks.R: 24.48%
R/utils.R: 26.53%
R/themes-built-in.R: 59.42%
R/forNowTransforms.R: 64.44%
R/writeExcel.R: 79.07%
R/tex.R: 83.64%
R/tex-table.R: 88.31%
R/theme.R: 90.58%
R/reformatResults.R: 91.08%
R/writeLatex.R: 95.57%

Excel topline reports

investigate if they can be made? Errors currently with basic examples from pet dataset.

Get travis working

see title. Let's get it functional so that we can actually 'continuously' 'integrate'

Codebook for crunch

Generate a codebook that includes data like: https://electionstudies.org/wp-content/uploads/2018/12/anes_timeseries_2016_userguidecodebook.pdf

We also want to be able to include basic summary information (almost like a topline, but for unweighted data)

Summaries for:

  • CategoricalVariable
  • CategoricalArrayVariable
  • MultipleResponseVariable
  • NumericVariable
  • TextVariable
  • DateTimeVariable

Latex Header Objects for:

  • CategoricalVariable
  • CategoricalArrayVariable
  • MultipleResponseVariable
  • NumericVariable
  • TextVariable
  • DateTimeVariable
  • Weighting variables?

Appveyor builds fail due to unicode em-dash

Failure looks like

-- 1. Failure: Write Latex crosstab (@test-write-latex.R#31)  ------------------
`tex` not identical to `ref`.
4/723 mismatches
x[178]: "\\addcontentsline{lot}{table}{ 3A. Name the kinds of pets you have at the
x[178]: se locations. � Home}"
y[178]: "\\addcontentsline{lot}{table}{ 3A. Name the kinds of pets you have at the
y[178]: se locations. �\200� Home}"

That's from this line:

var_info[[1]] <- paste0(var_info[[1]], " \u2014 ", var_info$formatvarsubname)

I'm not sure if this suggests a general Windows failure, or if this is specific to Appveyor's configuration, or the test environment, or what. Not sure how much it matters since there are alternatives within LaTeX. We could probably just do --- instead, but some googling suggests that \textemdash might work best when using other fonts. Should be a quick fix, only slowed by needing to check that the PDFs are right and then updating the fixture .tex files.

Presentation of multiple response in toplines

Joe Williams reports in an email to [email protected] (emphasis added):

Data export from Gryphon to Crunch with dyngrid-check / grid-check problems is problematic. Variables are not bound together as would be expected for a grid type question. Instead, the grid-check subvariables are treated as stand alone variables in a separate folder with the label of the grid. The new stand alone variables take the description of the grid-check variable. The label for the new stand alone variables are the subvariable labels from the original grid-check question. Unexpected treatment, but not catastrophic. However, when creating a pdf using Crunch tabs, the toplines do not identify the subvariable being asked about. Also, the crosstabs, for some reason count the "No" response as part of the unweighted N. Rather than presenting an N, the crosstabs give percentages.

Sounds like an issue/request with this package, so I'm redirecting here. If you find that there's something for us to look into in crunch with multiple response handling, please let us know.

Repair rounding functionality in latex-requests

There is an option to round percentages down when the rounded sums are > 100. e.g., if the percents with were: 20.6, 20.4, 29.5, 29.5 that sums to 100, but when you round to no decimals, you get numbers that sum to 101. So, the function tries to find the place with the lowest error to round down, and takes the floor of that number instead.

You'd get something like 21, 20, 29, 30 in this case.

This is a long standing request from a client because for most questions, they can't display graphics on television that sum to > 100. This option is in the theme: latex_round_percentages = TRUE

A recent change request from a client was for certain questions, to ignore this default. (e.g., for vote questions, they'd rather have it sum to > 101 than report not the proper rounded percent for a candidate).

So the option to the theme was added: latex_round_percentages_exception = c('alias1', 'alias2')​
to ignore the default.

Which works in that it doesn't round down, but doesn't work in that the crosstabs for these specific Qs are reporting a base size of 100 regardless. See questions 3 and 5 in the crosstabs attached.

Sorting

This is a post-processing action that should happen after the call to crosstabs but before the call to writeLatex or writeExcel. It is expected that there will be many exceptional cases. It would be simple to apply, crosstab wide, a sort. However, it's likely that groups of variables will need to be sorted in the same way. This suggests that a passthrough function with a list of variables included would be the clearest method for the user. Although themeNew already has infrastructure for this type of formatting, we feel that it is already too complex additional functionality that manages the structure of the data in addition to the visual presentation would be confusing for the user.

Add two functions:

sort_alpha(ct, vars, descending, pin_to_top, pin_to_bottom)
sort_numeric(ct, vars, descending, pin_to_top, pin_to_bottom)

Usage example:

ct = crosstabs(ds) 
ct = sort_numeric(ct, vars)
writeLatex()

The function acts as a passthrough that could be applied to a group of variables or to a single variable allowing us to create exceptions.

ct = crosstabs(ds) 
ct = sort_numeric(ct, vars=c("a", "b"))
ct = sort_numeric(ct, vars=c("c"), pin_to_bottom = "Don't know")
writeLatex(ct)
  • Update vignette with sorting example
  • Tests for sort_numeric
  • Tests for sort_alpha
  • Add functions sort_numeric and sort_alpha (likely a generic with a sort type flag)
  • Works for toplines categorical, categorical_array

Table Anatomy post-hoc adjustments

Currently, tables / pages are created by a myriad of functions that do not interact well with each other. There is a significant amount of "pasting" together conditional statements with little to no easy way for post preparation editions of a programmatic nature. Converting this pasted TeX into a list structure prior to print could provide a useful final-mechanism for string replacements or adjustments at the end of the process.

Newline characters in variable name and description cause latex compiler to crash

Hello,

TargetSmart is testing this and found that if there is a newline character inside a variable name or description then the latex compiler crashes. I have not had a chance to build a minimum reproducible example yet (and will try to today) but wanted to file this now in case you can see the issue right away.

Here is an example from the .tex file, sorry I don't have their dataset yet.

\begin{center}
\begin{longtable}{p{0.3in}p{5.5in}}
\addcontentsline{lot}{table}{ 8. Q. 9 Now, I'd like to rate your feelings toward some people, with one hundred meaning a VERY WARM, FAVORABLE feeling; zero meaning a VERY COLD, UNFAVORABLE feeling;

and fifty meaning not particularly warm or cold. You can use any number from zero to one hundred, the higher the number the more favorable your feelings are toward that person. If you have no opinion or have never heard of that person, please say so. (IF DON'T KNOW) Would you say you are unable to give an opinion of (READ BELOW), or have you never heard of (READ BELOW)?

(NO OPINION/DK = 101) (NEVER HEARD = 102)

(RANDOMIZE)}
\hangindent=0em \parbox{6.5in}{
\formatvardescription{8. Q. 9 Now, I'd like to rate your feelings toward some people, with one hundred meaning a VERY WARM, FAVORABLE feeling; zero meaning a VERY COLD, UNFAVORABLE feeling; and fifty meaning not particularly warm or cold. You can use any number from zero to one hundred, the higher the number the more favorable your feelings are toward that person. If you have no opinion or have never heard of that person, please say so.

(IF DON'T KNOW) Would you say you are unable to give an opinion of (READ BELOW), or have you never heard of (READ BELOW)?

(NO OPINION/DK = 101) (NEVER HEARD = 102)

(RANDOMIZE)}} \\longtablesep

& 0-10 \hspace*{0.15em} \dotfill 8%\
& 10-20 \hspace*{0.15em} \dotfill 1%\
& 20-30 \hspace*{0.15em} \dotfill 1%\
& 30-40 \hspace*{0.15em} \dotfill 2%\
& 40-50 \hspace*{0.15em} \dotfill 2%\
& 50-60 \hspace*{0.15em} \dotfill 12%\
& 60-70 \hspace*{0.15em} \dotfill 3%\
& 70-80 \hspace*{0.15em} \dotfill 6%\
& 80-90 \hspace*{0.15em} \dotfill 3%\
& 90-100 \hspace*{0.15em} \dotfill 2%\
& 100-110 \hspace*{0.15em} \dotfill 60% \
& Totals \hspace*{0.15em} \dotfill 100% \
& Unweighted N \hspace*{0.15em} \dotfill 350 \

\end{longtable}
\end{center}

I googled around and found this page which seems to have the answer, that is to manually remove the newlines from the .tex file (I didn't follow the insert [zz] thing in this page, that didn't seem to do it). And so if you had some QC step that removes those newlines, then the .tex file that generates should be fine.

Warn users of missing logo

A themeNew object is typically created with a path to a logo that is relative to the filename. However, sometimes our working directory makes the file inaccessible via the specified path. It would be good to check if the logo file exists, and if not, point the user to look at their working directory or logo file path before continuing execution because it will otherwise fail with an error that is uninformative.

Current:

Error in pdflatex(filename, open) : 
  PDF file does not exist. Check that there are no errors in the LaTeX file.

Planned:

Error: The logo specified in themeNew does not appear to exist. Please check your current working directory to verify the path to the file

Error from function crosstabs()

I got an error as below when I ran toplines. After I excluded variables of type multiple-response, crosstabs() worked. FYI, the category names of those multiple-response variables are "selected" and "not selected". I also tried "Selected" and "not selected", but I got the same error.

[crunch] > toplines <- crosstabs(ds, weight = 'weight')
Error in ret$proportions[, "Selected"] : incorrect number of dimensions
In addition: Warning message:
In crosstabs(ds, weight = "weight") :
Variables of types: text, datetime are not supported and have been skipped

[crunch] > self(ds)
[1] "https://app.crunch.io/api/datasets/76683330d4c24ee9b84a2b211b9f996b/"

Pass 'R CMD CHECK'

See https://travis-ci.org/Crunch-io/crunchtabs/jobs/209846431 for a recent build on Travis. Lots of man/namespace issues. Among the ones I see are:

  • Missing imports from base packages
  • Other functions/objects referenced that don't exist (fixed a bunch by deleting unused functions in bf4d349)
  • Bad S3 documentation; mismatched signatures for the different methods
  • Invalid DESCRIPTION file

The method documentation can be a little tricky. What I've done for S4 is to define documentation separate from the methods and give it a @name, like https://github.com/Crunch-io/rcrunch/blob/master/R/dataset-catalog.R#L75. Then you link all methods you want to go with it to it like this: https://github.com/Crunch-io/rcrunch/blob/master/R/dataset-catalog.R#L78-L79.

Logo/branding should be parametrized

Find everywhere you have "YouGov" in the code and consider how that can be made an option. Perhaps function parameters, probably with a default that is getOption("something") so that you can set those values/paths in your .Rprofile and not have to pass them in every time.

Feature request: tabs export in MS Word

Client at Harvard "tabs export in Word would be huge".

Brainstorming, is it possible to take the pdf then force that to "open" in Word (as an image?) ? If not that, then I'm dubious about Word's built in "tables". Another alternative would be export to google docs which might be easier to work with and then they can export to Word from there if they really really need to.

Thank you.

Create manual override for stub width

  • format_label_column_exceptions functions on tableHeader.ToplineCategoricalArray
  • format_label_column_exceptions function on longtableHeadFootMacros
  • document appropriately in theme
  • Add tests + tex reference file with example

Recommend Projects

  • React photo React

    A declarative, efficient, and flexible JavaScript library for building user interfaces.

  • Vue.js photo Vue.js

    🖖 Vue.js is a progressive, incrementally-adoptable JavaScript framework for building UI on the web.

  • Typescript photo Typescript

    TypeScript is a superset of JavaScript that compiles to clean JavaScript output.

  • TensorFlow photo TensorFlow

    An Open Source Machine Learning Framework for Everyone

  • Django photo Django

    The Web framework for perfectionists with deadlines.

  • D3 photo D3

    Bring data to life with SVG, Canvas and HTML. 📊📈🎉

Recommend Topics

  • javascript

    JavaScript (JS) is a lightweight interpreted programming language with first-class functions.

  • web

    Some thing interesting about web. New door for the world.

  • server

    A server is a program made to process requests and deliver data to clients.

  • Machine learning

    Machine learning is a way of modeling and interpreting data that allows a piece of software to respond intelligently.

  • Game

    Some thing interesting about game, make everyone happy.

Recommend Org

  • Facebook photo Facebook

    We are working to build community through open source technology. NB: members must have two-factor auth.

  • Microsoft photo Microsoft

    Open source projects and samples from Microsoft.

  • Google photo Google

    Google ❤️ Open Source for everyone.

  • D3 photo D3

    Data-Driven Documents codes.