An effective monitoring system can be built across a Docker Swarm cluster using services managed by swarm itself. Starting with the prometheus node-exporter to gather system info from all host machines running Docker in swarm mode. Mount the system's directories as docker volumes to accomplish read access. Prometheus exporter gathers system info such as CPU, memory, and disk usage and exports it to a website that Prometheus server can then scrape every 15 seconds and fill a Time Series Data Base. With those 2 services in place, Grafana can then be pointed at the Prometheus server to build beautiful graphs and dashboards!
Prerequisites:
Docker Swarm uses Compose v3 and uses a docker-stack.yml file, much like the docker-compose.yml files designed to be used with the docker-compose tool, which use Compose v2. One of the biggest differences you'll run into when starting services with docker stack deploy over docker-compose up/down is that docker swarm creates a Routing Mesh for you, where as with docker-compose networks and containers have to be explicitly created and linked. In swarm mode, the link: is no longer needed. Services can be included in the same stack file and, by default, be created in the same network stack at deploy time, allowing docker containers to call each other by service name. This network can then be used by other stacks and future services by calling it in the stack file and assigning a service to it. This makes it easy to keep containers on their own isolated network or to cluster certain services like metrics and logging tools together on the same network.
Here is a Compose v3 docker-stack.yml file for this project that will start three services: Grafana, Prometheus server, and Prometheus node-exporter.
docker-stack.yml
version: '3'

services:

  exporter:
    image: prom/node-exporter:latest
    ports:
      - '9100:9100'
    volumes:
      - /sys:/host/sys:ro
      - /:/rootfs:ro
      - /proc:/host/proc:ro
    deploy:
      mode: global

  prometheus:
    image: prom/prometheus:latest
    ports:
      - '9090:9090'
    volumes:
      - ./data/etc/prometheus.yml:/etc/prometheus/prometheus.yml:ro
      - ./data/prometheus:/prometheus:rw
    deploy:
      mode: replicated
      replicas: 1

  grafana:
    image: grafana/grafana
    ports:
      - "3000:3000"
    volumes:
      - ./data/grafana:/var/lib/grafana:rw
    deploy:
      mode: replicated
      replicas: 1
Directory creation needs to be done before deploying this stack. A Makefile has been included to handle config, build, deploy, destroy operations and should be used as a reference for the commands that will build this thing.
make help

config:    Copy prometheus.yml to config dir
dir:       Create directories
update:    Pull latest docker images
deploy:    Deploy to docker swarm
destroy:   Docker stack rm && rm -rf data
help:      This help dialog
With what's in the source code the stack can be started with:
sudo make
Browse to the Prometheus node-exporter docs up on github and you'll see a few lines at the bottom of the readme that say how to run this in docker that look like this.
docker run -d \
  --net="host" \
  --pid="host" \
  quay.io/prometheus/node-exporter
Start by creating the stack file with just this entry. Take the image name from the docs and add it the stack file. The volumes in the stack file are mounted for prometheus to read. deploy: mode: global is saying that this service will be started on every node in the swarm cluster. Outputs to localhost:9100/
docker-stack.yml
version: '3'

services:

  exporter:
    image: prom/node-exporter:latest
    ports:
      - '9100:9100'
    volumes:
      - /sys:/host/sys:ro
      - /:/rootfs:ro
      - /proc:/host/proc:ro
    deploy:
      mode: global
Start this up with the docker stack deploy command
docker stack deploy -c docker-stack.yml monitor

Creating network monitor_default
Creating service monitor_exporter
This can also be kicked off with the Makefile
make deploy

Updating service monitor_exporter (id: ivbddqpnjr7sdxre0gzopney9)
Check the service
docker service ps monitor_exporter

ID                  NAME                                         IMAGE                       NODE                DESIRED STATE       CURRENT STATE                ERROR               PORTS
cp7o7s9t33s6        monitor_exporter.76g7crzb0hk6jp9zysvegmupy   prom/node-exporter:latest   localhost           Running             Running about a minute ago
Check the logs
docker service logs monitor_exporter
...
...
monitor_exporter.0.cp7o7s9t33s6@localhost    | time="2018-03-28T08:14:47Z" level=info msg="Listening on :9100" source="node_exporter.go:76"
Browse localhost:9100/ and check it out.

Next, start up the Prometheus Server. This will scrape the exporter at a (10 second interval) set in the prometheus.yml configuration file. This file will be configured locally and copied to the image as a volume at run time. Volumes will also be used for persistent tsdb data in case of a container restart or failure.
docker-stack.yml
prometheus:
  image: prom/prometheus:latest
  ports:
    - '9090:9090'
  volumes:
    - ./data/etc/prometheus.yml:/etc/prometheus/prometheus.yml:ro
    - ./data/prometheus:/prometheus:rw
  deploy:
    mode: replicated
    replicas: 1
Prepare directories for mounting docker volumes. These will need read/write permissions for the default prometheus container user, which is nobody:nobody.
DATA_DIR="./data"

mkdir -p \
  "$DATA_DIR/etc" \
  "$DATA_DIR/grafana" \
  "$DATA_DIR/prometheus"

chmod 777 "$DATA_DIR/prometheus"
chown -R nobody:nobody "$DATA_DIR/prometheus"
Volumes are configured in the docker-stack.yml file. The first one is where prometheus will write it's database to. Secondly, prometheus mounts the prometheus.yml file which will come in handy later, when I start deploying this with jenkins later, because it let's me edit this file and reconfigure prometheus at deploy time.
- ./data/prometheus:/prometheus:rw
- ./data/etc/prometheus.yml:/etc/prometheus/prometheus.yml:ro
Check out your prometheus.yml file and make sure the exporter is added as a scrape target. This is how targets will be added in the future. Like Cadvisor and mysql-exporter.
prometheus.yml
global:
  scrape_interval:     30s # Set the scrape interval to every 15 seconds. Default is every 1 minute.
  evaluation_interval: 30s # Evaluate rules every 15 seconds. The default is every 1 minute.
  # scrape_timeout is set to the global default (10s).

# Alertmanager configuration
alerting:
  alertmanagers:
  - static_configs:
    - targets:
      # - alertmanager:9093

# Load rules once and periodically evaluate them according to the global 'evaluation_interval'.
rule_files:
  # - "first_rules.yml"
  # - "second_rules.yml"

# A scrape configuration containing exactly one endpoint to scrape:
# Here it's Prometheus itself.
scrape_configs:
  # The job name is added as a label `job=<job_name>` to any timeseries scraped from this config.
  - job_name: 'prometheus'
    # metrics_path defaults to '/metrics'
    # scheme defaults to 'http'.
    static_configs:
    - targets:
      - localhost:9090

  # http://exporter:9100/metrics
  - job_name: prometheus-exporter
    scrape_interval: 10s
    metrics_path: "/metrics"
    static_configs:
    - targets:
       - exporter:9100
Use make to deploy and it will copy this config file to where it needs to go.
make config

config:
    @cp prometheus.yml $(DATA_DIR)/etc/prometheus.yml
With the prometheus server service added to the docker-stack.yml file and everything configured, redeploy the stack to add the new service.
docker stack deploy -c docker-stack.yml monitor

Creating service monitor_prometheus
Updating service monitor_exporter (id: ivbddqpnjr7sdxre0gzopney9)
Browse to localhost:9090/targets to verify connectivity.
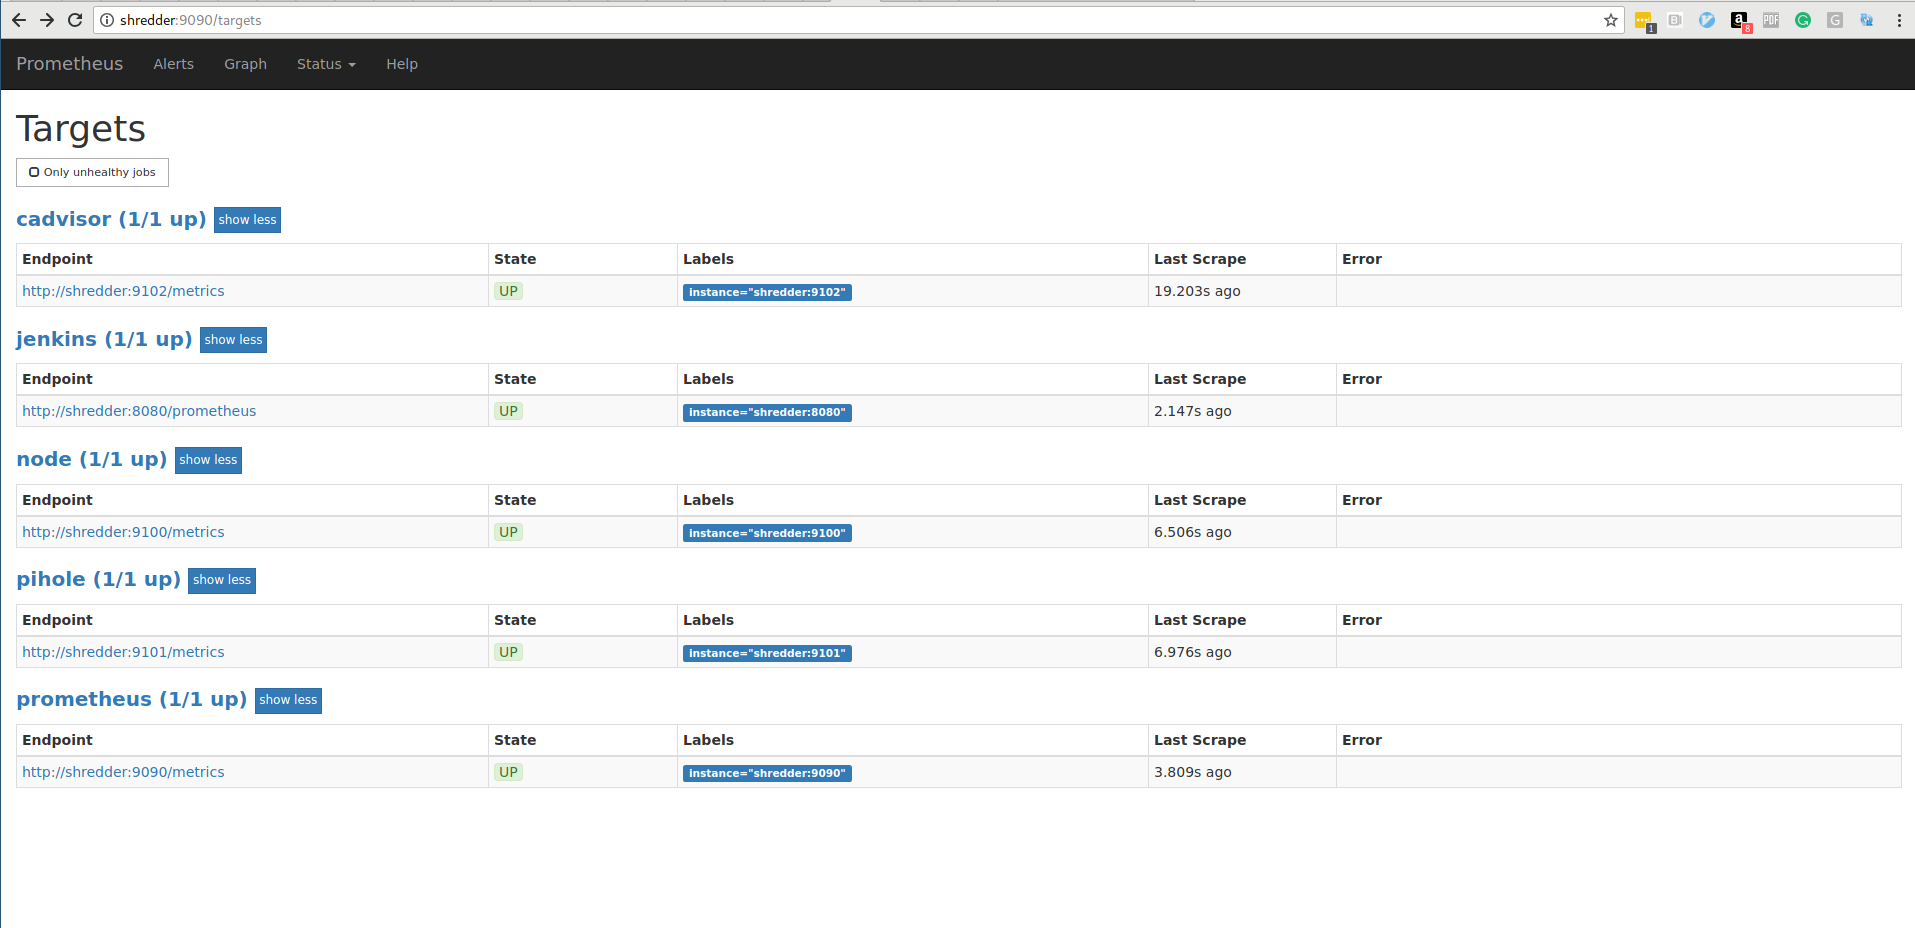
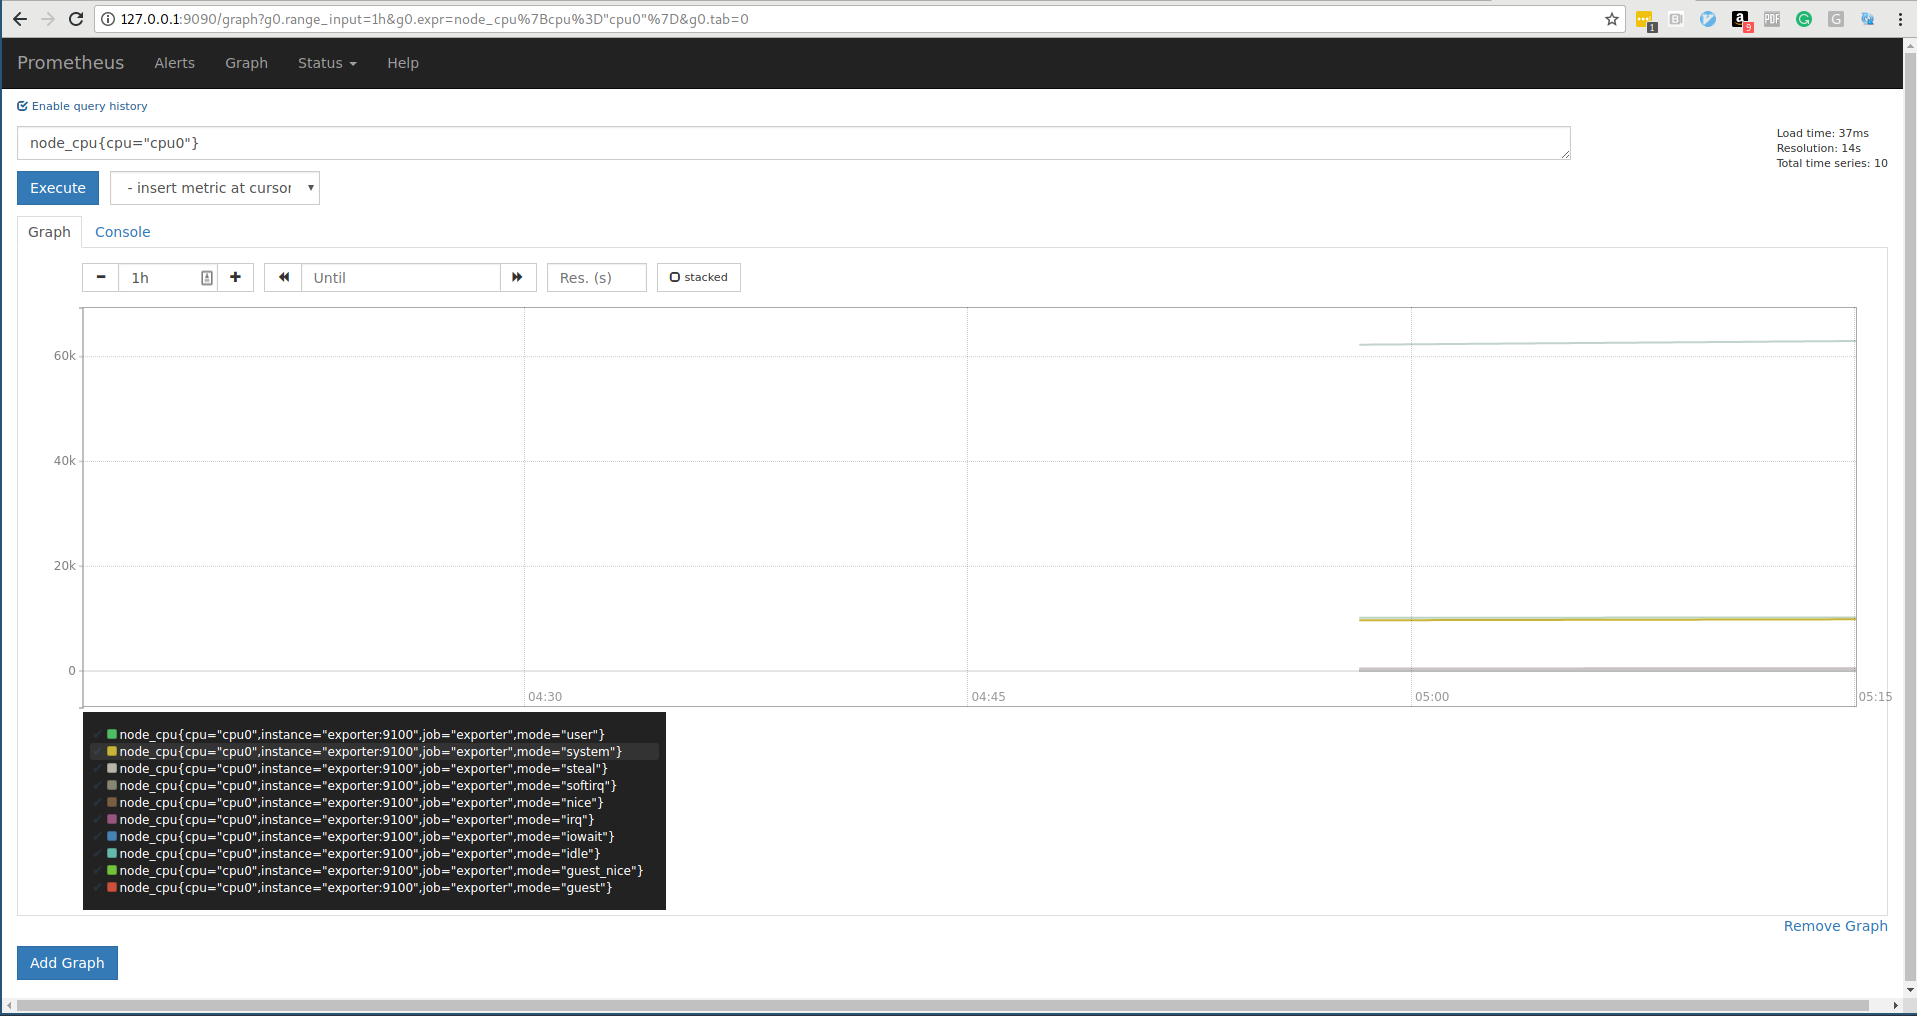
That the server successfully scraping system data, it's now possible to query the tsdb
node_cpu{cpu="cpu0"}
node_cpu{cpu="cpu0",mode="idle"}
etc...
With Prometheus up and running, it's time to start Grafana. A volume is created for persistent data. Will output to localhost:3000/
docker-stack.yml
grafana:
  image: grafana/grafana
  ports:
    - "3000:3000"
  volumes:
    - ./data/grafana:/var/lib/grafana:rw
  deploy:
    mode: replicated
    replicas: 1
Deploy to start Grafana
docker stack deploy -c docker-stack.yml monitor

Updating service monitor_exporter (id: ivbddqpnjr7sdxre0gzopney9)
Updating service monitor_prometheus (id: q4f07qz2tk3dvic9kc21sa3kq)
Creating service monitor_grafana
Browse to localhost:3000/login
The default user and password are: admin admin

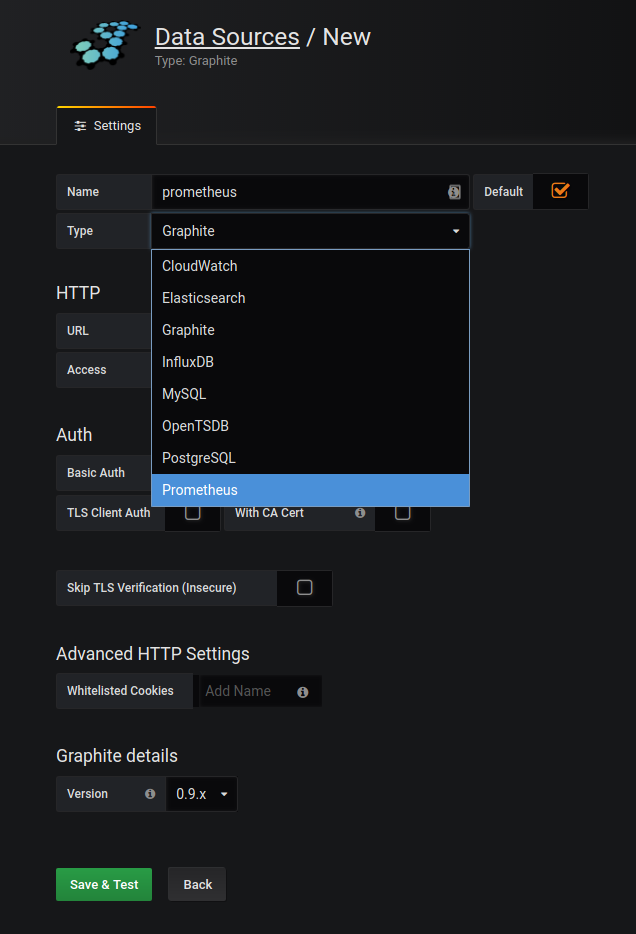
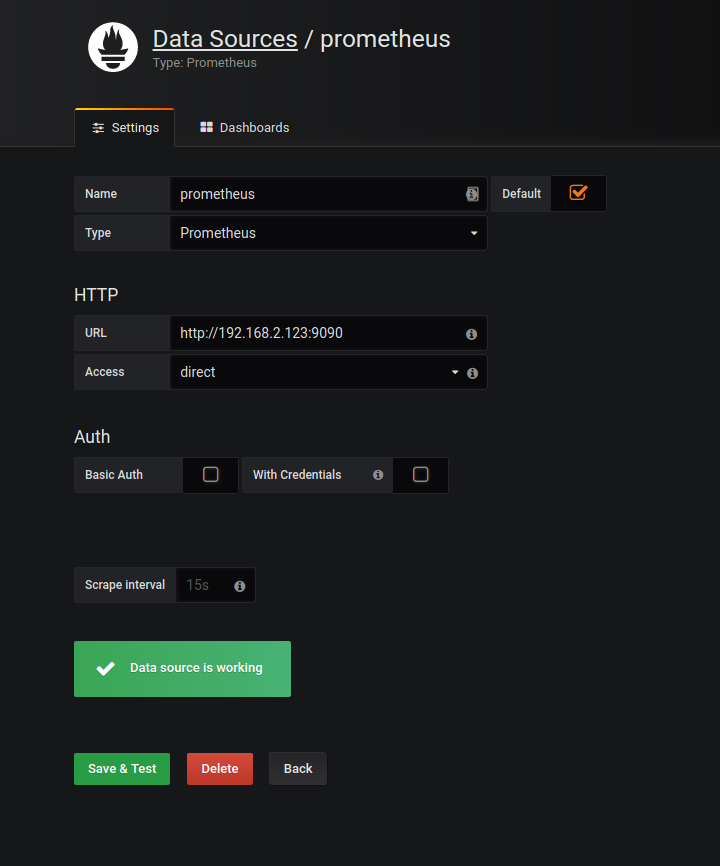
Add a data source

Chose prometheus from the drop down
I used the IP from the host machine in this example
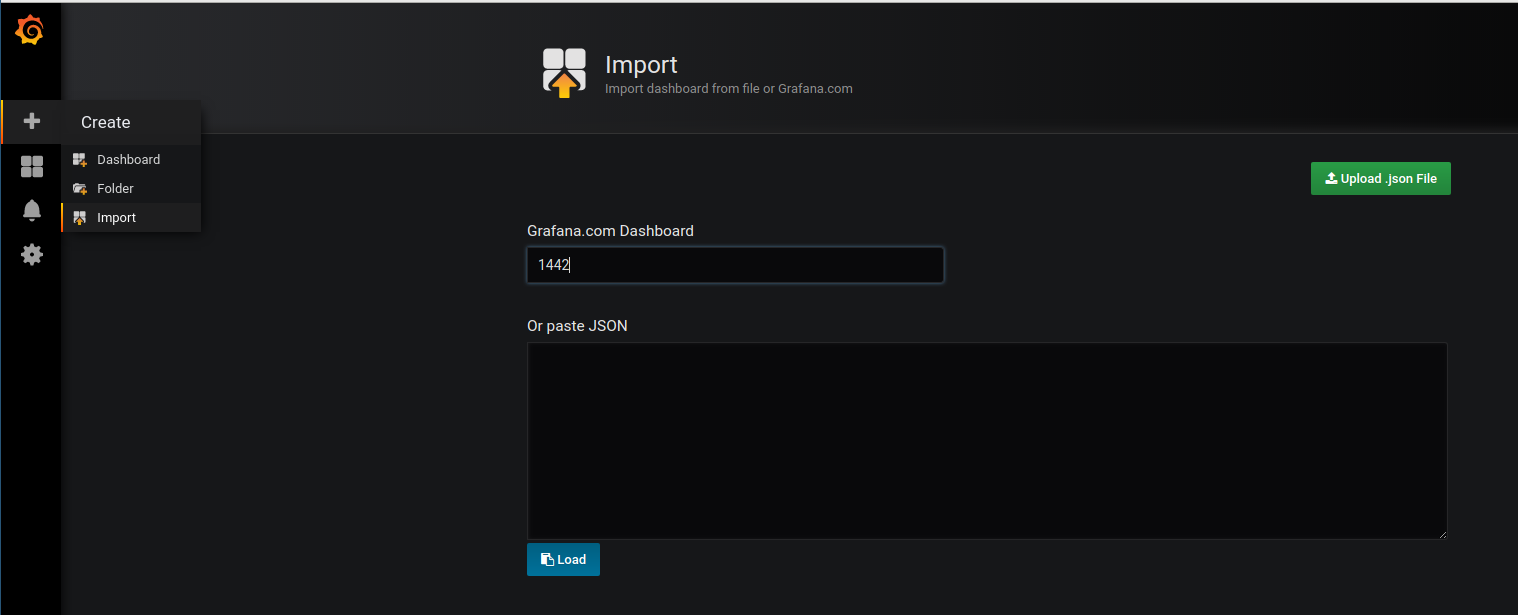
Go to grafana.com/dashboards to check out the thousands of pre-made dashboards that are out there and find one that will work as a template to build on. A good one to start with in this project is the node exporter metrics on docker swarm mode dashboard or 1442
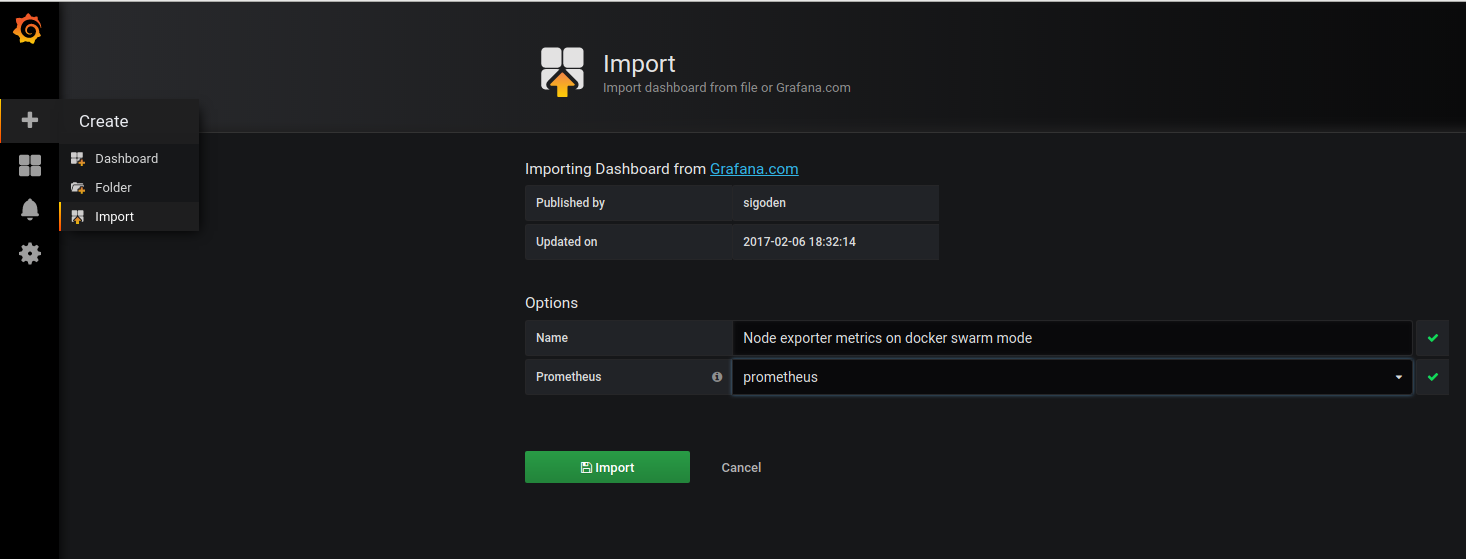
Import this dashboard to Grafana
Chose prometheus as data source and hit Import
And dashboard
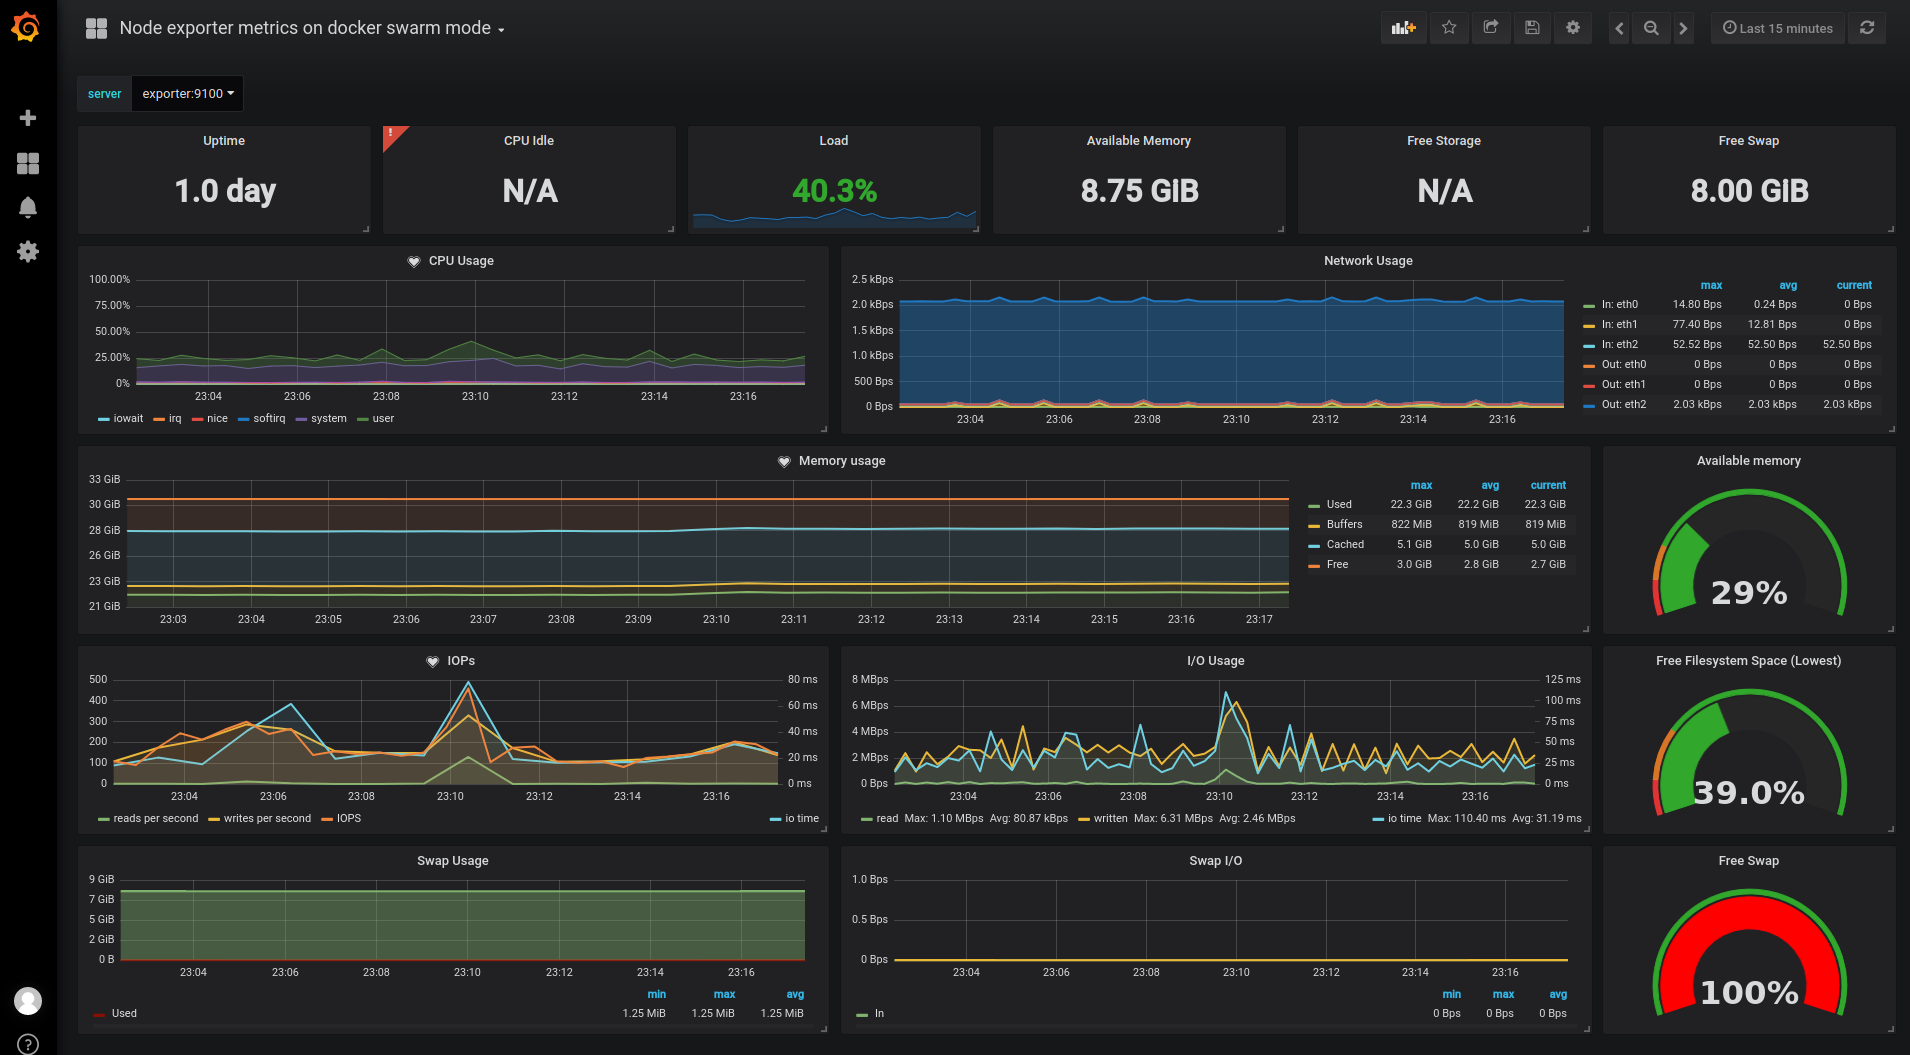
With that, a very flexible monitoring system has been established across the swarm cluster! A lot can be done to add to it easily, with new data sources and dashboards.
Bring it all down with
sudo make destroy

Removing service monitor_exporter
Removing service monitor_grafana
Removing service monitor_prometheus
Removing network monitor_default
