![]()
The axis component renders human-readable reference marks for scales. This alleviates one of the more tedious tasks in visualizing data.
Human-readable reference marks for scales.
Home Page: https://d3js.org/d3-axis
License: ISC License
![]()
The axis component renders human-readable reference marks for scales. This alleviates one of the more tedious tasks in visualizing data.


For months with 31 days, it is affecting the scale of the axis. This doesn't happen with 30 days or 28.
React and typescript, versions:
"d3": "^5.7.0"

"@types/d3": "^5.5.0",
"@types/d3-array": "^1.2.4",
"@types/d3-shape": "^1.2.2",
I am trying to integrate d3 axis into a react-native application.
d3 shape API is quite good in the sense that it gives back the raw path data which could be directly used with react-native ART api.
However d3-axis doesn't have similar isolation. it relies on knowledge of DOM to setup the path correctly. It would be nice to have an API to get those axis, ticks and labels path directly so that it can be used with any compatible rendering methods.
I have a chart with linear scale axis.
Now if I want to have integers only on axis, I have to override scale.ticks() method which isn't an elegant way to do that:
    const _ticks = y.ticks;
    y.ticks = (...args) => {
        const ticks = _ticks.apply(y, args);
        return ticks.filter(a => Math.floor(a) === a);
    };
Any ideas how to improve tick generation customization?
Maybe ticks generator function as an option of axis, then having built-in multiple ticks generator functions?
When I try to call the axis on a transition, I get an infinitely repeating error:
329d3-transition.v0.2.js:308 Uncaught TypeError: interpolate is not a function
(anonymous function) @ d3-transition.v0.2.js:308
tween @ d3-transition.v0.2.js:347
start @ d3-transition.v0.2.js:120
schedule @ d3-transition.v0.2.js:69
r @ d3-timer.v0.4.min.js:1
u @ d3-timer.v0.4.min.js:1
The minimal example code:
var scale = d3_scale.scaleLinear().range([0, 400])
var axis = d3_axis.axisBottom().scale(scale)

d3_selection.select('#update').on('click', update)

update()

function update() {
  var t = d3_transition.transition().duration(2000)

  scale.domain([0, Math.random() * 100])

  d3_selection.select('#example')
     .transition(t)
    .call(axis)
}
Here's an example showing the issue (press update to cause the error) https://jsfiddle.net/obsrwzdc/
Hi, it would be nice to have an api for hiding domain line. Sometimes axis on a side doesn't need to show domain line, just values. Currently it is possible to hide it with css, but it would be nicer to not render it in a first place.
Thank you
Here's a reproduction of the issue: http://bl.ocks.org/guilhermesimoes/af7ef9fe50c7c71b2165
Just switch the scale to Log10.
You can see that this does not happen in the latest release of D3: http://bl.ocks.org/guilhermesimoes/15ed216d14175d8165e6
I believe it should read "a d3 global is exported", like the rest of the v4 components.
Without having the orient set, if I'm passed an anonymous axis object, I cannot inspect to see what orientation it is at.
If I wanted to transform containing elements based on orientation, there's no way to do that.
Added a PR for this #17.
An axis that uses a date scale (d3.scaleTime) and has a specified number of ticks (.ticks(6)) is apparently mislabelled. All the ticks are labelled with the string "6".
Is there a way to right-align the tick text when creating a right axis via axisRight()?
I'm currently rendering a right axis on my graph like so:
  root
    .attr("class", "y gap-axis")
    .attr("margin-top", margin.top)
    .attr("transform", `translate(${width})`)
    .call(
      d3.axisRight(barYScale)
        .tickPadding(-1),
    );
}
and I get results like so:

but I want the numbers to be right-aligned.
If calling axis in transition while another axis transition is in place, there are errors in console:
Error: attribute transform: Expected number, "translate(NaN,0)".
Here is the example (click Different data button and see console errors output):
http://plnkr.co/edit/6dFgUrzAk3PMpaCTVhkq?p=preview
Hi,
What is the substitution of tickSubdivide in d3.v4? Thank you.
Hi,
It's quite common now to use a JS framework such as React or Vue to render the elements instead of D3.js DOM manipulation. While it's possible with most of the packages, d3-axis doesn't support this kind of operation which is useful not only for consistency and reactivity but also for rendering of labels outside of svg to keep font rendering and size consistent with the remaining page elements even when chart is being scaled.
Is it possible to make d3-axis more friendly for select-less operation? E.g. provide methods to get ticks coordinates, line path etc. I would file a PR if I was sure how to do it right but I'm not, so could you either implement it or guide me on how this can be done?
JSFiddle: https://jsfiddle.net/u6mLuxpq/
I've noticed that if I take an existing axis that is horizontal (say axisBottom) and then re-call it with axisRight or axisLeft the tick marks all end up on an angle. For right now, my fix is to call select('g.ticks').remove() but I'm assuming that this isn't the ideal solution.
Hello!
I've found an issue when using custom tickValues on a Axis. X Axis on the attached example is using custom tickValues, and these values do not have the same behavior when a axis is not using custom tickValues (Y axis).
Example: https://bl.ocks.org/prrandrade/4b4027d709ea1fa02db032bfda90553d
This will allow us to define a default fill and stroke for ticks and the domain path, rather than requiring users to include these style rules:
.axis line {
  stroke: #000;
}

.axis path {
  fill: none;
  stroke: #000;
}
(I’m not 100% certain crispEdges should be included by default; it’s probably best to use make the defaults as minimal as possible, both for performance and to facilitate overrides.)
Related d3/d3#2102; this would also apply to the text-anchor used to position axis ticks.
What's the rational behind this? I know I can set my own tickFormat, but not when dynamically changing the time range (i.e zoom). It's a minor detail, I guess, but I find it very odd. To illustrate, the time axis may show [..., Sat 02, 12 PM, Feb 03, 12PM, Mon 04, ...]
Using the latest release (1.0.12), I was unable to produce axes, always getting the error Uncaught TypeError: setting getter-only property "top" when calling an axis function, e.g.
const years = [2019,2018,2017,2016,2015]
const margin = {top: 0, right: 60, bottom: 40, left: 0}
const Y = scaleLinear() // time axis
	.domain([Math.min(...years),Math.max(...years)])
	.range([0,height-margin.bottom])
svg.append('g')
	.attr('transform',`translate(${width-margin.right},0)`)
	.call(axisRight(Y)) // <-- it always failed right here
Reverting the package to 1.0.0 solved the problem with no change to my code.
Would it be feasible to optionally just return the html string instead of rendering directly to the DOM (or otherwise depending on the DOM at all)?
The README states
An outer tick size of 0 suppresses the square ends of the domain path, instead producing a straight line.
However, practically this is not exactly true. When setting a stroke on the .domain path, one can observe that the endpoints are not quite right, as in this example:

In this case, after setting tickSizeOuter(0), I would expect that the domain path ending would end up as a square end.
The path for the X axis domain is M0.5,0V0.5H867.5V0. When changing it manually to M0.5,0V0.5H867.5, the resulting rendered path is a straight line:

The solution would be to exclude the V0 part of the path when tickSizeOuter === 0 somewhere around axis.js#L92. The following bit of implementation would need to change:
    path
        .attr("d", orient === left || orient == right
            ? "M" + k * tickSizeOuter + "," + range0 + "H0.5V" + range1 + "H" + k * tickSizeOuter
            : "M" + range0 + "," + k * tickSizeOuter + "V0.5H" + range1 + "V" + k * tickSizeOuter);
The change might look something like this:
    path
        .attr("d", orient === left || orient == right
            ? "M" + k * tickSizeOuter + "," + range0 + "H0.5V" + range1 + (tickSizeOuter ? "H" + k * tickSizeOuter : "")
            : "M" + range0 + "," + k * tickSizeOuter + "V0.5H" + range1 + (tickSizeOuter? "V" + k * tickSizeOuter : ""));
Is this change something that would be desirable?
axis.tickValues([values])... If values is not specified, returns the current tick values, which defaults to null. ...
I would have expected, that once an axis is drawn (and has called scale.ticks()) calling axis.tickValues() would return me the cached continuous.ticks. However, since I did not previously set axis.tickValues(a_value), axis.tickValues() returns null. (I'm assuming that calling continuous.ticks() requires computation.)
I think this would involve changing this line to set tickValues as well as values
Line 48 in da24fba
Or expose a new method to get the current values. In the meantime I'll just call continuous.ticks.
By the way, why doesn't continuous.ticks have a <> which links to some line of code in the source?
I want to propose the idea of rendering axis in pure HTML (rather than SVG).
SVG is great for it's power, but I've found generally text manipulation/styling is generally much more difficult. With regular HTML I believe we could leverage things such as auto-truncation of long labels in CSS, simpler sizing of fonts etc.
Be interested to know thoughts on this (obviously would be a re-implementation of the renderer). I was taking a look at a Parallel Co-ordinates chart at the time and thinking there's quite a bit of work to be done with scaling and contrast to make the chart more accessible.
band.paddingOuter() will set band-padding-outer left and right with same value, how can I set it separately?
Currently I say:
range0 = range[0] + 0.5,
range1 = range[range.length - 1] + 0.5,
But wouldn’t this be better?
range0 = range[0] + 0.5,
range1 = range[range.length - 1] - 0.5,I am an absolute newbie to D3
I am able to follow and use the recipe of Rotated axis labels in v4 ( https://bl.ocks.org/d3noob/3c040800ff6457717cca586ae9547dbf )
However; if I apply pan/zoom to such plot, all labels vanish and even ticks do not move with the zoom or pan.
However; if the axis labels are kept without any special formatting of text-anchor and rotation etc, the zoom behavior for the axis works just fine.
Please let me know ( or point me to any example about ) how to use pan / zoom with rotated or formatted x axis labels.
(I have created same issue in d3/zoom (d3/d3-zoom#155))
Thanks in advance
-Mahesh
Line 146 in 15e56eb
Some attributes are re-set to the same values on pre-existing elements instead of setting once only on freshly added elements:
https://github.com/d3/d3-axis/blob/master/src/axis.js#L85-110
Profiler of MS Edge browser shows that some DOM operations in existing axis code take as much as 0.5 ms, which is large given the 16.7 ms total time bugdet. Firefox is slower, Chrome is faster, and the story on mobile devices may be totally different, but still.
A dirty hack shows significant increase in frame rate, it seems that setting attributes on text nodes is especially expensive:
While I added separate axisUp method for incremental updates, it's a proof of concept code to see if framerate can be improved. A cleaner approach of setting attributes only on what "enters" is certainly possible.
Also, grouping and stylesheet manipulation using CSS DOM can be used to avoid repeatedly setting the same attributes on added nodes. They can be inherited from parent element or defined once in declarations instead.
What do you think? Can we for example avoid setting .transform on many nodes, and set it once on a CSS group element or something like that?
Can I, for example, use a ScaleOrdinal where the range isn't a number list? I'm particularly concerned about this code: https://github.com/d3/d3-axis/blob/master/src/axis.js#L51
It wouldn’t be as configurable as SVG rendering, since you wouldn’t be able to apply a stylesheet or perform post-selection; and I definitely wouldn’t want to open the door to a million configuration options. (You can always overlay SVG on top of Canvas if you want to customize the appearance.)
A recent version of chrome appears to have delivered a change to their default user agent specification that implements the following rule;
https://www.w3.org/TR/SVG/styling.html#UAStyleSheet
Specifically the following appears to be new (not sure exactly when but last couple of chrome versions at least);
svg:not(:root), image, marker, pattern, symbol { overflow: hidden; }
Specifically the part that is interesting to this library is that svgs that are not at the root will now have their overflow hidden by default.
What this means is that the axisTop function will now no longer display unless you override that style because it works by using negative values for y which takes causes it to overflow (and therefore not display because of this new rule).
The following hopefully illustrates this better;
var scale = d3.scaleLinear().domain([0, 100]).range([0, 400]);

var axis = d3.axisBottom(scale);

d3.select("#axis-demo")
  .append("svg")
    .style('overflow', 'inherit') // previously you didn't need to do this, but now you do
    .attr("width", 400)
    .attr("height", 30)
  .append("g")
    .attr("transform", "translate(0,30)")
    .call(axis);
I don't think this is necessarily something to "fix" but I was wondering if you thought it was worth putting a quick note in the docs about this to save anyone else running into this? Happy to provide the PR if you agree.
I'm implementing a chart that has a sliding x axis.
I noticed that the axis labels that slide out of the chart are not removed from the DOM.
Why? How could I fix that to prevent the DOM growing indefinitely?
d3.rampHorizontal = function(x, color) {
  var size = 16;

  function ramp(g) {
    var image = g.selectAll("image").data([null]),
        xz = x.range(),
        x0 = xz[0],
        x1 = xz[xz.length - 1],
        canvas = document.createElement("canvas"),
        context = (canvas.width = x1 - x0 + 1, canvas.height = 1, canvas).getContext("2d");

    for (var i = x0; i <= x1; ++i) {
      context.fillStyle = color(x.invert(i));
      context.fillRect(i - x0, 0, 1, 1);
    }

    image = image.enter().append("image").merge(image)
        .attr("x", x0)
        .attr("y", -size)
        .attr("width", x1 - x0 + 1)
        .attr("height", size)
        .attr("preserveAspectRatio", "none")
        .attr("xlink:href", canvas.toDataURL());
  }

  ramp.position = function(_) {
    return arguments.length ? (x = _, ramp) : x;
  };

  ramp.color = function(_) {
    return arguments.length ? (color = _, ramp) : color;
  };

  ramp.size = function(_) {
    return arguments.length ? (size = +_, ramp) : size;
  };

  return ramp;
};I am trying to do some user action which allows to change the axis direction, and getting unexpected behaviour.
When empty the g axis element, then g_elm.call(d3.axisRight(y0)), the text-anchor should have changed to "start", but is not, text-anchor stays as "end". Result is tick text appears wrong.
jsfiddle here https://jsfiddle.net/ba9nohc4/1/
first button, keep g element. Keep g element, but clear children.
second button, remove the g element, and create new g element.
axisLeft = text-anchor = "end"
axisRight = text-anchor = "start"
the axis code does look like text-anchor is being run, but not being set.
Is something stopping the text-anchor being changed, or some other attribute on the g element that needs clearing before calling axisRight?
Same issue going from axisRight to axisLeft, expect text-anchor should change from 'start' to 'end'
I think the center func offset in axis.js is slightly off.
function center(scale) {
  var offset = scale.bandwidth() / 2;
  if (scale.round()) offset = Math.round(offset);
  return function(d) {
    return scale(d) + offset;
  };
}
Suppose bandwidth is 3. Then we expect the offset to be 1, to place it on the middle pixel. With the current implementation, you would get 1.5 or 2, depending on the rounding flag. I think the correct offset should be:
var offset = (scale.bandwidth() - 1) / 2;I've done an Y axis scaling slider. It worked fine with ticks(50) and my custom implementation minor tick hiding... But even though Y axis range had equal amounts of positive and negative, sometimes zero was not drawn as a major tick.
After doing custom calculation of tick values, I noticed that when 'tickValues' is called again it does not replace the previous ticks but rather draws an another set of ticks.
How about an improvement that when tickValues() is called with new data, it would replace the previously drawn ticks?
If I'd just remove those ticks like so:
d3.selectAll('.focus .axis--y1 .tick').remove();
yAxis.tickValues(yTickValues);
d3.selectAll('.focus .axis--y1 .tick')
    .filter(function (d, i) { return !isMajorTick(i); })
    .classed("minor", true);
It doesn't work as the removal operation takes time...and implementing an event listener callback for chaining this these further operations would seem a too cumbersome solution.
This would make d3-axis work automatically against a dark background in cases where the CSS color is contrasting, and would provide an easier mechanism to restyle the axis.
I included changes for this script to work with d3 version 4:
d3.slider = function module() {
  "use strict";

  var div, min = 0, max = 100, svg, svgGroup, value, classPrefix, axis,
  height=40, rect,
  rectHeight = 12,
  tickSize = 6,
  margin = {top: 25, right: 25, bottom: 15, left: 25},
  ticks = 0, tickValues, scale, tickFormat, dragger, width,
  range = false,
  callbackFn, stepValues, focus;

  function slider(selection) {
    selection.each(function() {
      div = d3.select(this).classed('d3slider', true);
      width = parseInt(div.style("width"), 10)-(margin.left
                                                + margin.right);

      value = value || min;
      scale = d3.scaleLinear().domain([min, max]).range([0, width])
      .clamp(true);

      // SVG
      svg = div.append("svg")
      .attr("class", "d3slider-axis")
      .attr("width", width + margin.left + margin.right)
      .attr("height", height + margin.top + margin.bottom)
      .append("g")
      .attr("transform", "translate(" + margin.left +
            "," + margin.top + ")");

      // Range rect
      svg.append("rect")
      .attr("class", "d3slider-rect-range")
      .attr("width", width)
      .attr("height", rectHeight);

      // Range rect
      if (range) {
        svg.append("rect")
        .attr("class", "d3slider-rect-value")
        .attr("width", scale(value))
        .attr("height", rectHeight);
      }

      // Axis
      var axis = d3.axisBottom()
      .scale(scale);

      if (ticks != 0) {
        axis.ticks(ticks);
        axis.tickSize(tickSize);
      } else if (tickValues) {
        axis.tickValues(tickValues);
        axis.tickSize(tickSize);
      } else {
        axis.ticks(0);
        axis.tickSize(0);
      }
      if (tickFormat) {
        axis.tickFormat(tickFormat);
      }

      svg.append("g")
      .attr("transform", "translate(0," + rectHeight + ")")
      .call(axis)
      //.selectAll(".tick")
      //.data(tickValues, function(d) { return d; })
      //.exit()
      //.classed("minor", true);

      var values = [value];
      dragger = svg.selectAll(".dragger")
      .data(values)
      .enter()
      .append("g")
      .attr("class", "dragger")
      .attr("transform", function(d) {
        return "translate(" + scale(d) + ")";
      })

      var displayValue = null;
      if (tickFormat) {
        displayValue = tickFormat(value);
      } else {
        displayValue = d3.format(",.0f")(value);
      }

      dragger.append("text")
      .attr("x", 0)
      .attr("y", -15)
      .attr("text-anchor", "middle")
      .attr("class", "draggertext")
      .text(displayValue);

      dragger.append("circle")
      .attr("class", "dragger-outer")
      .attr("r", 10)
      .attr("transform", function(d) {
        return "translate(0,6)";
      });

      dragger.append("circle")
      .attr("class", "dragger-inner")
      .attr("r", 4)
      .attr("transform", function(d) {
        return "translate(0,6)";
      });


      // Enable dragger drag
      var dragBehaviour = d3.drag();
      dragBehaviour.on("drag", slider.drag);
      dragger.call(dragBehaviour);

      // Move dragger on click
      svg.on("click", slider.click);

    });
  }

  slider.draggerTranslateFn = function() {
    return function(d) {
      return "translate(" + scale(d) + ")";
    }
  }

  slider.click = function() {
    var pos = d3.event.offsetX || d3.event.layerX;
    slider.move(pos);
  }

  slider.drag = function() {
    var pos = d3.event.x;
    slider.move(pos+margin.left);
  }

  slider.move = function(pos) {
    var l,u;
    var newValue = scale.invert(pos - margin.left);
    // find tick values that are closest to newValue
    // lower bound
    if (stepValues != undefined) {
      l = stepValues.reduce(function(p, c, i, arr){
        if (c < newValue) {
          return c;
        } else {
          return p;
        }
      });

      // upper bound
      if (stepValues.indexOf(l) < stepValues.length-1) {
        u = stepValues[stepValues.indexOf(l) + 1];
      } else {
        u = l;
      }
      // set values
      var oldValue = value;
      value = ((newValue-l) <= (u-newValue)) ? l : u;
    } else {
      var oldValue = value;
      value = newValue;
    }
    var values = [value];

    // Move dragger
    svg.selectAll(".dragger").data(values)
    .attr("transform", function(d) {
      return "translate(" + scale(d) + ")";
    });

    var displayValue = null;
    if (tickFormat) {
      displayValue = tickFormat(value);
    } else {
      displayValue = d3.format(",.0f")(value);
    }
    svg.selectAll(".dragger").select("text")
    .text(displayValue);

    if (range) {
      svg.selectAll(".d3slider-rect-value")
      .attr("width", scale(value));
    }

    if (callbackFn) {
      callbackFn(slider);
    }
  }

  // Getter/setter functions
  slider.min = function(_) {
    if (!arguments.length) return min;
    min = _;
    return slider;
  };

  slider.max = function(_) {
    if (!arguments.length) return max;
    max = _;
    return slider;
  };

  slider.classPrefix = function(_) {
    if (!arguments.length) return classPrefix;
    classPrefix = _;
    return slider;
  }

  slider.tickValues = function(_) {
    if (!arguments.length) return tickValues;
    tickValues = _;
    return slider;
  }

  slider.ticks = function(_) {
    if (!arguments.length) return ticks;
    ticks = _;
    return slider;
  }

  slider.stepValues = function(_) {
    if (!arguments.length) return stepValues;
    stepValues = _;
    return slider;
  }

  slider.tickFormat = function(_) {
    if (!arguments.length) return tickFormat;
    tickFormat = _;
    return slider;
  }

  slider.value = function(_) {
    if (!arguments.length) return value;
    value = _;
    return slider;
  }

  slider.showRange = function(_) {
    if (!arguments.length) return range;
    range = _;
    return slider;
  }

  slider.callback = function(_) {
    if (!arguments.length) return callbackFn;
    callbackFn = _;
    return slider;
  }

  slider.setValue = function(newValue) {
    var pos = scale(newValue) + margin.left;
    slider.move(pos);
  }

  slider.mousemove = function() {
    var pos = d3.mouse(this)[0];
    var val = slider.getNearest(scale.invert(pos), stepValues);
    focus.attr("transform", "translate(" + scale(val) + ",0)");
    focus.selectAll("text").text(val);
  }

  slider.getNearest = function(val, arr) {
    var l = arr.reduce(function(p, c, i, a){
      if (c < val) {
        return c;
      } else {
        return p;
      }
    });
    var u = arr[arr.indexOf(l)+1];
    var nearest = ((value-l) <= (u-value)) ? l : u;
    return nearest;
  }

  slider.destroy = function() {
    div.selectAll('svg').remove();
    return slider;
  }

  return slider;

};D3: 4.7.4
Chrome: 57.0.2987.133 (64-bit)
OS: Win 10x64, Ubuntu 16.10
We are transitioning to D3 v4 and have noticed that the axis containers are receiving a default font and size, font-size="10" font-family="sans-serif", which is clobbering our desired inherited styles.
Is this expected behaviour?
Due to d3/d3-transition#40, when you transition.call(axis), and the transition has multiple elements with different timing parameters, only the timing parameters from the first element are observed.
Is there an option to show extrema ticks (in my case, the origin tick would suffice).
As you can see below, my y axis ticks are fine, except that I'd like a tick going through my x-axis. The domain goes from 388 to 617, and I'd like to keep the same ticks as shown on the graph + a new tick at position 388.
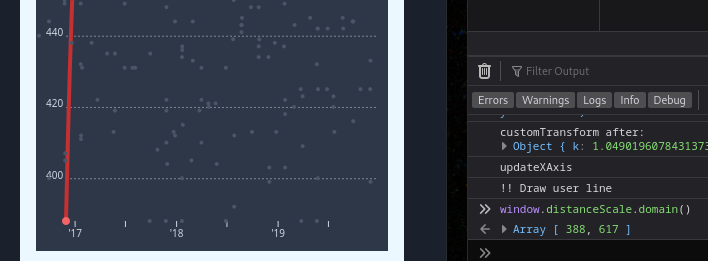
I will use tickValues for the time being and manually calculate all the ticks needed. Hopefully you can tell me about a simpler way :)
Safari often botches shape-rendering: crispEdges, drawing a two-pixel-wide line even though the stroke-width is one pixel. Also, in the common case where the coordinates are rounded, using a half-pixel offset should produce crisp edges even without shape-rendering.
I think we should use zero-based indexing for coordinates, such that y = 0 means the topmost pixel and x = 0 means the leftmost pixel, and therefore offsetting by +0.5 (not -0.5) in both x and y.
I noticed that the suggested count argument for the number of ticks for the .ticks() method does not change the tick behavior when called on an axis created from a scaleBands scale. I think this makes sense, but it may be helpful to mention this in the documentation.
I found this issue when graphing a bar chart with many dates along the X axis. The dates would overlap, and .ticks() was not changing the result. I see that the tickValues are assigned to the scale's domain here when the scale has no ticks function, which makes sense why I was not seeing any changes when providing an argument to .ticks().
I was able to find this post where a solution is directly assigning tickValues based off a filtered scale domain, which helped me.
The docs are currently as follows:
. . . most commonly, the arguments are a suggested count for the number of ticks (or a time interval for time scales) . . .
This makes perfect sense, but it may be helpful to include the behavior for other scales as well. Would it be worthwhile to mention the behavior of the ticks method for scaleBands scales and any other outliers?
How can you get write the manual so is not use in examples? I follow your instruction in VS code, but it's still erroring scale is not defined.
<script src="https://d3js.org/d3-axis.v1.min.js"></script> <script src="https://d3js.org/d3.v5.min.js"></script><script>
var axis = d3.axisLeft(scale);
d3.select("body").append("svg")
.attr("width", 1440)
.attr("height", 300)
.append("g")
.attr("transform", "translate(0,30)")
.call(axis);
</script>
When I tried to add dir="rtl" in body tag at this example Line with Missing Data
hint: I replace "https://d3js.org/d3.v4.js" with "//d3js.org/d3.v4.0.0-alpha.4.min.js"-
The following error appears:

First time using an axis results in correct ticks, but upon modifying the underlying scale, selecting the same axis, and calling it again, what happens is new ticks are created, but the old ones are not removed.
EX:
// Create svg, etc...
var svg = d3.select("body").append("svg")/* margin conventions, etc */ .append("g")


var y = d3.scaleLinear().rangeRound([height, 0]).domain([0,1]);
var yAxis = d3.axisRight(y).tickFormat(d3.format(".2s"))

// Works
svg.append("g")
  .attr("class", "y axis")
  .attr("transform", "translate(" + width + ",0)")
  .call(yAxis)

// updating the scales domain
var max = 16000;
y.domain([0, max]);

// issues occur
 svg.select(".y.axis").call(yAxis);
It might be nice to have more configuration options built-in. All of these are possible using post-selection, but that approach is likely more tedious than having supported configuration, especially if you want it to work with transitions.
This options are demonstrated in this example scatterplot:
A declarative, efficient, and flexible JavaScript library for building user interfaces.
🖖 Vue.js is a progressive, incrementally-adoptable JavaScript framework for building UI on the web.
TypeScript is a superset of JavaScript that compiles to clean JavaScript output.
An Open Source Machine Learning Framework for Everyone
The Web framework for perfectionists with deadlines.
A PHP framework for web artisans
Bring data to life with SVG, Canvas and HTML. 📊📈🎉
JavaScript (JS) is a lightweight interpreted programming language with first-class functions.
Some thing interesting about web. New door for the world.
A server is a program made to process requests and deliver data to clients.
Machine learning is a way of modeling and interpreting data that allows a piece of software to respond intelligently.
Some thing interesting about visualization, use data art
Some thing interesting about game, make everyone happy.
We are working to build community through open source technology. NB: members must have two-factor auth.
Open source projects and samples from Microsoft.
Google ❤️ Open Source for everyone.
Alibaba Open Source for everyone
Data-Driven Documents codes.
China tencent open source team.