
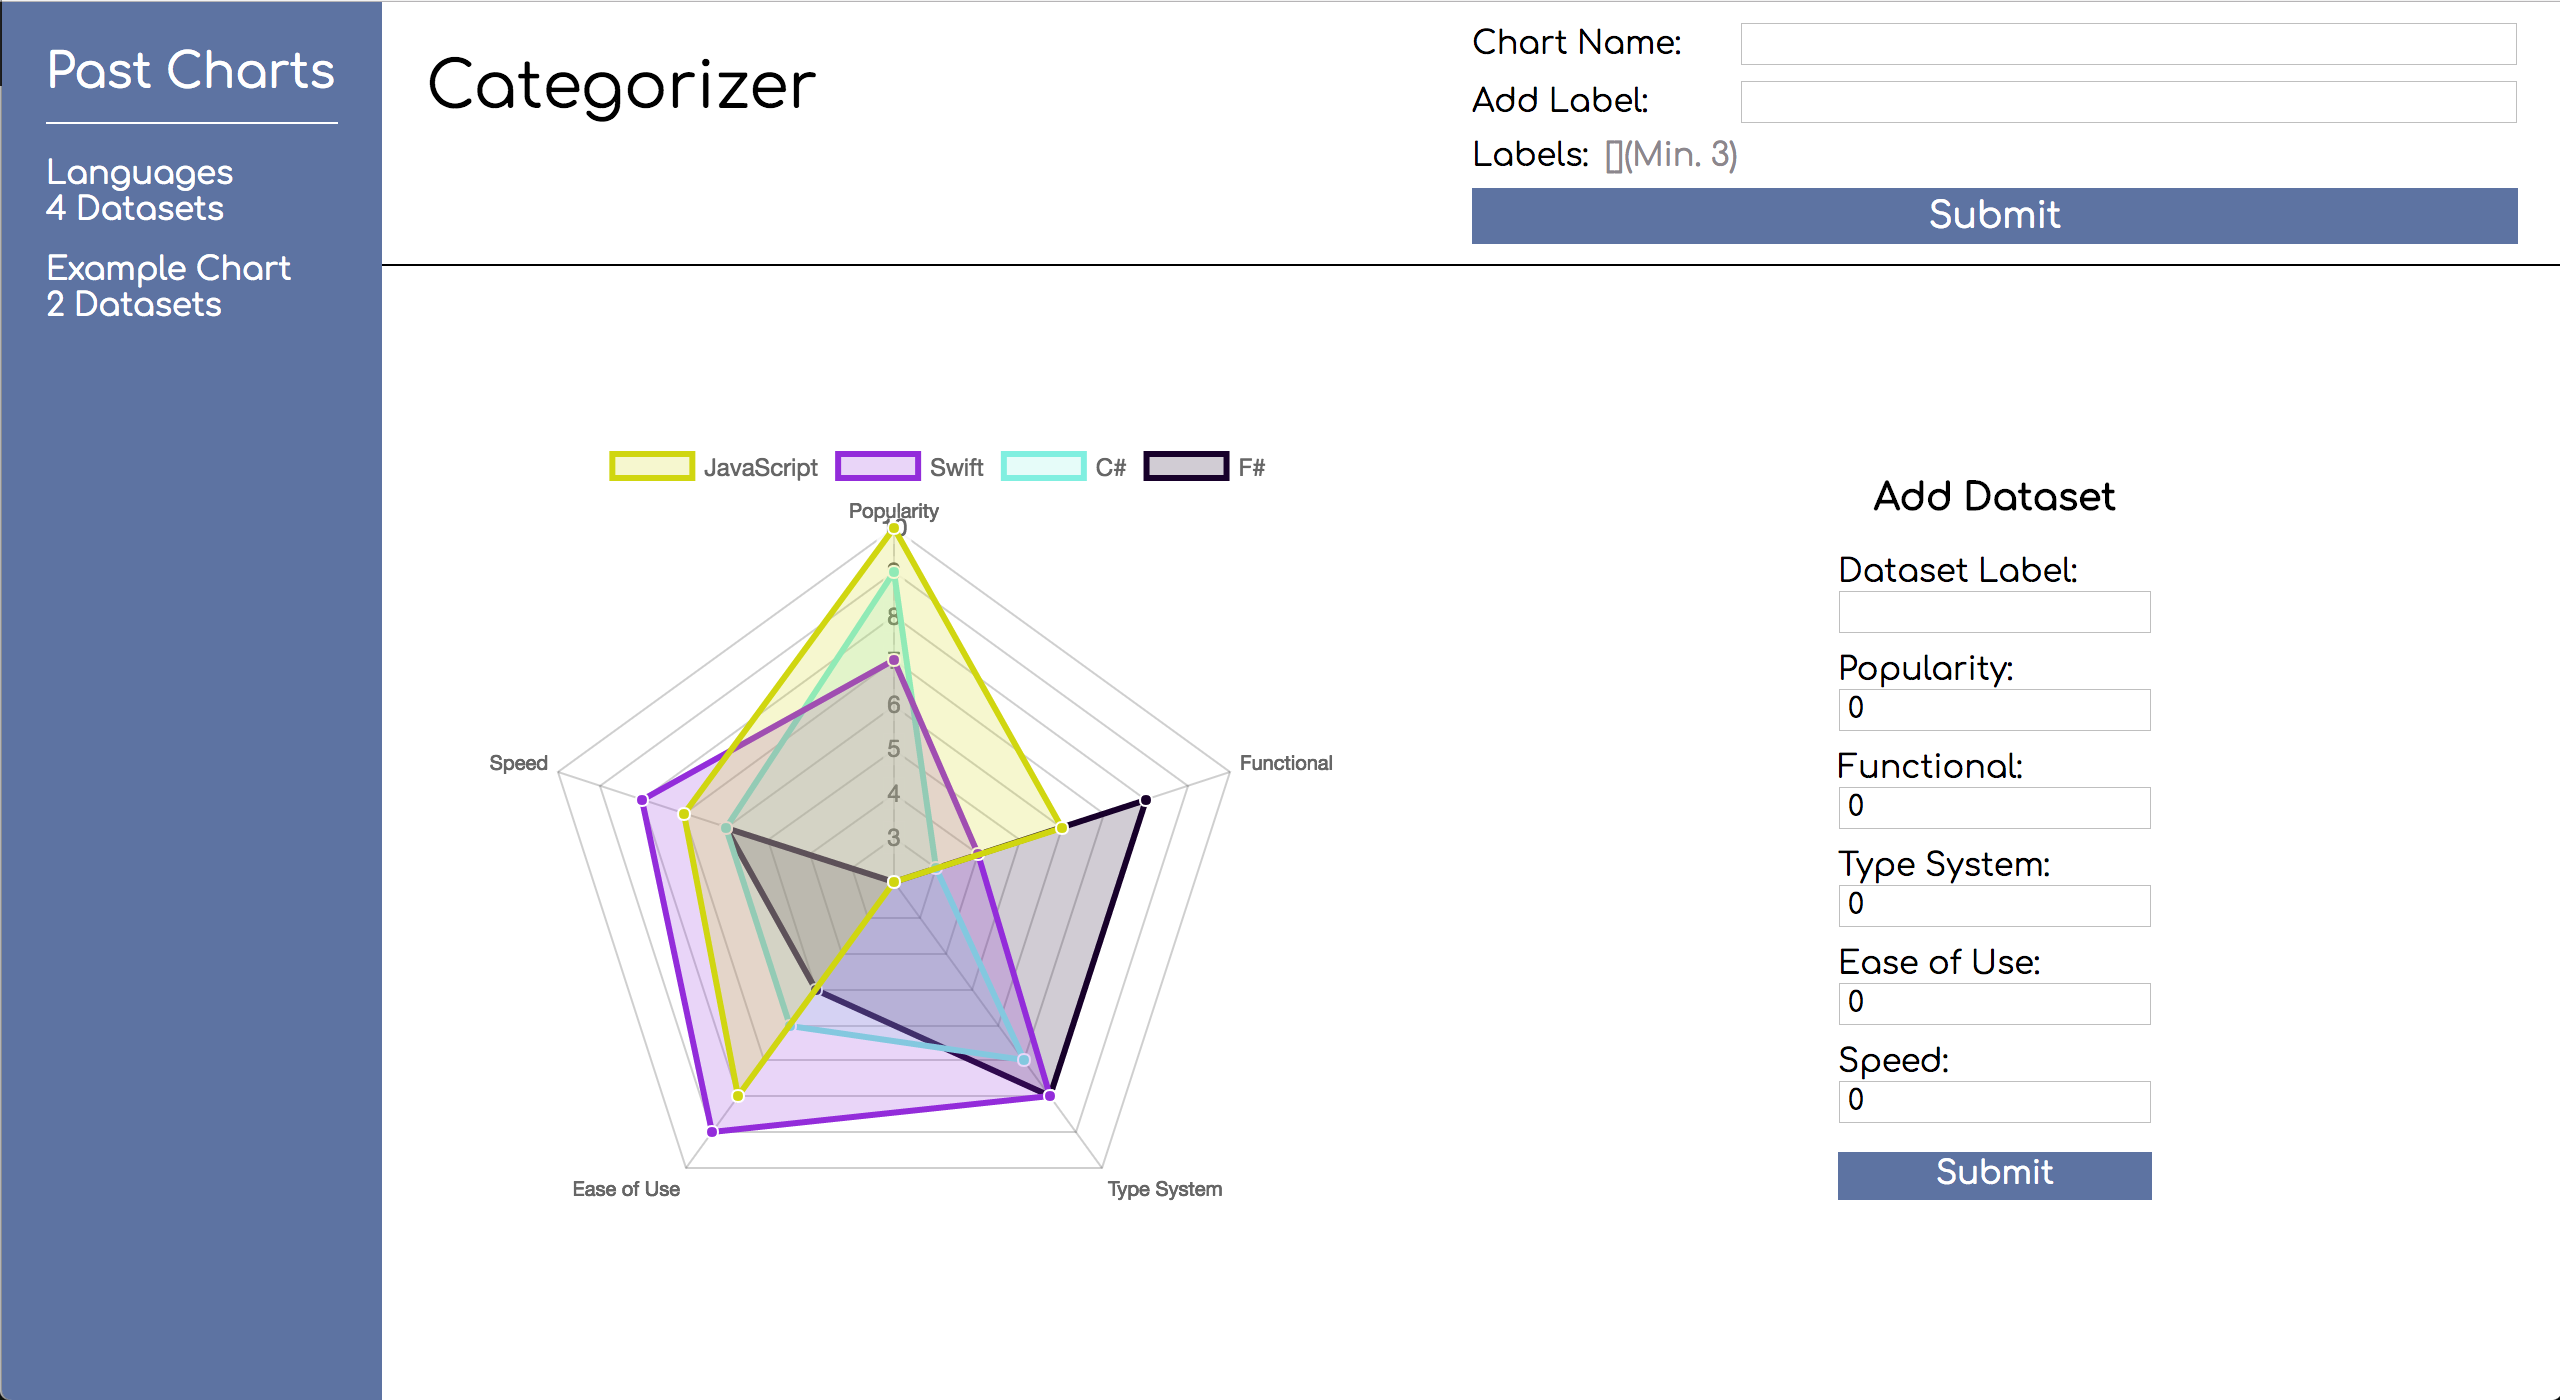
During this project we'll be building a web application that allows for easily categorizing information in radar charts. Users will be able to keep track of multiple categories, each category having multiple data sets. To keep track of this data and pass it to the correct components we'll make heavy use of Redux and React Redux.
This diagram can serve as a useful reference point on how data is flowing in the application if you ever get a little lost.
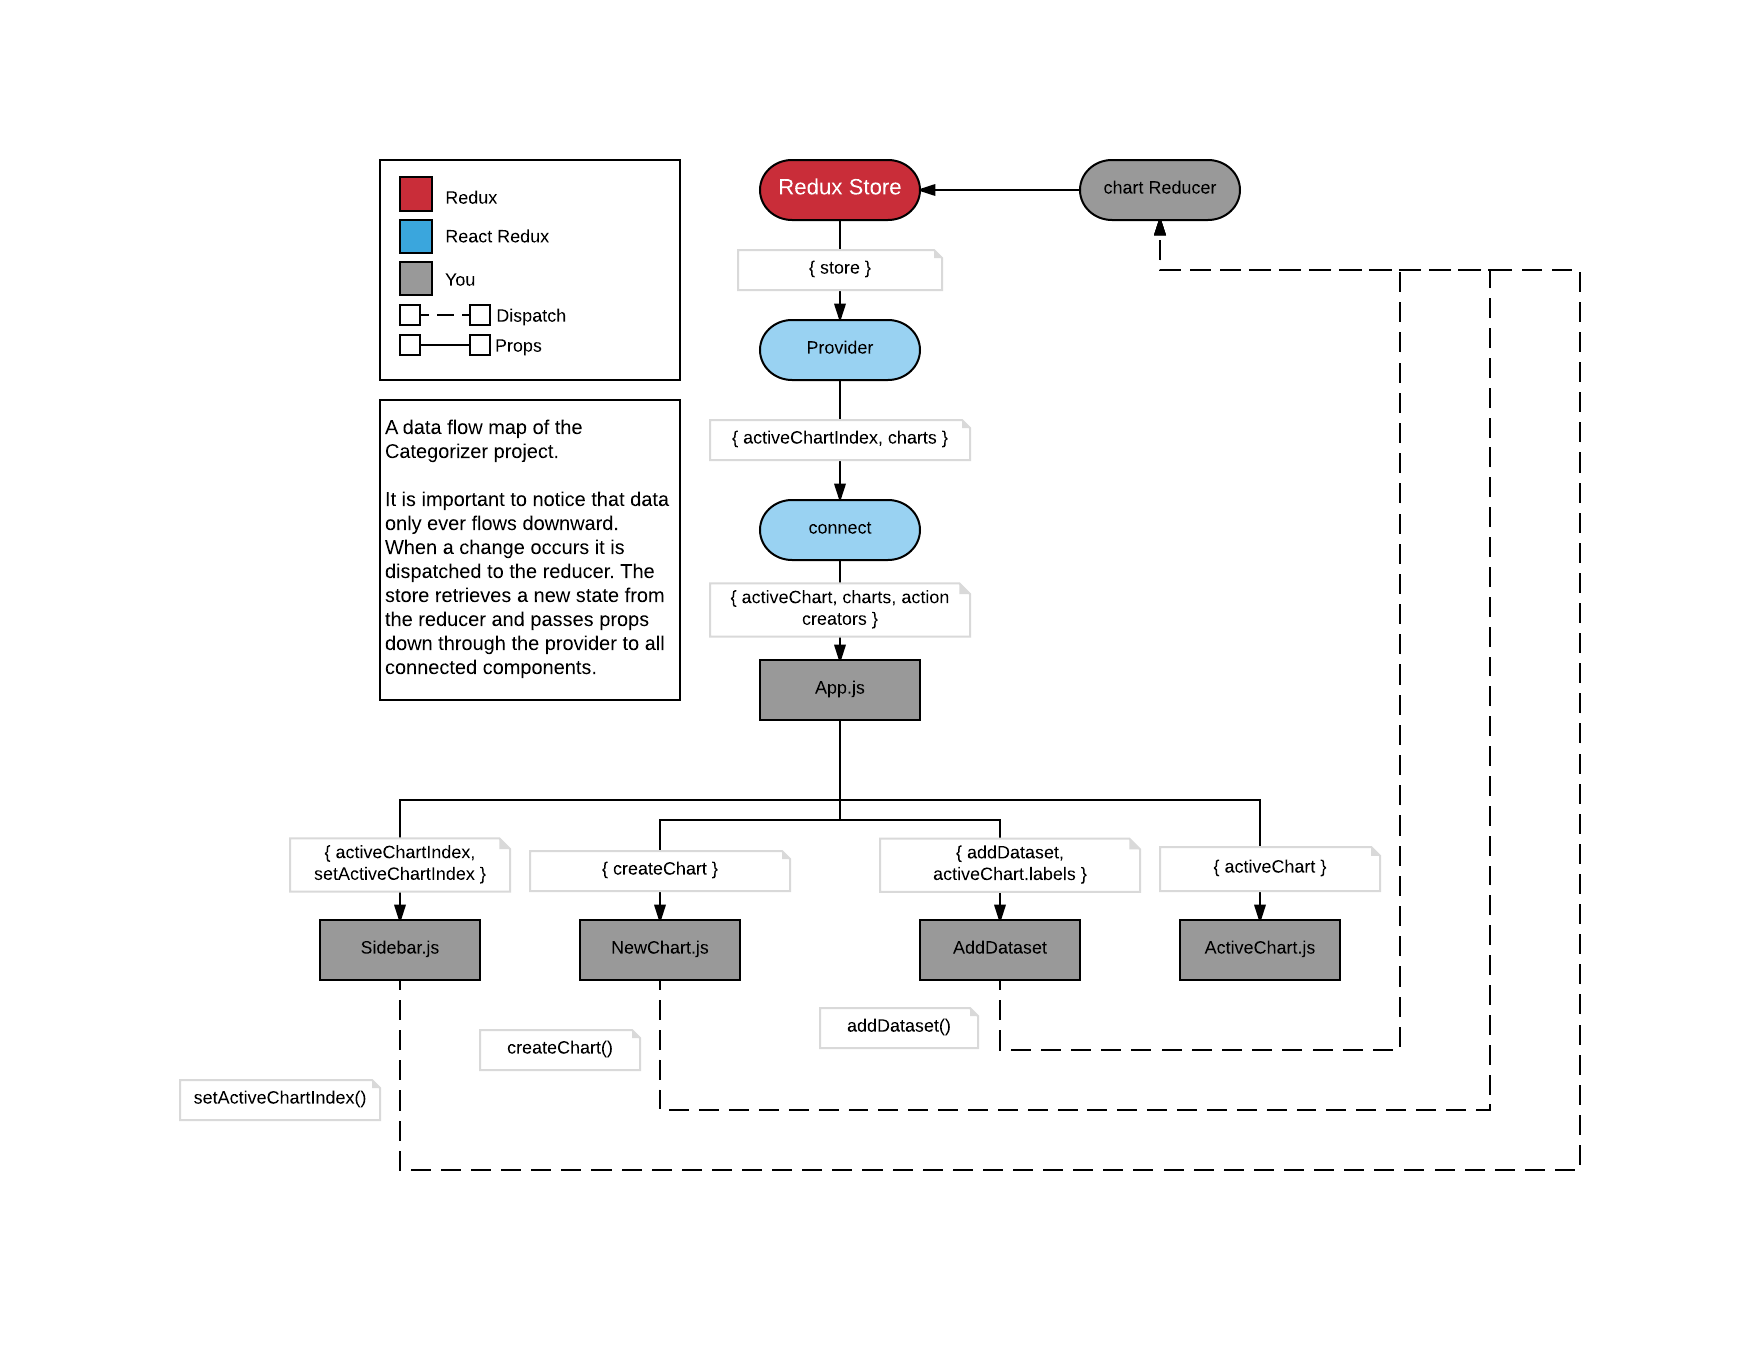
A finished example can be found here
Get started with the usual steps:
- Fork and clone this repository
cdinto the project directorynpm ito download the included dependenciesnpm testto start the test suitenpm startto spin up the development server
Summary
The first step will be focused on the initial setup required to make a Redux application. We will install the required dependencies, create a reducer and Redux store, and connect the application to Redux.
Instructions
- Install Redux and React Redux
- Create
src/ducks/chart.js - Write an initial state and reducer inside of
src/ducks/chart.js - Create
src/store.js - Create the Redux store in
src/store.js - Connect the application to Redux in
src/index.js - Connect the
Appcomponent definition to Redux
Detailed Instructions
Start by installing the following dependencies
redux- A state container for JavaScript applications. This library allows us to easily store and access information from across an entire application.react-redux- The official bindings to seamlessly connect a React application to Redux.
As those install, open the directory inside of src named ducks. This is the directory where our reducer will live. Inside of src/ducks create a file chart.js. chart.js will hold a reducer, action types, action creators, and the reducer's initial state.
Open up src/ducks/chart.js and start by creating an initialState variable. initialState should be an object with two properties:
activeChartIndex- This is where we will store the index of the chart that the user has chosen to display. It should default to0charts- This will be an array of objects containing the data necessary to create the charts. We'll have it default to an array containing an example chart object that looks like this:
{
  // Labels corresponding to the corners of the chart.
  labels: [ "Red", "Blue", "Yellow", "Green", "Purple", "Orange" ]
  // The name of the chart
, name: "Example Chart"
  // The data required for rendering values to the chart
, datasets: [
		{
			  // The name of the dataset
			  label: "My First dataset"
			  // Each of these numbers corresponds to one of the labels above,
			  // based on index
			, data: [65, 59, 90, 81, 56, 55, 40]
		}
		, {
			  label: "My Second dataset"
			, data: [28, 48, 40, 19, 96, 27, 100]
		}
	]
}
Once the initialState is created we can create our reducer. Create and export by default a function named chart which takes two parameters
state- This will be an object representation of our application's current state. It should default toinitialState.action- An object containing information about what has occurred, and any data necessary to perform a state change.
Add a switch statement to the chart function that checks action.type. Later it will check for specific types, but for now just give it a default case that returns state.
Now that the bones of the reducer are in place, we can create the application's Redux store. Create a new file in src named store.js. Inside of src/store.js import createStore from Redux and chart from src/chart.js. Create the Redux store by invoking createStore and passing in chart, export the store by default.
What is Redux doing behind the scenes here? When Redux first initializes it will call the chart reducer function passing undefined as the first argument and a dummy action as the second argument. Our function will return the default state value of initialState, giving Redux an initial value to work with.
Now to connect the React application to Redux. In src/index.js import Provider from React Redux and store from src/store.js. Wrap the App component in the Provider component, passing store as a prop to Provider. Provider is simply a wrapper component that gives the rest of the application access to the store.
Finally, in src/components/App.js import connect from React Redux. Underneath the component definition create a function named ``mapStateToPropsthat takes a single parameterstate`. This function is how we tell Redux which pieces of state a component is interested in as well as the format they are passed in. We want all of the state data, but we also want to make life a little easier on ourselves, so `mapStateToProps` will return an object with two properties:
activeChart- Set equal tocharts[ state.activeChartIndex ]charts- Set equal tostate.charts
Note that we aren't simply returning { activeChartIndex: state.activeChartIndex, charts: state.charts }, instead we are grabbing a reference to the actual active chart itself. Now we can access it easily throughout our components!
To finish connecting the App component definition we need to create a decorator by invoking connect and passing in mapStateToProps, then invoke the decorator passing in App. Export the decorated component by default. Decorators take some getting used to, so here's a reminder:
Decorator Example
function mapStateToProps( state ) {
    return state;
}
const decorator = connect( mapStateToProps );
const decoratedComponent = decorator( App );
export default decoratedComponent;
This is usually shortened to
function mapStateToProps( state ) {
    return state;
}
export default connect( mapStateToProps )( App );
That's it for step 1! Nothing appears to have changed, but we've laid the groundwork we'll build on over the next steps!
Code Solution
src/ducks/chart.js
const initialState = {
	  activeChartIndex: 0
	, charts: [ {
		  labels: [ "Red", "Blue", "Yellow", "Green", "Purple", "Orange" ]
		, name: "Example Chart"
		, datasets: [
			{
				  label: "My First dataset"
				, data: [65, 59, 90, 81, 56, 55, 40]
			}
			, {
				  label: "My Second dataset"
				, data: [28, 48, 40, 19, 96, 27, 100]
			}
		]
	} ]
};

export default function chart( state = initialState, action ) {
	switch ( action.type ) {
		default: return state;
	}
}
src/store.js
import { createStore } from "redux";

import chart from "./ducks/chart";

export default createStore( chart );
src/index.js
import React from "react";
import ReactDOM from "react-dom";
import { Provider } from "react-redux";

import "./index.css";

import store from "./store";

import App from "./components/App";

ReactDOM.render(
	<Provider store={ store }>
		<App />
	</Provider>,
	document.getElementById( 'root' )
);
App.js
import React, { Component } from "react";
import {connect} from "react-redux";

import "./App.css";

import NewChart from "./NewChart/NewChart";
import Sidebar from "./Sidebar/Sidebar";

class App extends Component {
	render() {
		return (
			<div className="app">
				<Sidebar />
				<main className="app__main">
					<header className="app__header">
						<h1 className="app__title">Categorizer</h1>

						<div className="app__new-chart">
							<NewChart />
						</div>
					</header>
				</main>
			</div>
		);
	}
}

export default connect(mapStateToProps)(App);

function mapStateToProps( { activeChartIndex, charts } ) {
	return {
		  activeChart: charts[ activeChartIndex ]
		, charts
	};
}Summary
In this step we will be connecting a component to Redux, creating our first action type/creator, and modifying the reducer to be able to handle the action.
Instructions
- Create a
CREATE_CHARTaction type and corresponding action creator - Modify the
chartreducer to handle to handle adding a new chart
Detailed Instructions
This step will be in src/ducks/chart.js. At the top of the file create an action type CREATE_CHART and set it equal to "CREATE_CHART". This action type is just a description of what happened used by the reducer to determine how to change state.
Underneath the chart reducer, create and export a function named createChart. createChart will take in two parameters:
labels- An array of labels that the chart will havename- The name of the chart specified by the user
createChart should return an object with two properties:
chart- An object containing the necessary chart data:{ labels, name, datasets: [] }type- The action type, in this caseCREATE_CHART
With the action creator ready to go, we now need to update the reducer function itself to handle the action. Add a new case to the switch statement that checks the action.type against CREATE_CHART (put this above the default case, or it will never run!). This case should return a new state object where
chartsis an array ofaction.chartand all the pastchartson stateactiveChartIndexis set to0, the index of the newly created chart.
Remember not to mutate state! You should be returning a brand new object based on the values from the previous object.
We'll hook this action up to the GUI in the next step, but for now you can test your reducer by calling it manually and examining the result. chart( undefined, createChart( [ "foo", "bar", "baz" ], "test" ) ); should return something like this:
{
  "activeChartIndex": 0,
  "charts": [
    {
      "labels": [
        "foo",
        "bar",
        "baz"
      ],
      "name": "test",
      "datasets": []
    },
    {
      "labels": [ /* labels */ ],
      "name": "Example Chart",
      "datasets": [
        {
          "label": "My First dataset",
          "data": [ /* numbers */ ]
        },
        {
          "label": "My Second dataset",
          "data": [ /* numbers */ ]
        }
      ]
    }
  ]
}
Code Solution
// src/ducks/chart.js
const CREATE_CHART = "CREATE_CHART";

const initialState = {
	  activeChartIndex: 0
	, charts: [ {
		  labels: [ "Red", "Blue", "Yellow", "Green", "Purple", "Orange" ]
		, name: "Example Chart"
		, datasets: [
			{
				  label: "My First dataset"
				, data: [65, 59, 90, 81, 56, 55, 40]
			}
			, {
				  label: "My Second dataset"
				, data: [28, 48, 40, 19, 96, 27, 100]
			}
		]
	} ]
};

export default function chart( state = initialState, action ) {
	switch ( action.type ) {
		case CREATE_CHART:
			return {
				  activeChartIndex: 0
				, charts: [ action.chart, ...state.charts ]
			};
		default: return state;
	}
}

export function createChart( labels, name ) {
	return {
		  chart: { labels, name, datasets: [] }
		, type: CREATE_CHART
	}
}Summary
In this step we'll implement the ability to create charts in the NewChart component.
Instructions
- Import and connect the
createChartaction creator inApp - Pass the
createChartto theNewChartcomponent - Alter the
NewChartcomponent definition to allow for handling user input - Use the
createChartfunction to pass the user input to Redux
Detailed Instructions
We'll begin this step in src/components/App.js. Import createChart from src/ducks/chart.js. If we were to invoke createChart in our component right now, what would happen? Would Redux receive the action?
It wouldn't! createChart is just a function that returns an action object. To send the action to Redux we need to wrap it in Redux's dispatch function. Luckily React Redux's connect can do just that for us. As the second argument to connect (after mapStateToProps) pass an object containing the createChart function.
The magic behind connect wrapping action creators
It may feel a little like magic, but the wrapping of action creators in dispatch is fairly simple! The actual source code will be different, but this is accomplishing the same thing.
// Take in an object of action creators, i.e { createChart }
function wrapActionCreator( actionCreatorsObject ) {
	// A new object that will hold the wrapped action creators
	const wrappedActionCreators = {};
	// Iterate over each action creator in the object
	for ( let actionCreator in actionCreatorsObject ) {
		// Creating a new function to capture arguments to the action creator
		// such as "labels" and "name"
		wrappedActionCreators[ actionCreator ] = ( ...args ) => {
			// Create the action, passing in the captured arguments
			const action = actionCreatorsObject[ actionCreator ]( ...args );
			// Dispatch the action to Redux
			dispatch( action );
		}
	}
	return wrappedActionCreators;
}
All that is left to do in App is to pass createChart as a prop to the NewChart component.
Open up src/components/NewChart/NewChart.js. Get started by writing a constructor method (don't forget to super( props );!) where we'll create a state object with three properties:
labels- A list of the labels submitted so far. Defaults to an empty arrayname- The text from the name input. Defaults to an empty stringnewLabel- The text from the new label input. Defaults to an empty string
Next up we'll need a handleChange method so we can accept user input. handleChange will take two arguments:
field- The name of the field that is changing, i.e"name"or"newLabel"event- The DOM event triggering the change and carrying the new value
All this method needs to do is update the specified field on state with the value on the event. It will look something like this: this.setState( { [ field ]: event.target.value } );. Before we attach this method to the JSX, let's bind in the constructor. Because we have to handle changes from two different fields, we'll need to bind twice. It will look like this:
constructor( props ) {
	super( props );

	this.state = {
		  labels: []
		, name: ""
		, newLabel: ""
	};

	this.handleNameChange = this.handleChange.bind( this, "name" );
	this.handleNewLabelChange = this.handleChange.bind( this, "newLabel" );
}
Now we can dive into the JSX to make use of what we have so far! At the top of render destructure labels, name, and newLabel from this.state. Both input elements will need two new props:
value- set equal tonameornewLabelrespectivelyonChange- set equal tohandleNameChangeorhandleNewLabelChangerespectively
Next we need to add a way for users to save their labels, we'll do that by creating a new method addLabel. addLabel will take a single event parameter. What this method needs to do is call event.preventDefault(), add this.state.newLabel to this.state.labels, and reset this.state.newLabel to an empty string. It will look something like this:
addLabel( event ) {
	// We need to prevent default because this will be attached to a form
	// element. Without this, the browser will reload!
	event.preventDefault();

	this.setState( {
		  labels: [ ...this.state.labels, this.state.newLabel ]
		, newLabel: ""
	} );
}
Bind addLabel in the constructor and then pass it to the onSubmit prop of the form containing the "Add Label" input. To let the user see what labels they have already added add the following code inside of the [] brackets in the new-chart__labels span - { labels.join( ", " ) }. With these changes you should be able to enter labels and see them populate below as you hit enter.
Finally we need to send all this data to our reducer! To do this we'll need one more method - submitChart which won't take any parameters. Destructure labels and name from this.state so we can do a little bit of form validation. If name is an empty string or there are less than 3 labels we will just return early. Next we need to call this.props.createChart (our action creator passed down from app) passing in labels and name. Lastly, reset this.state to its initial value. Bind submitChart in the constructor and pass it to the onClick handler of the submit button. It will look like this:
submitChart() {
	const { labels, name } = this.state;

	if ( !name || labels.length < 3 ) {
		return;
	}

	this.props.createChart( labels, name );

	this.setState( {
		  labels: []
		, name: ""
		, newLabel: ""
	} );
}
You're now able to send all the data necessary for creating a chart to the reducer! Unfortunately the chart isn't visible yet, but we'll cover that in the next step.
Code Solution
src/components/App.js
import React, { Component } from "react";
import { connect } from "react-redux";

import "./App.css";

import { createChart } from "../ducks/chart";

import NewChart from "./NewChart/NewChart";
import Sidebar from "./Sidebar/Sidebar";

class App extends Component {
	render() {
		const { createChart } = this.props;
		return (
			<div className="app">
				<Sidebar />
				<main className="app__main">
					<header className="app__header">
						<h1 className="app__title">Categorizer</h1>

						<div className="app__new-chart">
							<NewChart createChart={ createChart } />
						</div>
					</header>
				</main>
			</div>
		);
	}
}

function mapStateToProps( { activeChartIndex, charts } ) {
	return {
		  activeChart: charts[ activeChartIndex ]
		, charts
	};
}

export default connect( mapStateToProps, { createChart } )( App );
src/components/NewChart/NewChart.js
import React, { Component, PropTypes } from "react";

import "./NewChart.css";

export default class NewChart extends Component {
	static propTypes = { createChart: PropTypes.func.isRequired };

	constructor( props ) {
		super( props );

		this.state = {
			  labels: []
			, name: ""
			, newLabel: ""
		};

		this.handleNameChange = this.handleChange.bind( this, "name" );
		this.handleNewLabelChange = this.handleChange.bind( this, "newLabel" );
		this.addLabel = this.addLabel.bind( this );
		this.submitChart = this.submitChart.bind( this );
	}

	handleChange( field, event ) {
		this.setState( { [ field ]: event.target.value } );
	}

	addLabel( event ) {
		event.preventDefault();

		this.setState( {
			  labels: [ ...this.state.labels, this.state.newLabel ]
			, newLabel: ""
		} );
	}

	submitChart() {
		const { labels, name } = this.state;

		if ( !name || labels.length < 3 ) {
			return;
		}

		this.props.createChart( labels, name );

		this.setState( {
			  labels: []
			, name: ""
			, newLabel: ""
		} );
	}

	render() {
		const {
			  labels
			, name
			, newLabel
		} = this.state;
		return (
			<div className="new-chart">
				<div className="new-chart__form-group">
					<label className="new-chart__label">Chart Name:</label>
					<input
						className="new-chart__name new-chart__input"
						onChange={ this.handleNameChange }
						type="text"
						value={ name }
					/>
				</div>
				<form
					className="new-chart__form-group"
					onSubmit={ this.addLabel }
				>
					<label className="new-chart__label">Add Label:</label>
					<input
						className="new-chart__category new-chart__input"
						onChange={ this.handleNewLabelChange }
						required
						type="text"
						value={ newLabel }
					/>
				</form>

				<div className="new-chart__labels-wrapper">
					<label className="new-chart__label">Labels:</label>
					<span className="new-chart__labels">[{ labels.join( ", " ) }](Min. 3)</span>
				</div>

				<button
					className="new-chart__submit"
					onClick={ this.submitChart }
				>
					Submit
				</button>
			</div>
		);
	}
}Summary
In this step we will be rendering the chart, and updating the sidebar to list all past charts.
Instructions
- Render the
ActiveChartcomponent intoApp - Pass the
activeChartprop to theActiveChartcomponent - Create
SET_ACTIVE_CHART_INDEXaction type/creator - Connect the
setActiveChartIndexaction creator toApp - Pass
chartsandsetActiveChartIndexprops toSidebar - Refactor
Sidebarto display a list of past charts
Detailed Instructions
After all the hard work we've done so far, it's time to finally display a chart! Start by opening up src/components/App.js and import ActiveChart from src/components/ActiveChart/ActiveChart. At the top of the render method, destructure activeChart and charts from this.props. Inside of the render method's return, just beneath the closing </header> tag, add a div with the class app__active-chart. Place the ActiveChart component into this new div and give it a chart prop set equal to the activeChart object we are getting from Redux.
The example chart from initial state should now be showing up in the page! And if you create another chart, the new one will replace the example.
Now that we can create and actually see multiple charts (even if we can't add data to them yet) we need a way to navigate between them. We'll set up the logic for this insrc/ducks/chart.js. At the top of the file create a new action type of SET_ACTIVE_CHART_INDEX set equal to "SET_ACTIVE_CHART_INDEX".
Underneath the reducer create a setActiveChartIndex action creator that takes a single parameter index and returns an object with a type property of SET_ACTIVE_CHART_INDEX and an index property set equal to the index parameter.
Lastly we need to handle this action in the chart reducer, luckily this will be pretty easy. Add a case checking against SET_ACTIVE_CHART_INDEX, this case should return a new state object where activeChartIndex is set equal to action.index and charts is set equal to state.charts.
Head back over to src/components/App.js and import the new setActiveChartIndex action creator. Add setActiveChartIndex as another property to the action creators object passed to connect. Destructure setActiveChartIndex in App's render method. Pass two new props to Sidebar - charts and setActiveChartIndex.
Open up src/components/Sidebar/Sidebar.js. We'll need to map over the charts passed to this component to create a list of charts. Above the return create a new variable named pastCharts and set it equal to the result of mapping over charts and returning the following JSX:
<li
	className="sidebar__past-chart"
	key={ chart.name }
>
	<p
		className="sidebar__chart-name"
		// Remember that .map will provide the element's index
		// as a second parameter
		onClick={ () => setActiveChartIndex( index ) }
	>
		{ chart.name }
	</p>
	<p className="sidebar__chart-datasets">{ chart.datasets.length } Datasets</p>
</li>
Replace the static <li> element and its contents with the pastCharts variable. You should now be able to create multiple charts and navigate between them by clicking on the appropriate sidebar links.
Code Solution
src/components/App.js
import React, { Component } from "react";
import { connect } from "react-redux";

import "./App.css";

import { createChart, setActiveChartIndex } from "../ducks/chart";

import ActiveChart from "./ActiveChart/ActiveChart";
import NewChart from "./NewChart/NewChart";
import Sidebar from "./Sidebar/Sidebar";

class App extends Component {
	render() {
		const {
			  activeChart
			, charts
			, createChart
			, setActiveChartIndex
		} = this.props;

		return (
			<div className="app">
				<Sidebar
					charts={ charts }
					setActiveChartIndex={ setActiveChartIndex }
				/>
				<main className="app__main">
					<header className="app__header">
						<h1 className="app__title">Categorizer</h1>

						<div className="app__new-chart">
							<NewChart createChart={ createChart } />
						</div>
					</header>
					<div className="app__active-chart">
						<ActiveChart chart={ activeChart } />
					</div>
				</main>
			</div>
		);
	}
}

function mapStateToProps( { activeChartIndex, charts } ) {
	return {
		  activeChart: charts[ activeChartIndex ]
		, charts
	};
}

export default connect( mapStateToProps, { createChart, setActiveChartIndex } )( App );
src/ducks/chart.js
const CREATE_CHART = "CREATE_CHART";
const SET_ACTIVE_CHART_INDEX = "SET_ACTIVE_CHART_INDEX";

const initialState = {
	  activeChartIndex: 0
	, charts: [ {
		  labels: [ "Red", "Blue", "Yellow", "Green", "Purple", "Orange" ]
		, name: "Example Chart"
		, datasets: [
			{
				  label: "My First dataset"
				, data: [65, 59, 90, 81, 56, 55, 40]
			}
			, {
				  label: "My Second dataset"
				, data: [28, 48, 40, 19, 96, 27, 100]
			}
		]
	} ]
};

export default function chart( state = initialState, action ) {
	switch ( action.type ) {
		case CREATE_CHART:
			return {
				  activeChartIndex: 0
				, charts: [ action.chart, ...state.charts ]
			};
		case SET_ACTIVE_CHART_INDEX:
			return {
				  activeChartIndex: action.index
				, charts: state.charts
			};
		default: return state;
	}
}

export function createChart( labels, name ) {
	return {
		  chart: { labels, name, datasets: [] }
		, type: CREATE_CHART
	}
}

export function setActiveChartIndex( index ) {
	return { index, type: SET_ACTIVE_CHART_INDEX };
}
src/components/Sidebar.js
import React, { PropTypes } from "react";

import "./Sidebar.css";

export default function Sidebar( { charts, setActiveChartIndex } ) {
	const pastCharts = charts.map( ( chart, index ) => (
		<li
			className="sidebar__past-chart"
			key={ chart.name }
		>
			<p
				className="sidebar__chart-name"
				onClick={ () => setActiveChartIndex( index ) }
			>
				{ chart.name }
			</p>
			<p className="sidebar__chart-datasets">{ chart.datasets.length } Datasets</p>
		</li>
	) );
	return (
		<aside className="sidebar">
			<h3 className="sidebar__title">Past Charts</h3>

			<ul className="sidebar__past-charts">
				{ pastCharts }
			</ul>
		</aside>
	);
}

Sidebar.propTypes = {
	  charts: PropTypes.arrayOf( PropTypes.object ).isRequired
	, setActiveChartIndex: PropTypes.func.isRequired
};Summary
In this step we will be creating the reducer logic that allows the adding of datasets.
Instructions
- Create an
ADD_DATASETaction type and corresponding action creator - Alter the
chartreducer to handle the new action type - Connect the
addDatasetaction creator toApp - Render the
AddDatasetcomponent intoApp, passing theaddDatasetaction creator as a prop
Detailed Instructions
We'll begin this step in src/ducks/chart.js. Create a new action type of ADD_DATASET at the top of the file. Underneath the reducer create and export the corresponding action creator - addDataset. addDataset will take a single parameter dataset and return an object with two properties
typeset equal toADD_DATASETdatasetset equal to thedatasetparameter. This will be an array of numbers that corresponds to the labels on the chart.
Lastly we need to update the reducer to handle this action. Add a case checking the action.type against ADD_DATASET. For this case we will need to return a new object where:
activeChartIndexis set equal tostate.activeChartIndexchartsis is a copy ofstate.chartswith the a new dataset added to the active chart
It will look something like this
// Note the brackets around this case. This prevents variables
// from leeching into a different scope.
case ADD_DATASET: {
	// Saving ourselves some typing and clean up code by destructuring
	// values we will be using often.
	const { activeChartIndex, charts } = state;
	const activeChart = charts[ activeChartIndex ];
	return {
		  activeChartIndex
		, charts: [
			  // Making a copy of all the charts before the active chart
			  ...charts.slice( 0, activeChartIndex )
			  // Replacing the active chart with a modified copy
			, Object.assign(
				  {}
				, activeChart
				, { datasets: [ ...activeChart.datasets, action.dataset ] }
			)
			  // Making a copy of all the charts after the active chart
			, ...charts.slice( activeChartIndex + 1, charts.length )
		]
	}
}
That's it for this reducer, now we can finish up this step in src/components/App.js. Import addDataset from src/ducks/chart.js and AddDataset from src/components/AddDataset/AddDataset.js. Add addDataset to the action creators object that is being passed to connect and destructure it from this.props in render.
Add the AddDataset component into App's render method just below ActiveChart, passing two props:
addDataset- TheaddDatasetaction creatorlabels- Set equal toactiveChart.labels
You should now see the skeleton of the AddDataset component to the right of the chart. We can't do much with it, but we'll fix that in the next step!
Code Solution
src/ducks/chart.js
const ADD_DATASET = "ADD_DATASET";
const CREATE_CHART = "CREATE_CHART";
const SET_ACTIVE_CHART_INDEX = "SET_ACTIVE_CHART_INDEX";

const initialState = {
	  activeChartIndex: 0
	, charts: [ {
		  labels: [ "Red", "Blue", "Yellow", "Green", "Purple", "Orange" ]
		, name: "Example Chart"
		, datasets: [
			{
				  label: "My First dataset"
				, data: [65, 59, 90, 81, 56, 55, 40]
			}
			, {
				  label: "My Second dataset"
				, data: [28, 48, 40, 19, 96, 27, 100]
			}
		]
	} ]
};

export default function chart( state = initialState, action ) {
	switch ( action.type ) {
		case ADD_DATASET: {
			const { activeChartIndex, charts } = state;
			const activeChart = charts[ activeChartIndex ];
			return {
				  activeChartIndex
				, charts: [
					  ...charts.slice( 0, activeChartIndex )
					, Object.assign(
						  {}
						, activeChart
						, { datasets: [ ...activeChart.datasets, action.dataset ] }
					)
					, ...charts.slice( activeChartIndex + 1, charts.length )
				]
			}
		}
		case CREATE_CHART:
			return {
				  activeChartIndex: 0
				, charts: [ action.chart, ...state.charts ]
			};
		case SET_ACTIVE_CHART_INDEX:
			return {
				  activeChartIndex: action.index
				, charts: state.charts
			};
		default: return state;
	}
}

export function addDataset( dataset ) {
	return { dataset, type: ADD_DATASET };
}

export function createChart( labels, name ) {
	return {
		  chart: { labels, name, datasets: [] }
		, type: CREATE_CHART
	}
}

export function setActiveChartIndex( index ) {
	return { index, type: SET_ACTIVE_CHART_INDEX };
}
src/components/App.js
import React, { Component } from "react";
import { connect } from "react-redux";

import "./App.css";

import { addDataset, createChart, setActiveChartIndex } from "../ducks/chart";

import ActiveChart from "./ActiveChart/ActiveChart";
import AddDataset from "./AddDataset/AddDataset";
import NewChart from "./NewChart/NewChart";
import Sidebar from "./Sidebar/Sidebar";

class App extends Component {
	render() {
		const {
			  activeChart
			, addDataset
			, charts
			, createChart
			, setActiveChartIndex
		} = this.props;

		return (
			<div className="app">
				<Sidebar
					charts={ charts }
					setActiveChartIndex={ setActiveChartIndex }
				/>
				<main className="app__main">
					<header className="app__header">
						<h1 className="app__title">Categorizer</h1>

						<div className="app__new-chart">
							<NewChart createChart={ createChart } />
						</div>
					</header>
					<div className="app__active-chart">
						<ActiveChart chart={ activeChart } />
						<AddDataset
							addDataset={ addDataset }
							labels={ activeChart.labels }
						/>
					</div>
				</main>
			</div>
		);
	}
}

function mapStateToProps( { activeChartIndex, charts } ) {
	return {
		  activeChart: charts[ activeChartIndex ]
		, charts
	};
}

export default connect( mapStateToProps, { addDataset, createChart, setActiveChartIndex } )( App );Summary
In this step we will be updating the AddDataset component so a user can add data to their charts.
Instructions
- Alter the
AddDatasetcomponent to display a dynamic list ofinputs based on a chart's labels - Alter the
AddDatasetcomponent to handle user input and allow submitting of datasets
Detailed Instructions
This step will take place in src/components/AddDataset/AddDataset.js. We'll get started by creating a constructor method and creating an initial state. Normally we would create a property on state for each input, but we could have any number of inputs. How should we set up state to handle a dynamic number of inputs? In our case, we'll use an array.
this.state should have two properties:
label- The name of the dataset currently being created, corresponds to our one static input. Defaults to an empty stringdata- The array where we will be storing values for the dataset. It will default tonew Array( props.labels.length ).fill( 0 ). This will create an array with a length equal to the length of our data labels, then fill each index with0.
With our state set up, let's jump into render and create the dynamic data inputs. Destructure labels from this.props as well as data and label from this.state. Create a new variable labelInputs and set it equal to the result of mapping over labels and returning the following JSX:
<div
	className="add-dataset__form-group"
	key={ label }
>
	<label className="add-dataset__label">{ label }:</label>
	<input
		className="add-dataset__input"
		max="100"
		min="0"
		required
		type="number"
		// Here is where we connect to this.state
		// If we ever re-ordered our list this wouldn't work!
		// Can you think of a solution that works even if the
		// list were to be sorted or reversed?
		value={ data[ index ] }
	/>
</div>
Render labelInputs just below the div with a class of add-dataset__form-group. While we're here, let's update the "Dataset Label" input. Pass the input a value prop set equal to label.
Now we've got a list of inputs all defaulting to 0, let's write a method to edit them! Create a new method handleDataChange that takes two paremeters:
changedIndex- The index of the data input that changedevent- The DOM event that triggered the change handler and carries the new value
This method will work in a very similar way as the ADD_DATASET handler in our chart reducer. We need to grab a copy of all the elements before the changed index, insert the updated value, and grab a copy of all the elements after the changed index. It will look something like this:
handleDataChange( changedIndex, event ) {
	const { data } = this.state;
	this.setState( {
		data: [
			  ...data.slice( 0, changedIndex )
			, parseInt( event.target.value, 10 )
			, ...data.slice( changedIndex + 1, data.length )
		]
	} );
}
We'll also need a method to handle a change from the label input. handleLabelChange will take a single event parameter and will update label on state to equal event.target.value.
Bind handleLabelChange in the constructor and pass it to the appropriate input's onChange prop. Pass handleDataChange to the data inputs, binding in render and passing index as an argument: onChange={ this.handleDataChange.bind( this, index ) }.
Lastly we need to be able to submit these datasets to Redux. Create a method handleSubmit that takes in an event parameter. This method will do the following:
- Call
event.preventDefaultto stop the browser from taking its default action - Destructure
dataandlabelfromthis.state - Destructure
addDatasetandlabelsfromthis.props - Call the
addDataSetaction creator, passing an object with two properties as an argumentdata- Set equal todata.map( datum => parseInt( datum, 10 ) )label- Set equal to thelabelvariable
- Reset state back to its initial value
Finally, bind handleSubmit in the constructor and pass it to the form element's onSubmit prop. You should now be able to create charts, navigate between charts, add datasets to existing charts, and see those datasets display!
But wait! A bug?
Uh oh, it looks like creating a chart with more labels than the active chart doesn't work properly! The extra inputs won't be given a default value and React will throw some angry warnings. What is happening here?
The constructor is only invoked once, when the component is first created. This means that we are only creating the data array on state a single time, it never updates. To fix this we need to make use of one of React's lifecycle methods - componentWillReceiveprops. componentWillReceiveProps is called whenever props are passed to the component and takes a single argument nextProps - the new props being passed. What we need to do is check if nextProps does not equal this.props, and update this.state.data accordingly. It will look like this:
componentWillReceiveProps( nextProps ) {
	if ( nextProps !== this.props ) {
		this.setState( { data: new Array( nextProps.labels.length ).fill( 0 ) } );
	}
}
Bug fixed! We're all done here!
Code Solution
// src/components/AddDataset/AddDataset.js
import React, { Component, PropTypes } from "react";

import "./AddDataset.css";

export default class AddDataset extends Component {
	static propTypes = {
		  addDataset: PropTypes.func.isRequired
		, labels: PropTypes.arrayOf( PropTypes.string ).isRequired
	};

	constructor( props ) {
		super( props );

		this.state = {
			  data: new Array( props.labels.length ).fill( 0 )
			, label: ""
		};

		this.handleLabelChange = this.handleLabelChange.bind( this );
		this.handleSubmit = this.handleSubmit.bind( this );
	}

	componentWillReceiveProps( nextProps ) {
		if ( nextProps !== this.props ) {
			this.setState( { data: new Array( nextProps.labels.length ).fill( 0 ) } );
		}
	}

	handleDataChange( changedIndex, event ) {
		const { data } = this.state;
		this.setState( {
			data: [
				  ...data.slice( 0, changedIndex )
				, parseInt( event.target.value, 10 )
				, ...data.slice( changedIndex + 1, data.length )
			]
		} );
	}

	handleLabelChange( event ) {
		this.setState( { label: event.target.value } );
	}

	handleSubmit( event ) {
		event.preventDefault();

		const { data, label } = this.state;
		const { addDataset, labels } = this.props;

		addDataset( { data: data.map( datum => parseInt( datum, 10 ) ), label } );

		this.setState( {
			  data: new Array( labels.length ).fill( 0 )
			, label: ""
		} );
	}

	render() {
		const { labels } = this.props;
		const { data, label } = this.state;

		const labelInputs = labels.map( ( label, index ) => (
			<div
				className="add-dataset__form-group"
				key={ label }
			>
				<label className="add-dataset__label">{ label }:</label>
				<input
					className="add-dataset__input"
					max="100"
					min="0"
					onChange={ this.handleDataChange.bind( this, index ) }
					required
					type="number"
					value={ data[ index ] }
				/>
			</div>
		) );

		return (
			<form
				className="add-dataset"
				onSubmit={ this.handleSubmit }
			>
				<h3 className="add-dataset__header">Add Dataset</h3>
				<div className="add-dataset__form-group">
					<label className="add-dataset__label">Dataset Label:</label>
					<input
						className="add-dataset__input"
						onChange={ this.handleLabelChange }
						required
						type="text"
						value={ label }
					/>
				</div>
				{ labelInputs }
				<button
					className="add-dataset__submit"
					type="submit"
				>
					Submit
				</button>
			</form>
		);
	}
}- Right now all data is lost on refresh, look into using
localStorageto save a user's data. - Currently the color of datasets is randomized. Try allowing users to select colors for their datasets.
If you see a problem or a typo, please fork, make the necessary changes, and create a pull request so we can review your changes and merge them into the master repo and branch.
© DevMountain LLC, 2017. Unauthorized use and/or duplication of this material without express and written permission from DevMountain, LLC is strictly prohibited. Excerpts and links may be used, provided that full and clear credit is given to DevMountain with appropriate and specific direction to the original content.


