I am using Ubuntu 19.10 with CLion 2019.3 with an ESP32-WROOM DevKitCV4 attached to an FT232H USB via JTAG pins and the following configuration:
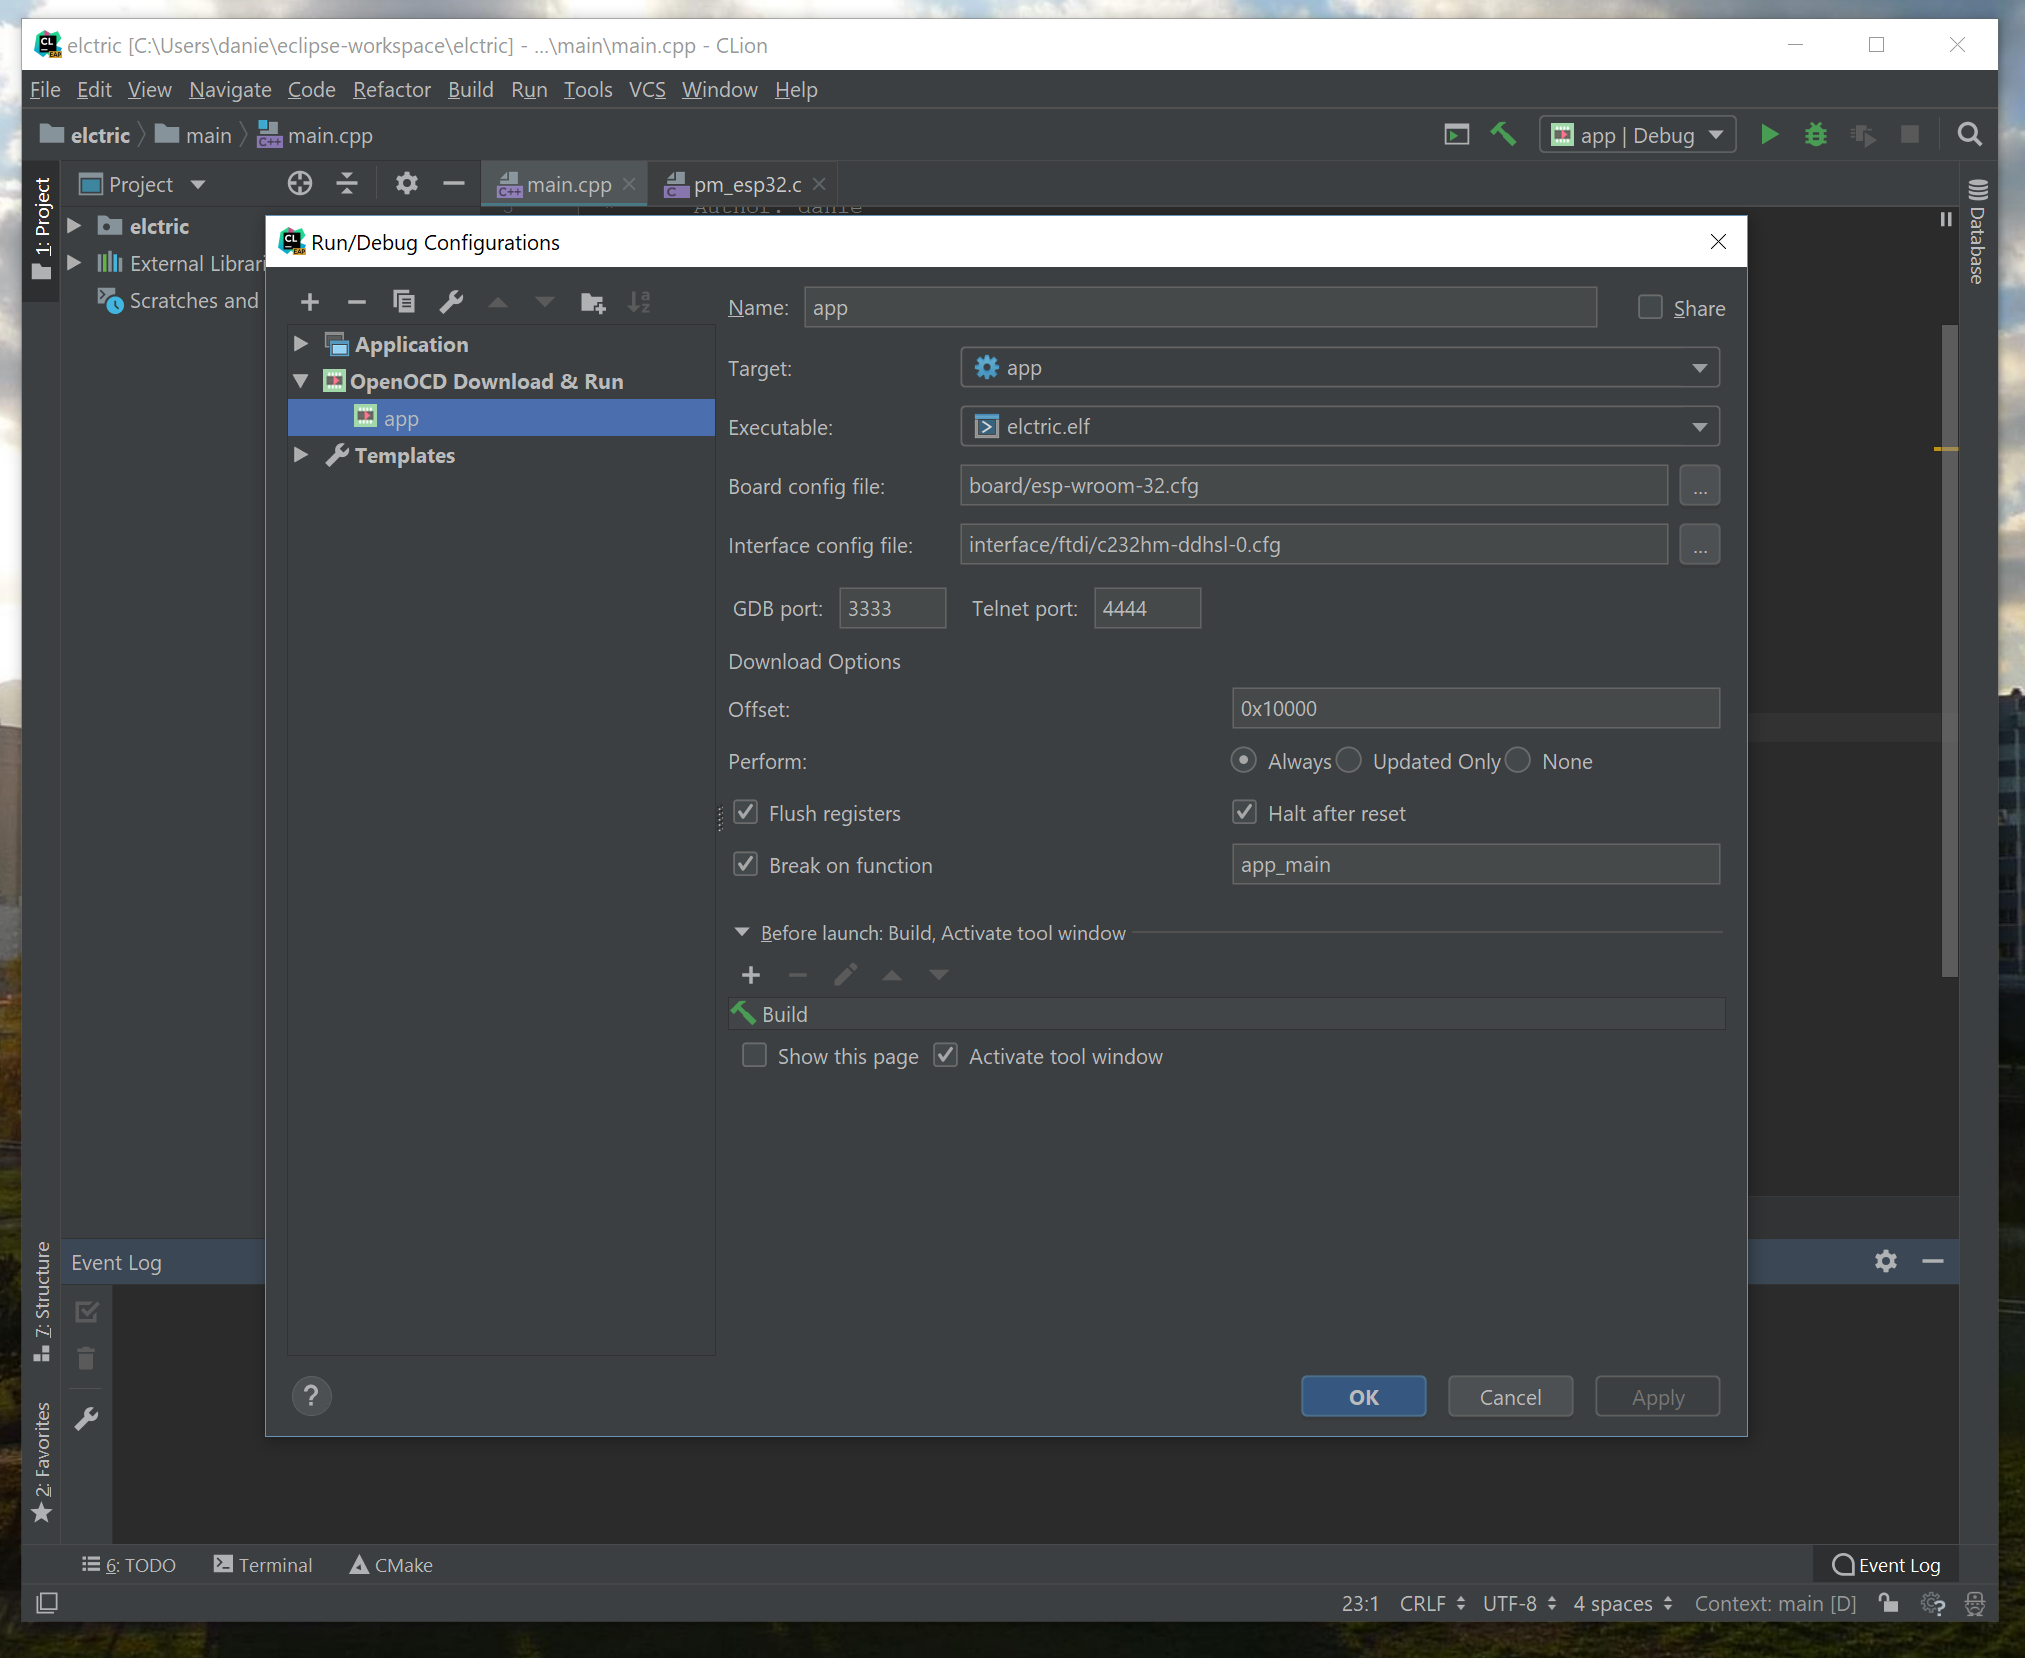
OpenOCD Download & Run:
Board config file: board/esp32-wroom-ft232h.cfg
Interface config file: interface/ftdi/esp32_devkitc.cfg

# board/esp32-wroom-ft232h.cfg
source [find interface/ftdi/esp32_devkitc.cfg]
set ESP32_FLASH_VOLTAGE 3.3
# Source the ESP32 configuration file
source [find target/esp32.cfg]

# interface/ftdi/esp32_devkitc.cfg
interface ftdi
ftdi_vid_pid 0x0403 0x6014
ftdi_layout_init 0x0008 0x400b
reset_config none
adapter_khz 20000
/home/osboxes/.espressif/tools/openocd-esp32/v0.10.0-esp32-20191114/openocd-esp32/bin/openocd -c "tcl_port disabled" -s /home/osboxes/.espressif/tools/openocd-esp32/v0.10.0-esp32-20191114/openocd-esp32/share/openocd/scripts -f interface/ftdi/esp32_devkitc.cfg -f board/esp32-wroom-ft232h.cfg -c "program_esp32 /home/osboxes/esp/blink/cmake-build-debug/blink.bin 0x10000" -c "init; reset halt"
Open On-Chip Debugger  v0.10.0-esp32-20191114 (2019-11-14-14:15)
Licensed under GNU GPL v2
For bug reports, read
	http://openocd.org/doc/doxygen/bugs.html
none separate
adapter speed: 20000 kHz
Warn : Interface already configured, ignoring
none separate
adapter speed: 20000 kHz
Info : Configured 2 cores
Error: type 'esp32' is missing virt2phys
Info : ftdi: if you experience problems at higher adapter clocks, try the command "ftdi_tdo_sample_edge falling"
Info : clock speed 20000 kHz
Info : JTAG tap: esp32.cpu0 tap/device found: 0x120034e5 (mfg: 0x272 (Tensilica), part: 0x2003, ver: 0x1)
Info : JTAG tap: esp32.cpu1 tap/device found: 0x120034e5 (mfg: 0x272 (Tensilica), part: 0x2003, ver: 0x1)
Info : esp32: Debug controller 0 was reset.
Info : esp32: Core 0 was reset.
Info : esp32: Debug controller 1 was reset.
Info : esp32: Core 1 was reset.
Info : Listening on port 3333 for gdb connections
Info : JTAG tap: esp32.cpu0 tap/device found: 0x120034e5 (mfg: 0x272 (Tensilica), part: 0x2003, ver: 0x1)
Info : JTAG tap: esp32.cpu1 tap/device found: 0x120034e5 (mfg: 0x272 (Tensilica), part: 0x2003, ver: 0x1)
Info : cpu0: Target halted, PC=0x400E28EE, debug_reason=00000000
Info : cpu0: Debug controller 0 was reset.
Info : cpu0: Core 0 was reset.
Info : cpu0: Target halted, PC=0x500000CF, debug_reason=00000000
Info : esp32: Core 0 was reset.
Info : esp32: Debug controller 1 was reset.
Info : esp32: Core 1 was reset.
Info : Target halted. CPU0: PC=0x40000400 (active)
Info : Target halted. CPU1: PC=0x40000400
** Programming Started **
auto erase enabled
Info : cpu0: Target halted, PC=0x400916EA, debug_reason=00000001
Info : Flash mapping 0: 0x10020 -> 0x3f400020, 21 KB
Info : Flash mapping 1: 0x20020 -> 0x400d0020, 74 KB
Info : cpu0: Target halted, PC=0x400916EA, debug_reason=00000001
Info : Auto-detected flash bank 'esp32.flash' size 4096 KB
Info : Using flash bank 'esp32.flash' size 4096 KB
Info : cpu0: Target halted, PC=0x400916EA, debug_reason=00000001
Info : cpu0: Target halted, PC=0x400916EA, debug_reason=00000001
wrote 147456 bytes from file /home/osboxes/esp/blink/cmake-build-debug/blink.bin in 2.598297s (55.421 KiB/s)
** Programming Finished **
Info : JTAG tap: esp32.cpu0 tap/device found: 0x120034e5 (mfg: 0x272 (Tensilica), part: 0x2003, ver: 0x1)
Info : JTAG tap: esp32.cpu1 tap/device found: 0x120034e5 (mfg: 0x272 (Tensilica), part: 0x2003, ver: 0x1)
Info : cpu0: Debug controller 0 was reset.
Info : cpu0: Core 0 was reset.
Info : cpu0: Target halted, PC=0x500000CF, debug_reason=00000000
Info : esp32: Core 0 was reset.
Info : esp32: Debug controller 1 was reset.
Info : esp32: Core 1 was reset.
Info : Target halted. CPU0: PC=0x40000400 (active)
Info : Target halted. CPU1: PC=0x40000400
Info : tcl server disabled
Info : Listening on port 4444 for telnet connections
Info : accepting 'gdb' connection on tcp/3333
Error: No symbols for FreeRTOS
Info : cpu0: Target halted, PC=0x400916EA, debug_reason=00000001
Info : Flash mapping 0: 0x10020 -> 0x3f400020, 21 KB
Info : Flash mapping 1: 0x20020 -> 0x400d0020, 74 KB
Info : Using flash bank 'esp32.irom' size 76 KB
Info : cpu0: Target halted, PC=0x400916EA, debug_reason=00000001
Info : Flash mapping 0: 0x10020 -> 0x3f400020, 21 KB
Info : Flash mapping 1: 0x20020 -> 0x400d0020, 74 KB
Info : Using flash bank 'esp32.drom' size 24 KB
Error: GDB missing ack(2) - assumed good
Info : dropped 'gdb' connection
com.jetbrains.cidr.execution.debugger.backend.gdb.GDBDriver$GDBCommandException: Remote replied unexpectedly to 'vMustReplyEmpty': PacketSize=3fff;qXfer:memory-map:read+;qXfer:features:read-;qXfer:threads:read+;QStartNoAckMode+;vContSupported+
Debugger disconnected
If I start the debugging process just using the terminal it works and the program is halted:
$ openocd -f board/esp32-wroom-ft232h.cfg
Open On-Chip Debugger  v0.10.0-esp32-20191114 (2019-11-14-14:15)
Licensed under GNU GPL v2
For bug reports, read
	http://openocd.org/doc/doxygen/bugs.html
none separate
adapter speed: 20000 kHz
Info : Configured 2 cores
Info : Listening on port 6666 for tcl connections
Info : Listening on port 4444 for telnet connections
Error: type 'esp32' is missing virt2phys
Info : ftdi: if you experience problems at higher adapter clocks, try the command "ftdi_tdo_sample_edge falling"
Info : clock speed 20000 kHz
Info : JTAG tap: esp32.cpu0 tap/device found: 0x120034e5 (mfg: 0x272 (Tensilica), part: 0x2003, ver: 0x1)
Info : JTAG tap: esp32.cpu1 tap/device found: 0x120034e5 (mfg: 0x272 (Tensilica), part: 0x2003, ver: 0x1)
Info : Target halted. CPU0: PC=0x40000400 (active)
Info : Target halted. CPU1: PC=0x40000400
Info : Listening on port 3333 for gdb connections


