The Canvas-Flowmap-Layer extends the ArcGIS API for JavaScript (Esri JSAPI) to map the flow of objects from an origin point to a destination point by using a Bezier curve. Esri graphics are translated to pixel space so that rendering for the points and curves are mapped to an HTMLCanvasElement.
Demos: View the comparison "sandbox" demo and the main demo.
Table of Contents
Flow mapping is a cartographic necessity, yet still lacks empirical design rules (Jenny, et al. 2016). Common solutions for dynamic flow mapping include using straight lines and geodesic lines, both of which have immediate visual limitations. Using a Bezier curve for flow map lines, where each curve on the map is created with the same formula benefits mappers twofold:
1. Aesthetics. While straight lines are not inherently ugly, an overlapping or convergence of them across a global dataset can be. A series of Bezier curves created with the same formula, even when displaying an over-abundance, has a mathematical congruent flow which greatly improves the map's aesthetics.
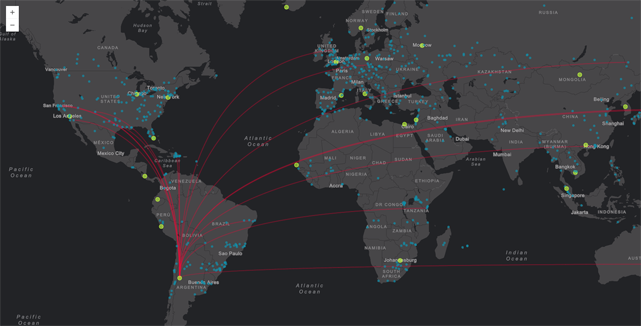
2. Directional symbology. Whether the curve is convex or concave depends on the direction of the line. This symbology might be too new immediately intuit, however this rule is required for aesthetic veracity and consistency. The bonus is that map readers can immediately know the direction of the line without having to add animation.
The convexity or concavity of the curve does convey the direction of the flow line, but the directionality won't be easily intuited due to its novelty. In the event that this mapping technique catches like 🔥 wildfire 🔥, we can delete the second part of the previous sentence. In the mean time, we've added line animations, similar to the "ants marching" effect, but with many nice easing effects inspired by both the tween.js library and this Kirupa post.
The Canvas-Flowmap-Layer uses two separate lines when animation is added, although using two lines is not required to achieve animation. The first line is the solid, static Bezier curve, and the second line is the dotted or hashed animated Bezier curve that sits on top of the static line.
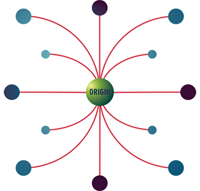
The demo pages provided in this repository show three different types of data relationships that can be used to add lines to the map: one-to-many; many-to-one; one-to-one, where the first part of these relationships indicate the origin ("one" or "many"), and the last part indicates the destination. There are three different csv files used for our demo pages of the Canvas-Flowmap-Layer, one for each data relationship type.
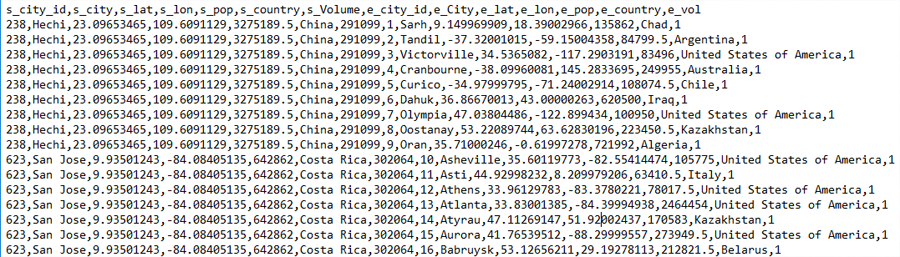
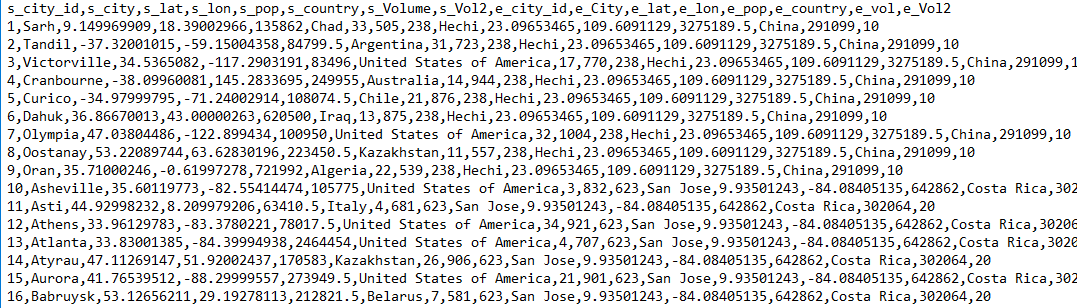
In the one-to-many csv file, the one or origin exists on several rows - one row for each of its destinations. Each destination in the one-to-many is only listed on one row, which is the same row as its origin. So the number of rows for each origin is determined by the number of destinations it supplies. In the image below, The city of Hechi and San Jose are both origins; Hechi supplies 9 destinations: Sahr, Tandil, Victorville, Cranbourne, Cuirco, Dahuk, Olympia, Oostanay, and Oran.
The many-to-one csv file for this implementation of the Canvas-Flowmap-Layer is similar to the concept of the one-to-many csv file explained above. In the image below, many origin cities supply the one city of Hechi.
In the csv file for the one-to-one data relationship, each origin exists on one row only along with its one destination.
The animations rely on the tween.js library to assist with changing the underlying line property values as well as providing many different easing functions and durations. See the setAnimationDuration() and setAnimationEasing() method descriptions below for more information.
You can change how users interact with the CanvasFlowmapLayer by controlling which Bezier curves appear and disappear at any time. The demos we provide show how to do this in several ways with JSAPI click and mouse-over events, coupled with using this layer's selectGraphicsForPathDisplay method.
For example, you could listen for a click event and then choose to either add to your "selection" of displayed Bezier curves, subtract from your selection, or establish a brand new selection. Alternatively, you can set the pathDisplayMode to 'all' when constructing the layer to display every Bezier curve at once.
The Canvas-Flowmap-Layer has default symbology established for origin points, destination points, Bezier curves, and animated Bezier curves. You can change these defaults using the various symbol configuration objects (e.g. originCircleProperties, destinationCircleProperties, pathProperties, animatePathProperties, etc.).
Symbol configurations are defined using property objects inspired by the ArcGIS REST API renderer objects specification. Simple, unique value, and class breaks are all supported but instead use canvas stroke and line style property names.
The provided demo pages show some examples of these symbol configuration objects (see config.js files).
This extends the ArcGIS API for JavaScript (v3.x) esri/layers/GraphicsLayer. All properties, methods, and events provided by the GraphicsLayer are available in the CanvasFlowmapLayer, with custom features described below.
// an example of constructing a new layer
var canvasFlowmapLayer = new CanvasFlowmapLayer({
  // JSAPI GraphicsLayer constructor properties can be used
  id: 'myCanvasFlowmapLayer',
  visible: true,

  // CanvasFlowmapLayer custom constructor properties -- see property table below

  // - required property
  //that informs the layer of your unique origin/destination attributes and geometry
  originAndDestinationFieldIds: {/* all kinds of important stuff here...see docs below */},

  // - some optional properties
  pathDisplayMode: 'selection',
  animationStarted: true,
  animationDuration: 2000,
  animationEasingFamily: 'Cubic',
  animationEasingType: 'In'
});

// construct an array of esri/Graphic yourself and add them to the layer
canvasFlowmapLayer.addGraphics([pointGraphic1, pointGraphic2, ..., pointGraphic100]);

// add the layer to your JSAPI map
map.addLayer(canvasFlowmapLayer);| Property | Description |
|---|---|
animationDuration |
See setAnimationDuration() method description below. |
animationEasingFamily |
See setAnimationEasing() method description below. |
animationEasingType |
See setAnimationEasing() method description below. |
| Property | Description |
|---|---|
originAndDestinationFieldIds |
Required. Object. This object informs the layer of your unique origin and destination attributes (fields). Both origins and destinations need to have their own unique ID attribute and geometry definition. See example below which includes minimum required object properties. |
originCircleProperties |
Optional. Object. This object defines the symbol properties of the origin point as rendered on the canvas. |
destinationCircleProperties |
Optional. Object. This object defines the symbol properties of the destination point as rendered on the canvas. |
pathProperties |
Optional. Object. This object defines the symbol properties of the non-animated Bezier curve that is drawn on the canvas connecting an origin point to a destination point. |
animatePathProperties |
Optional. Object. This defines the symbol properties of the animated Bezier curve that is drawn on the canvas directly on top of the non-animated Bezier curve. See Line Animation info above. |
pathDisplayMode |
Optional. String. Valid values: 'selection' or 'all'. Defaults to 'all'. |
wrapAroundCanvas |
Optional. Boolean. Defaults to true. Ensures that canvas features will be drawn beyond +/-180 longitude. |
animationStarted |
Optional. Boolean. Defaults to false. This can be set during construction, but you should use the playAnimation and stopAnimation methods to control and change animations after layer construction. |
originHighlightCircleProperties |
Optional. Object. This object defines the symbol properties of the origin point as rendered on the canvas when highlighted. |
destinationHighlightCircleProperties |
Optional. Object. This object defines the symbol properties of the destination point as rendered on the canvas when highlighted. |
// you must fill in each of these values for these required properties,
// using the schema of your own data
{
  originUniqueIdField: 'start_id',
  originGeometry: {
    x: 'start_longitude',
    y: 'start_latitude',
    spatialReference: {
      wkid: 4326
    }
  },
  destinationUniqueIdField: 'end_id',
  destinationGeometry: {
    x: 'end_lon',
    y: 'end_lat',
    spatialReference: {
      wkid: 4326
    }
  }
}| Method | Arguments | Description |
|---|---|---|
addGraphics( inputGraphics ) |
inputGraphics: Array of Esri graphics. |
This method will prove to be one of your best friends. It is the main "entry point" for adding to the layer the origin-destination graphics you are responsible for creating from your own data source. |
selectGraphicsForPathDisplay( selectionGraphics, selectionMode ) |
selectionGraphics: Array of Esri graphics that were already added to the layer. selectionMode: String. Valid values: 'SELECTION_NEW', 'SELECTION_ADD', or 'SELECTION_SUBTRACT'. |
This informs the layer which Bezier curves should be drawn on the map. For example, you can most easily use this in conjunction with a click or mouse-over event listener. |
selectGraphicsForPathDisplayById( uniqueOriginOrDestinationIdField, idValue, originBoolean, selectionMode ) |
This is a convenience method if the unique origin or destination value is already known and you do not wish to rely on a click or mouse-over event listener. |
|
clearAllPathSelections() |
This informs the layer to unselect (and thus hide) all Bezier curves. | |
playAnimation() |
This starts and shows Bezier curve animations. | |
stopAnimation() |
This stops and hides any Bezier curve animations. | |
setAnimationDuration( duration ) |
duration: Optional. Number in milliseconds. |
This changes the animation duration. |
setAnimationEasing( easingFamily, easingType ) |
easingFamily: String. easingType: String. See getAnimationEasingOptions() method for info on valid values. |
This changes the animation easing function with the help of the tween.js library. |
getAnimationEasingOptions() |
Returns information on valid easingFamily and easingType values based on the tween.js library. |
|
selectGraphicsForHighlight( selectionGraphics, selectionMode ) |
selectionGraphics: Array of Esri graphics that were already added to the layer. selectionMode: String. Valid values: 'SELECTION_NEW', 'SELECTION_ADD', or 'SELECTION_SUBTRACT'. |
This informs the layer which origin/destination points should be "highlighted" when drawn on the map, which just applies the highlight symbology instead of the default symbology to the points. For example, you can most easily use this in conjunction with a click or mouse-over event listener. |
clearAllHighlightSelections() |
This informs the layer to "un-highlight" (and thus remove highlight symbology) all Bezier curves. |
| Event | Description |
|---|---|
click |
Extends GraphicsLayer click and adds the following properties to the event object: isOriginGraphic: true if an origin graphic has been clicked, but false if a destination graphic has been clicked. sharedOriginGraphics: Array of Esri graphics that share the same origin. sharedDestinationGraphics: Array of Esri graphics that share the same destination. |
mouse-over |
Extends GraphicsLayer mouse-over and adds the following properties to the event object: isOriginGraphic: true when the mouse first entered an origin graphic, but false when the mouse first entered a destination graphic. sharedOriginGraphics: Array of Esri graphics that share the same origin. sharedDestinationGraphics: Array of Esri graphics that share the same destination. |
A copy of the license is available in the repository's LICENSE file.


