Giter VIP home page Giter VIP logo

dcajasn / riskfolio-lib Goto Github PK

View Code? Open in Web Editor NEW
2.7K 74.0 466.0 103.89 MB

Portfolio Optimization and Quantitative Strategic Asset Allocation in Python

Home Page: https://riskfolio-lib.readthedocs.io/en/latest/examples.html

License: BSD 3-Clause "New" or "Revised" License

Python 4.55% C++ 80.81% CMake 2.27% Shell 0.18% C 2.59% HTML 0.12% Cuda 0.97% Fortran 8.35% XSLT 0.04% JavaScript 0.05% CSS 0.04% Makefile 0.01% R 0.01%
portfolio-optimization convex-optimization stepwise-regression duration-matching drawdown-model sharpe-ratio trading investment finance asset-allocation

riskfolio-lib's Introduction

Riskfolio-Lib

Quantitative Strategic Asset Allocation, Easy for Everyone.

Buy Me a Coffee at ko-fi.com

GitHub stars Downloads Documentation Status GitHub license Binder

Star History Chart

Description

Riskfolio-Lib is a library for making quantitative strategic asset allocation or portfolio optimization in Python made in Peru 🇵🇪. Its objective is to help students, academics and practitioners to build investment portfolios based on mathematically complex models with low effort. It is built on top of CVXPY and closely integrated with Pandas data structures.

Some of key functionalities that Riskfolio-Lib offers:

  • Mean Risk and Logarithmic Mean Risk (Kelly Criterion) Portfolio Optimization with 4 objective functions:

    • Minimum Risk.
    • Maximum Return.
    • Maximum Utility Function.
    • Maximum Risk Adjusted Return Ratio.
  • Mean Risk and Logarithmic Mean Risk (Kelly Criterion) Portfolio Optimization with 22 convex risk measures:

    Dispersion Risk Measures:

    • Standard Deviation.
    • Square Root Kurtosis.
    • Mean Absolute Deviation (MAD).
    • Gini Mean Difference (GMD).
    • Conditional Value at Risk Range.
    • Tail Gini Range.
    • Range.  

    Downside Risk Measures:

    • Semi Standard Deviation.
    • Square Root Semi Kurtosis.
    • First Lower Partial Moment (Omega Ratio).
    • Second Lower Partial Moment (Sortino Ratio).
    • Conditional Value at Risk (CVaR).
    • Tail Gini.
    • Entropic Value at Risk (EVaR).
    • Relativistic Value at Risk (RLVaR).
    • Worst Case Realization (Minimax).  

    Drawdown Risk Measures:

    • Average Drawdown for uncompounded cumulative returns.
    • Ulcer Index for uncompounded cumulative returns.
    • Conditional Drawdown at Risk (CDaR) for uncompounded cumulative returns.
    • Entropic Drawdown at Risk (EDaR) for uncompounded cumulative returns.
    • Relativistic Drawdown at Risk (RLDaR) for uncompounded cumulative returns.
    • Maximum Drawdown (Calmar Ratio) for uncompounded cumulative returns.
  • Risk Parity Portfolio Optimization with 18 convex risk measures:

    Dispersion Risk Measures:

    • Standard Deviation.
    • Square Root Kurtosis.
    • Mean Absolute Deviation (MAD).
    • Gini Mean Difference (GMD).
    • Conditional Value at Risk Range.
    • Tail Gini Range.  

    Downside Risk Measures:

    • Semi Standard Deviation.
    • Square Root Semi Kurtosis.
    • First Lower Partial Moment (Omega Ratio)
    • Second Lower Partial Moment (Sortino Ratio)
    • Conditional Value at Risk (CVaR).
    • Tail Gini.
    • Entropic Value at Risk (EVaR).
    • Relativistic Value at Risk (RLVaR).  

    Drawdown Risk Measures:

    • Ulcer Index for uncompounded cumulative returns.
    • Conditional Drawdown at Risk (CDaR) for uncompounded cumulative returns.
    • Entropic Drawdown at Risk (EDaR) for uncompounded cumulative returns.
    • Relativistic Drawdown at Risk (RLDaR) for uncompounded cumulative returns.
  • Hierarchical Clustering Portfolio Optimization: Hierarchical Risk Parity (HRP) and Hierarchical Equal Risk Contribution (HERC) with 24 risk measures using naive risk parity:

    Dispersion Risk Measures:

    • Standard Deviation.
    • Variance.
    • Fourth Root Kurtosis.
    • Mean Absolute Deviation (MAD).
    • Range.
    • Conditional Value at Risk Range.
    • Tail Gini Range.  

    Downside Risk Measures:

    • Semi Standard Deviation.
    • Fourth Root Semi Kurtosis.
    • First Lower Partial Moment (Omega Ratio).
    • Second Lower Partial Moment (Sortino Ratio).
    • Value at Risk (VaR).
    • Conditional Value at Risk (CVaR).
    • Tail Gini.
    • Entropic Value at Risk (EVaR).
    • Relativistic Value at Risk (RLVaR).
    • Worst Case Realization (Minimax).  

    Drawdown Risk Measures:

    • Average Drawdown for compounded and uncompounded cumulative returns.
    • Ulcer Index for compounded and uncompounded cumulative returns.
    • Drawdown at Risk (DaR) for compounded and uncompounded cumulative returns.
    • Conditional Drawdown at Risk (CDaR) for compounded and uncompounded cumulative returns.
    • Entropic Drawdown at Risk (EDaR) for compounded and uncompounded cumulative returns.
    • Relativistic Drawdown at Risk (RLDaR) for compounded and uncompounded cumulative returns.
    • Maximum Drawdown (Calmar Ratio) for compounded and uncompounded cumulative returns.
  • Nested Clustered Optimization (NCO) with four objective functions and the available risk measures to each objective:

    • Minimum Risk.
    • Maximum Return.
    • Maximum Utility Function.
    • Equal Risk Contribution.
  • Worst Case Mean Variance Portfolio Optimization.

  • Relaxed Risk Parity Portfolio Optimization.

  • Ordered Weighted Averaging (OWA) Portfolio Optimization.

  • Portfolio optimization with Black Litterman model.

  • Portfolio optimization with Risk Factors model.

  • Portfolio optimization with Black Litterman Bayesian model.

  • Portfolio optimization with Augmented Black Litterman model.

  • Portfolio optimization with constraints on tracking error and turnover.

  • Portfolio optimization with short positions and leveraged portfolios.

  • Portfolio optimization with constraints on number of assets and number of effective assets.

  • Portfolio optimization with constraints based on graph information.

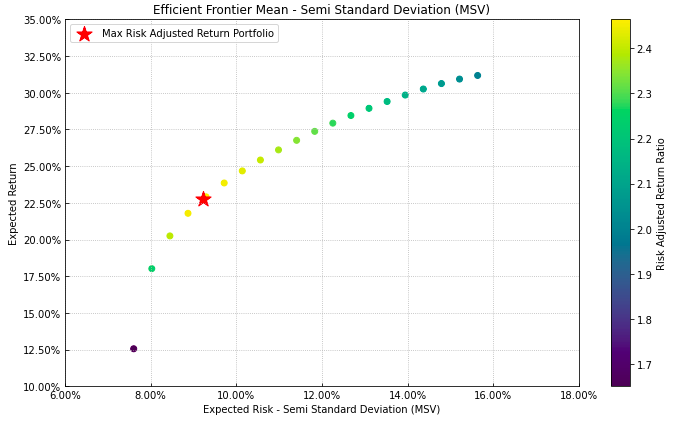
  • Tools to build efficient frontier for 22 convex risk measures.

  • Tools to build linear constraints on assets, asset classes and risk factors.

  • Tools to build views on assets and asset classes.

  • Tools to build views on risk factors.

  • Tools to build risk contribution constraints per asset classes.

  • Tools to build bounds constraints for Hierarchical Clustering Portfolios.

  • Tools to calculate risk measures.

  • Tools to calculate risk contributions per asset.

  • Tools to calculate uncertainty sets for mean vector and covariance matrix.

  • Tools to calculate assets clusters based on codependence metrics.

  • Tools to estimate loadings matrix (Stepwise Regression and Principal Components Regression).

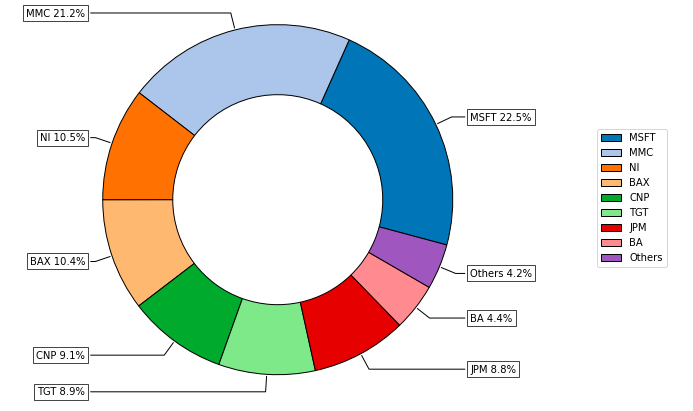
  • Tools to visualizing portfolio properties and risk measures.

  • Tools to build reports on Jupyter Notebook and Excel.

  • Option to use commercial optimization solver like MOSEK or GUROBI for large scale problems.

Documentation

Online documentation is available at Documentation.

The docs include a tutorial with examples that shows the capacities of Riskfolio-Lib.

Choosing a Solver

Due to Riskfolio-Lib is based on CVXPY, Riskfolio-Lib can use the same solvers available for CVXPY. The list of solvers compatible with CVXPY is available in Choosing a solver section of CVXPY's documentation. However, to select an adequate solver for each risk measure we can use the following table that specifies which type of programming technique is used to model each risk measure.

Risk Measure LP QP SOCP SDP EXP POW
Variance (MV) X X*
Mean Absolute Deviation (MAD) X
Gini Mean Difference (GMD) X**
Semi Variance (MSV) X
Kurtosis (KT) X
Semi Kurtosis (SKT) X
First Lower Partial Moment (FLPM) X
Second Lower Partial Moment (SLPM) X
Conditional Value at Risk (CVaR) X
Tail Gini (TG) X**
Entropic Value at Risk (EVaR) X
Relativistic Value at Risk (RLVaR) X**
Worst Realization (WR) X
CVaR Range (CVRG) X
Tail Gini Range (TGRG) X**
Range (RG) X
Average Drawdown (ADD) X
Ulcer Index (UCI) X
Conditional Drawdown at Risk (CDaR) X
Entropic Drawdown at Risk (EDaR) X
Relativistic Drawdown at Risk (RLDaR) X**
Maximum Drawdown (MDD) X

(*) When SDP graph theory constraints are included. In the case of integer programming graph theory constraints, the model assume the SOCP formulation.

(**) For these models is highly recommended to use MOSEK as solver, due to in some cases CLARABEL cannot find a solution and SCS takes too much time to solve them.

LP - Linear Programming refers to problems with a linear objective function and linear constraints.

QP - Quadratic Programming refers to problems with a quadratic objective function and linear constraints.

SOCP - Second Order Cone Programming refers to problems with second-order cone constraints.

SDP - Semidefinite Programming refers to problems with positive semidefinite constraints.

EXP - refers to problems with exponential cone constraints.

POW - refers to problems with 3-dimensional power cone constraints.

Dependencies

Riskfolio-Lib supports Python 3.8|.

Installation requires:

Installation

The latest stable release (and older versions) can be installed from PyPI:

pip install riskfolio-lib

Citing

If you use Riskfolio-Lib for published work, please use the following BibTeX entry:

@misc{riskfolio,
      author = {Dany Cajas},
      title = {Riskfolio-Lib (6.0.0)},
      year  = {2024},
      url   = {https://github.com/dcajasn/Riskfolio-Lib},
      }

Development

Riskfolio-Lib development takes place on Github: https://github.com/dcajasn/Riskfolio-Lib

Consulting Fees

Riskfolio-Lib is an open-source project, but since it's a project that is not financed for any institution, I started charging for consultancies that are not related to errors in source code. Our fees are as follows:

  • $ 25 USD (United States Dollars) per question that doesn't require to check code.
  • $ 50 USD to check a small size script or code (less than 200 lines of code). The fee of the solution depends on the complexity of the solution:
    • $ 50 USD for simple errors in scripts (modify less than 10 lines of code).
    • For most complex errors the fee depends on the complexity of the solution but the fee is $ 150 USD per hour.
  • $ 100 USD to check a medium size script or code (between 201 and 600 lines of code). The fee of the solution depends on the complexity of the solution:
    • $ 50 USD for simple errors in scripts (modify less than 10 lines of code).
    • For most complex errors the fee depends on the complexity of the solution but the fee is $ 150 USD per hour.
  • For large size script or code (more than 600 lines of code) the fee is variable depending on the size of the code. The fee of the solution depends on the complexity of the solution:
    • $ 50 USD for simple errors in scripts (modify less than 10 lines of code).
    • For most complex errors the fee depends on the complexity of the solution but the fee is $ 150 USD per hour.

All consulting must be paid in advance.

You can contact me through:

You can pay using one of the following channels:

RoadMap

The plan for this module is to add more functions that will be very useful to asset managers.

  • Add more functions based on suggestion of users.

riskfolio-lib's People

Contributors

dcajasn avatar lqhuang avatar microprediction avatar ryanrussell avatar

Stargazers

 avatar  avatar  avatar  avatar  avatar  avatar  avatar  avatar  avatar  avatar  avatar  avatar  avatar  avatar  avatar  avatar  avatar  avatar  avatar  avatar  avatar  avatar  avatar  avatar  avatar  avatar  avatar  avatar  avatar  avatar  avatar  avatar  avatar  avatar  avatar  avatar  avatar  avatar  avatar  avatar  avatar  avatar  avatar  avatar  avatar  avatar  avatar  avatar  avatar  avatar  avatar  avatar  avatar  avatar  avatar  avatar  avatar  avatar  avatar  avatar  avatar  avatar  avatar  avatar  avatar  avatar  avatar  avatar  avatar  avatar  avatar  avatar  avatar  avatar  avatar  avatar  avatar  avatar  avatar  avatar  avatar  avatar  avatar  avatar  avatar  avatar  avatar  avatar  avatar  avatar  avatar  avatar  avatar  avatar  avatar  avatar  avatar  avatar  avatar  avatar

Watchers

 avatar  avatar  avatar  avatar  avatar  avatar  avatar  avatar  avatar  avatar  avatar  avatar  avatar  avatar  avatar  avatar  avatar  avatar  avatar  avatar  avatar  avatar  avatar  avatar  avatar  avatar  avatar  avatar  avatar  avatar  avatar  avatar  avatar  avatar  avatar  avatar  avatar  avatar  avatar  avatar  avatar  avatar  avatar  avatar  avatar  avatar  avatar  avatar  avatar  avatar  avatar  avatar  avatar  avatar  avatar  avatar  avatar  avatar  avatar  avatar  avatar  avatar  avatar  avatar  avatar  avatar  avatar  avatar  avatar  avatar  avatar  avatar  avatar  avatar

riskfolio-lib's Issues

How to fix "The problem doesn't have a solution with actual input parameters"

Hi,

Thanks for publishing this great package! And my pleasure to be the first here!
I’m trying to adapt couple of samples to test on a custom alpha estimates, using an industry constraints and MaxRet target, but the optimize consistently generate message saying:

The problem doesn't have a solution with actual input parameters

Here is the constrains:

Disabled | Type | Set | Position | Sign | Weight | Type Relative | Relative Set | Relative | Factor
FALSE | All Assets | | | <= | 0.08 | | | |
FALSE | All Classes | Industry | | <= | 0.25 | | | |
FALSE | All Classes | Industry | | >= | 0.03 | | | |

There are around 250 assets (stocks) and their respective Industries have been mapped, and the asset_classes matrix has been created.

What may have been the reason that the ‘solution’ couldn’t be found? Where should I look at to find the fix?

Thanks,

CAGR calc in PlotFunctions.py

days = (returns.index[-1] - returns.index[0]).days + ini_days

np.power(np.prod(1 + X), 360 / days) - 1,

Hi - quick question with CAGR -- having trouble reproducing your number and wanted to ask if your comfortable with the consistency of ini_days usage. More specifically, where use monthly data, returns index is month end dates and ini_days set to 21 based on 252 days per year, a) is this CAGR calculation ok with the 360 hardcode in line 1413, and b) days calculation ok in 1373?

btw, thanks again for your lovely and very generous contribution with this library.

Feature Request: Annualized Returns (CAGR)

Thanks for such a great library! I especially like the new tearsheet reports. Would it be possible to report annualized returns (and standard deviations), since that's what most people are familiar with, and what most other tools / services use? I'm thinking specifically on the report and on efficient frontier plots. Thanks!

Risk_Budgeting Approach

Greetings from Shanghai, China.
Great job, and thx for sharing this module.
I wonder if this module could be updated to have a "risk_budget" charateristic.
i.e. we have sp500, gold and 10y_bond 3 assets
we put hist ret into the module and we want sp500 to contribute 50% of totol portfolio risk, gold 20%, and 10y_bond 30% along with choices of different risk measures(i.e. downside std). [I couldn't find this method in your posted tutorials]
again thank you for your excellent work, hope everything goes well with you

how essential is arch?

How essential is arch to have in setup? I ask because it's a bit of a headache on mac silicon.

Trying to reproduce "Minimum Variance" setup from Portfolio Visualizer - what am I doing wrong?

Hello!

I am trying to reproduce with your library the "minimum variance" setup from portfolio visualizer. I have 3 assets that I am importing following the tutorial, and then using the wc_optimization method, but it gives me an error.

My code is like this :
import riskfolio as rp

port = rp.Portfolio(returns=Y)
method_mu='hist' # Method to estimate expected returns based on historical data.
method_cov='hist' # Method to estimate covariance matrix based on historical data.
port.assets_stats(method_mu=method_mu, method_cov=method_cov, d=0.94)
w = port.wc_optimization(obj='Sharpe', rf=0, l=2, Umu='box', Ucov='box')
display(w.T)

Gives me this error:
AttributeError Traceback (most recent call last)
in ()
22 # w = port.optimization(model=model, rm=rm, obj=obj, rf=rf, l=l, hist=hist)
23
---> 24 w = port.wc_optimization(obj='Sharpe', rf=0, l=2, Umu='box', Ucov='box')
25
26 display(w.T)

/usr/local/lib/python3.7/dist-packages/riskfolio/Portfolio.py in wc_optimization(self, obj, rf, l, Umu, Ucov)
1924 returns = self.returns.to_numpy()
1925
-> 1926 cov_l = self.cov_l.to_numpy()
1927 cov_u = self.cov_u.to_numpy()
1928 cov_mu = self.cov_mu.to_numpy()

AttributeError: 'NoneType' object has no attribute 'to_numpy'

The complete Colab file is here : https://colab.research.google.com/drive/15pCwwZQPk3oAvCkX5SL5fBtnmAXE3N0p?usp=sharing

What am I doing wrong? What is the best way ro reproduce the "Minimum Variance" setup from Portfolio Visualizer?

Tutorial 5, In[12] - "Length mismatch"

Hello Dany!

Thanks for your great and comprehensive work.

When running Tutorial 5 without any amendment from my side all goes well until

In [12] #Building a loop that estimate optimal portfolios on rebalancing dates

Error message: The problem doesn't have a solution with actual input parameters.

Value error: Length mismatch: Expected axis has 0 elements, new values have 29 elements.

~\AppData\Roaming\Python\Python38\site-packages\pandas\core\internals\managers.py in set_axis(self, axis, new_labels)
224
225 if new_len != old_len:
--> 226 raise ValueError(
227 f"Length mismatch: Expected axis has {old_len} elements, new "
228 f"values have {new_len} elements"

index_ is
[1005,
1066,
1129,
1193,
1257,
1318,
1381,
1445,
1509,
1570,
1634,
1698,
1761,
1823,
1886,
1949,
2012,
2073,
2137,
2200,
2263,
2324,
2387,
2451,
2515,
2577,
2640,
2704,
2767]

weights, w, models[j], are empty df with shape(0,0).

Can you please help?

Thank you very much in advance!

Runtime error

Hi Dany,

I am getting this warning:

/Users/opt/anaconda3/envs/Spyder_env/lib/python3.8/site-packages/riskfolio/RiskFunctions.py:356: RuntimeWarning: overflow encountered in exp
  value = np.mean(np.exp(-1 / z * a), axis=0)

It was not the case before I did an update to Anacoda.

UnboundLocalError: local variable 'dist' referenced before assignment

I am suddenly getting an error that I was not getting before:

port = rp.HCPortfolio(returns=rets_training)

model='HERC' # Could be HRP or HERC
codependence = 'ward' # Correlation matrix used to group assets in clusters
rm = 'MV' # Risk measure used, this time will be variance
rf = 0 # Risk free rate
linkage = 'ward' # Linkage method used to build clusters
max_k = 10 # Max number of clusters used in two difference gap statistic
leaf_order = True # Consider optimal order of leafs in dendrogram


w = port.optimization(model=model,
                      codependence=codependence,
                      rm=rm,
                      rf=rf,
                      linkage=linkage,
                      max_k=max_k,
                      leaf_order=leaf_order)

image

Alpha hardcoded

ax[[1, 5]] = plf.plot_drawdown(nav=nav, w=w, alpha=0.05, ax=ax[[1, 5]])

Hi - is alpha meant to be hardcoded?

Also consider (if you feel appropriate) doing ax[[1, 2]] instead of ax[[1, 5]] as from a reading perspective seeing visual cum returns followed by uncompounded DD might be more intuitive to readers.

I hope I am not annoying you with these minor QA issues on your code I am raising -- apologies if I am.

Feature request: constrained risk budgeting allocation

Hello all!

I would have a small feature request, which I believe would be rather simple to implement given its closeness to "pure" risk parity calculation: could we get an implementation of the constrained risk budgeting allocation like done on this library here: https://github.com/jcrichard/pyrb based on the whitepaper here: Constrained Risk Budgeting Portfolios: Theory, Algorithms, Applications & Puzzles
The main idea is the exact same as risk parity, but it allows to allocate various risk budget to various assets instead of splitting the risk evenly between them. It can be used for example to risk-balance a portfolio of bonds and equity ETFs allowing bonds to take 25% of the risk and equities to take 75% of the risk. It is extremely useful to fine-tune risk allocation based on the idea of risk parity.

Issue with assets_stats method in Tutorial 5.ipynb

In section 3.2 of the Tutorial 5, where:

############################################################
# Building a loop that estimate optimal portfolios on
# rebalancing dates
############################################################

begins,

I first get error:
AttributeError: type object 'Portfolio' has no attribute 'Portfolio'

This I fixed using:

import riskfolio as rp
port = rp.HCPortfolio(returns=Y)

But then I get:
AttributeError: 'HCPortfolio' object has no attribute 'assets_stats'

Is it possible you could update the tutorial, or point to the fix to run the rest of the example?

Custom risk measure function for HERC method

Hi Dany,

Thank you for providing us such an amazing library, I really appreciate it.

I would be grateful if you could provide support for custom risk measure for HERC method here.

I would like to

Best regards,

type object 'HCPortfolio' has no attribute 'HCPortfolio'

I am not I understand why I get this error:

type object 'HCPortfolio' has no attribute 'HCPortfolio'

The code is the same from the examples

import riskfolio.HCPortfolio as hc

hc.HCPortfolio

# Building the portfolio object
port = hc.HCPortfolio(returns=Y)

# Estimate optimal portfolio:

model='HRP' # Could be HRP or HERC
correlation = 'pearson' # Correlation matrix used to group assets in clusters
rm = 'MV' # Risk measure used, this time will be variance
rf = 0 # Risk free rate
linkage = 'single' # Linkage method used to build clusters
max_k = 10 # Max number of clusters used in two difference gap statistic, only for HERC model
leaf_order = True # Consider optimal order of leafs in dendrogram

w = port.optimization(model=model,
                      codependence=correlation,
                      rm=rm,
                      rf=rf,
                      linkage=linkage,
                      max_k=max_k,
                      leaf_order=leaf_order)

display(w.T)

But I get:


AttributeError Traceback (most recent call last)
in
1 import riskfolio.HCPortfolio as hc
2
----> 3 hc.HCPortfolio
4
5 # Building the portfolio object

AttributeError: type object 'HCPortfolio' has no attribute 'HCPortfolio'

Custom Estimates for Return

I have a simple question. If I want to use custom estimates for returns in an optimization, do these need to be specified as expected annual returns or daily (assuming my historical return series is daily timestep)?

Custom Objective

Hi, do you have any tutorial on optimizing based on custom objectives, such maximize a set of scores? Thank you!

Predictive measure for portfolio rebalancing

Hi,

I am very new to Riskfolio-lib and very impressed! I was hoping that RFL could implement a ranking strategy using a predictive measure to rebalance the portfolio. The idea is described here and basically involves balancing a portfolio daily based on a prediction value for each equity (probability in my case). Is this something that could be implemented? I have looked through the tutorials and documentation but not sure if this is a capability? Thanks for any guidance!

UnboundLocalError: local variable 'risk' referenced before assignment

Traceback (most recent call last):
  File "/tmp/ipykernel_1100960/1703788391.py", line 84, in objective
    train_portfolio = vbt.Portfolio.from_order_func(
  File "/home/jupyter/Jupyter/notebook/lib/python3.8/site-packages/vectorbt/portfolio/base.py", line 3918, in from_order_func
    order_records, log_records = simulate_func(
  File "/home/jupyter/Jupyter/notebook/lib/python3.8/site-packages/vectorbt/portfolio/nb.py", line 2918, in simulate_nb
    pre_segment_out = pre_segment_func_nb(pre_seg_ctx, *pre_group_out, *pre_segment_args)
  File "/tmp/ipykernel_1100960/2778963701.py", line 28, in pre_segment_func_nb
    best_sharpe_ratio, weights = find_weights_nb(c, close, opt)
  File "/tmp/ipykernel_1100960/2757597337.py", line 21, in riskfolio_find_weights
    w = port.optimization(model='Classic', obj=opt['obj'], rm=opt['rm'], kelly=kelly, rf=rf, hist=opt['hist'])
  File "/home/jupyter/Jupyter/notebook/lib/python3.8/site-packages/riskfolio/Portfolio.py", line 1529, in optimization
    constraints += [risk <= 1]
UnboundLocalError: local variable 'risk' referenced before assignment

Did I miss something? I run an optimization on the parameters. This shows up often.

Thank you for your help.

Relax constraint that weights sum to 1

Is there a simple way to specify an optimization such that the sum of weights need not sum to 1? For example, if I want to maximize return given a risk constraint (such as maximum volatility), and if I am ok that the portfolio weights sum to less than 1, is there an easy way to implement this?

Thanks!

Relative turnover limit

Hi Dany,

This is a great library and you just added the one thing I was missing: cardinal constraints!

I have a question about the turnover constraints. The port.turnover parameter reflects the maximum deviation in absolute value respect to benchmark weights, right? So with a value of 0.05 this means for instance that an asset with benchmark weight 50% should be between 45% and 55% and an asset with benchmark weight 5% should be between 0% and 10%.
Wouldn't it make more sense to have a relative turnover limit? Would it be possible to add the option for relative turnover limits?

Speed up the solver()

Is there any method to make the solve() faster, for example to use multi cpu or gpu?

Risk_Contribution EVaR

Hi,
I got those warnings running Risk_Contribution 'EVaR' .
test = rk.Risk_Contribution(w=weights,cov = covariance,returns = curRet.dropna(axis=0),rm='EVaR',alpha=0.01)
site-packages\riskfolio\RiskFunctions.py:357: RuntimeWarning: divide by zero encountered in log value = z * (np.log(value) + np.log(1 / alpha))
site-packages\scipy\optimize\slsqp.py:63: RuntimeWarning: invalid value encountered in subtract jac[i] = (func(*((x0+dx,)+args)) - f0)/epsilon

And it returns a nan array when all input are without nans.
array([nan, nan, nan, nan, nan, nan, nan, nan, nan, nan, nan, nan, nan,
nan, nan, nan, nan, nan, nan, nan, nan, nan])

Is it a normal behaviour?

Best regards

AttributeError: module 'typing_extensions' has no attribute 'OrderedDictTypedDict'

Hi,
The following error occurs when I import the library:

AttributeError: module 'typing_extensions' has no attribute 'OrderedDictTypedDict'

ImportError Traceback (most recent call last)
~\anaconda3\lib\site-packages\astropy\units_typing.py in
8 try: # py 3.9+
----> 9 from typing import Annotated
10 except (ImportError, ModuleNotFoundError): # optional dependency

ImportError: cannot import name 'Annotated' from 'typing' (C:\Users\domen\anaconda3\lib\typing.py)

During handling of the above exception, another exception occurred:

AttributeError Traceback (most recent call last)
in
----> 1 import riskfolio as rp
2
3 # Plotting Assets Clusters
4
5 ax = rp.plot_dendrogram(returns=Y,

~\anaconda3\lib\site-packages\riskfolio_init_.py in
7 """
8
----> 9 from .Portfolio import *
10 from .HCPortfolio import *
11 from .PlotFunctions import *

~\anaconda3\lib\site-packages\riskfolio\Portfolio.py in
13 from scipy.linalg import sqrtm
14 import riskfolio.RiskFunctions as rk
---> 15 import riskfolio.ParamsEstimation as pe
16 import riskfolio.AuxFunctions as af
17

~\anaconda3\lib\site-packages\riskfolio\ParamsEstimation.py in
14 from sklearn.decomposition import PCA
15 from numpy.linalg import inv
---> 16 import riskfolio.AuxFunctions as au
17 import arch.bootstrap as bs
18

~\anaconda3\lib\site-packages\riskfolio\AuxFunctions.py in
18 import scipy.stats as st
19 from sklearn.metrics import mutual_info_score
---> 20 from astropy.stats import knuth_bin_width, freedman_bin_width, scott_bin_width
21
22 ###############################################################################

~\anaconda3\lib\site-packages\astropy\stats_init_.py in
12 """
13
---> 14 from . import funcs
15 from .funcs import * # noqa
16 from . import biweight

~\anaconda3\lib\site-packages\astropy\stats\funcs.py in
14 import numpy as np
15
---> 16 import astropy.units as u
17 from . import _stats
18

~\anaconda3\lib\site-packages\astropy\units_init_.py in
38
39 from .structured import *
---> 40 from .decorators import *
41
42 del bases

~\anaconda3\lib\site-packages\astropy\units\decorators.py in
11 import numpy as np
12
---> 13 from . import _typing as T
14 from .core import (Unit, UnitBase, UnitsError,
15 add_enabled_equivalencies, dimensionless_unscaled)

~\anaconda3\lib\site-packages\astropy\units_typing.py in
16
17 else:
---> 18 from typing_extensions import * # override typing
19
20 HAS_ANNOTATED = Annotated is not NotImplemented

AttributeError: module 'typing_extensions' has no attribute 'OrderedDictTypedDict'

Any help^ Thanks

The problem doesn't have a solution with actual input parameters

I can not run the following code. How can I fix the problem?

import riskfolio.Portfolio as pf

Building the portfolio object

port = pf.Portfolio(returns=Y)

Calculating optimum portfolio

Load our custom estimates of input parameters

custom_mu = pd.read_excel('custom_posterior_mu.xlsx', engine='openpyxl', index_col=0).T
custom_cov = pd.read_excel('custom_posterior_cov.xlsx', engine='openpyxl', index_col=0)

Input manually the custom parameters:

port.mu = custom_mu / 100 # Custom mean vector.
port.cov = custom_cov / 100 # Custom covariance matrix.

Estimate optimal portfolio:

model='Classic' # Could be Classic (historical), BL (Black Litterman) or FM (Factor Model)
rm = 'MV' # Risk measure used, this time will be variance
obj = 'Sharpe' # Objective function, could be MinRisk, MaxRet, Utility or Sharpe
hist = True # Use historical scenarios for risk measures that depend on scenarios
rf = 0 # Risk free rate
l = 0 # Risk aversion factor, only useful when obj is 'Utility'

w = port.optimization(model=model, rm=rm, obj=obj, rf=rf, l=l, hist=hist)

display(w.T)

The problem doesn't have a solution with actual input parameters

AttributeError Traceback (most recent call last)
in
24 w = port.optimization(model=model, rm=rm, obj=obj, rf=rf, l=l, hist=hist)
25
---> 26 display(w.T)

AttributeError: 'NoneType' object has no attribute 'T'

Architecture issues

Hi Dany.

At first Im want to thanks you a lot, its awesome and very careful project. Examples are very useful too.

Im finded some architectural issues in Riskfolio:

  • Function plot_frontier contains some calculation logic, which must been in a class method efficient_frontier, how it seems to me
  • Risk measures props (measurement name, etc.) are smeared on code - in if statements and etc. Could it be collect risk measures props in dict or class, from which another classes might inharit props, or it can be a config file for example.

Im beginner on Py, its explaining why Im doing all for a long time, but I can try doing that changes and pull it in repo.

Mixed Integer

Does this support mixed integer constraints on the portfolio?

Risk Measure available section [KeyboardInterrupt]

hrp_error1

hrp_error2

hrp_error3

I try to replicate the code shown in , but only change the tickers.

import numpy as np
import pandas as pd
import yfinance as yf
import warnings

warnings.filterwarnings("ignore")
pd.options.display.float_format = '{:.4%}'.format

# Date range
start = '2005-01-01'
end = '2021-12-31'

# Tickers of assets
assets = ['XLB', 'XLV', 'XLC', 'XLK', 'XLF', 'XLP', 'XLI',
          'XLU', 'XLY', 'XLRE', 'XLE']

assets.sort()

# Downloading data
data = yf.download(assets, start = start, end = end)
data = data.loc[:,('Adj Close', slice(None))]
data.columns = assets

However, the Risk Measure available section failed. The 3 attached images are the error messages.

# Risk Measures available:
#
# 'vol': Standard Deviation.
# 'MV': Variance.
# 'MAD': Mean Absolute Deviation.
# 'MSV': Semi Standard Deviation.
# 'FLPM': First Lower Partial Moment (Omega Ratio).
# 'SLPM': Second Lower Partial Moment (Sortino Ratio).
# 'VaR': Conditional Value at Risk.
# 'CVaR': Conditional Value at Risk.
# 'EVaR': Entropic Value at Risk.
# 'WR': Worst Realization (Minimax)
# 'MDD': Maximum Drawdown of uncompounded cumulative returns (Calmar Ratio).
# 'ADD': Average Drawdown of uncompounded cumulative returns.
# 'DaR': Drawdown at Risk of uncompounded cumulative returns.
# 'CDaR': Conditional Drawdown at Risk of uncompounded cumulative returns.
# 'EDaR': Entropic Drawdown at Risk of uncompounded cumulative returns.
# 'UCI': Ulcer Index of uncompounded cumulative returns.
# 'MDD_Rel': Maximum Drawdown of compounded cumulative returns (Calmar Ratio).
# 'ADD_Rel': Average Drawdown of compounded cumulative returns.
# 'DaR_Rel': Drawdown at Risk of compounded cumulative returns.
# 'CDaR_Rel': Conditional Drawdown at Risk of compounded cumulative returns.
# 'EDaR_Rel': Entropic Drawdown at Risk of compounded cumulative returns.
# 'UCI_Rel': Ulcer Index of compounded cumulative returns.

rms = ['vol', 'MV', 'MAD', 'MSV', 'FLPM', 'SLPM',
       'VaR','CVaR', 'EVaR', 'WR', 'MDD', 'ADD',
       'DaR', 'CDaR', 'EDaR', 'UCI', 'MDD_Rel', 'ADD_Rel',
       'DaR_Rel', 'CDaR_Rel', 'EDaR_Rel', 'UCI_Rel']

w_s = pd.DataFrame([])

for i in rms:
    w = port.optimization(model=model,
                          codependence=codependence,
                          rm=i,
                          rf=rf,
                          linkage=linkage,
                          max_k=max_k,
                          leaf_order=leaf_order)

    w_s = pd.concat([w_s, w], axis=1)
    
w_s.columns = rms

Other python code sections can run successfully

Backtrader can't show sharp ratio

Hi Dany,

When i use Tuorial 5 Multi Assets Algorithmic Trading Backtesting with Backtrader code to test my own data, the result can't show sharp ratio. Could you tell me how to fix this problem?
image

TypeError: Linkage matrix 'Z' must contain doubles.

Hi, I am trying out HRP Portfolio, and its unclear from the tutorial which part of the data should be data type doubles.

I tried to convert my df before passing into HCPortfolio, but the error still occurs:

df = df.astype(np.double)

port = hc.HCPortfolio(returns=df)

Backtest using Backtrader issue

I tried running your Backtest with Backtrader example and got stuck at this code:


models = {}

rms = ['MV', 'CVaR', 'WR', 'CDaR']

for j in rms:
    
    weights = pd.DataFrame([])

    for i in index_:
        Y = returns.iloc[i-1000:i,:] # taking last 4 years (250 trading days per year)

        # Building the portfolio object
        port = pf.Portfolio(returns=Y)
        
        # Add portfolio constraints
        port.ainequality = A
        port.binequality = B
        
        # Calculating optimum portfolio

        # Select method and estimate input parameters:

        method_mu='hist' # Method to estimate expected returns based on historical data.
        method_cov='hist' # Method to estimate covariance matrix based on historical data.

        port.assets_stats(method_mu=method_mu, method_cov=method_cov, d=0.94)
        
        # Estimate optimal portfolio:
        
        port.solvers = ['MOSEK']
        port.alpha = 0.05
        model='Classic' # Could be Classic (historical), BL (Black Litterman) or FM (Factor Model)
        rm = j # Risk measure used, this time will be variance
        obj = 'Sharpe' # Objective function, could be MinRisk, MaxRet, Utility or Sharpe
        hist = True # Use historical scenarios for risk measures that depend on scenarios
        rf = 0 # Risk free rate
        l = 0 # Risk aversion factor, only useful when obj is 'Utility'

        w = port.optimization(model=model, rm=rm, obj=obj, rf=rf, l=l, hist=hist)

        if w is None:
            w = weights.tail(1).T
        weights = pd.concat([weights, w.T], axis = 0)
    
    models[j] = weights.copy()
    models[j].index = index_ 

I am getting the following error:

Screen Shot 2021-08-22 at 1 06 50 AM

How can I resolve this? Thank you.

UnboundLocalError: local variable 'pvalues' referenced before assignment

Hi, I am trying out factor models and ran into this error:

UnboundLocalError: local variable 'pvalues' referenced before assignment

which is coming from this line

value = pvalues[pvalues.index != "const"].max()

Probably because for my dataset I didn't run into this condition:

if best_pvalue > new_pvalues[i] and cond_1 <= threshold:

maybe an else condition could help to handle it.

Also, is it uncommon for this to occur? Is it a big deal? If so, how do I change my data/factors to ensure this doesn't occur?

Tracking error

Hi Dany, I am looking for solution for incorporate tracking error as a constraint. In your examples in Tutorial 7 I failed to find out how you incorporate an index. The results are not likely to be correct because you have zero weights on several stocks APA, BMY, HPQ, etc, which is not really possible if you want to track certain index.
Furthermore, how do you calculate tracking error in your codes? is it ex-post: so the standard deviation of historical returns x relative weight , where relative weight = portfolio weights - benchmark weights, or is it ex-ante: so transpose(relative weights)@variance_covirance@relative weights?

User specified covariance matrix

Is possible to use a user-specified covariance matrix in the portfolio optimisation, especially with regards to the HRP or HERC?

I don't see that this possible according to the documentation

Back test tutorials - Transactions costs.

Hi @dcajasn !!

I hope your well.!!
Amazing library, well done, its so excellent!

I was wondering if you could add more back test tutorials, which include slippage and transaction costs.

Also would it be possible to add tear sheet functionality.

Thanks again :).

Kind regards and sincere thanks,
Andrew

number of assets constraint

Hi, First of all, thank you for this wonderful library. I tried example 26 which is regarding the number of assets constraint and I am facing the following issue.
image

Appreciate any help. I also tried other MIP solvers based on the table below however faced the same issue.
image

constraints on HRP do not work

Hi,

I tried to use HRP with bounds on weights but does not seem to work.

# Building the portfolio object
port = rp.HCPortfolio(returns=ret_under_training, w_max=0.25, w_min=0.03)
w = port.optimization(model='HRP')
w

                                                    weights
Aegon Global Equity Market Neut                    0.636207
Artemis UK Select Fund I Acc                       0.025731
BNY Mellon Investment Funds - N                    0.084947
Baillie Gifford American Fund B                    0.013387
Baillie Gifford European Fund B                    0.015596
Baillie Gifford Global Income G                    0.024059
Baillie Gifford Pacific B Acc                      0.031928
Baillie Gifford Positive Change                    0.026448
Fidelity Funds - Global Technology Fund W-acc-gbp  0.020010
MI Chelverton UK Equity Growth                     0.098183
Vanguard FTSE Developed World e                    0.023504

Run examples/Tutorial 1.ipynb and jupyter notebook is restarted

Hi Dany,

Thanks for your great work. Riskfolio-Lib is really fascinating.

I ran examples/Tutorial 1.ipynb and jupyter notebook was restarted As well as .py file in vs code.
The notebook crashed at "port.efficient_frontier" in "2.3 Calculate efficient frontier", the error happened without any information. After tracing, I found it hang at line 2187 of Portfolio.py.

Can you please help?

Thank you very much in advance!

Michael

Issues in JupyterReport and RiskFunctions

Hi Dany,
I actually having some issue with the risk functions, in all of them there is: value.item(), by running my code, I met
AttributeError: 'float' object has no attribute 'item'. How could I fix this issue? And why is it present?

Discrete Optimization

Hi! Hope you are doing very well!

I was searching on the example codes, but I have an issue, does your project have already integrated a function to transform weights from the optimization to discrete weights?

An example: transforming the 10% of participation of "A Random Stock" to 5 (to put an example) Stocks of "A Random Stock", all based on the last price of such stock and the initial investment. Or are those final weights already dependent on the last price of the stock and calculated according to them?

I have seen that when we tried to discretize ideal portfolio weights, different performances can be seen.

I hope I have made myself clear.

Thanks in advance!

use matplotlib from bash shell with plt.show()

Hello,
I am following your very interesting and useful code. Everything is fine (e.g. I can see all the calculations outputs in the tables from tutorial 1, and 2), but I cannot see any of your plots. I check your Portfolio.py and you use matplotlib. Would you please tell me how to get the plots?
I do not use ipynb.
Thank you for your time,
LM

Recommend Projects

  • React photo React

    A declarative, efficient, and flexible JavaScript library for building user interfaces.

  • Vue.js photo Vue.js

    🖖 Vue.js is a progressive, incrementally-adoptable JavaScript framework for building UI on the web.

  • Typescript photo Typescript

    TypeScript is a superset of JavaScript that compiles to clean JavaScript output.

  • TensorFlow photo TensorFlow

    An Open Source Machine Learning Framework for Everyone

  • Django photo Django

    The Web framework for perfectionists with deadlines.

  • D3 photo D3

    Bring data to life with SVG, Canvas and HTML. 📊📈🎉

Recommend Topics

  • javascript

    JavaScript (JS) is a lightweight interpreted programming language with first-class functions.

  • web

    Some thing interesting about web. New door for the world.

  • server

    A server is a program made to process requests and deliver data to clients.

  • Machine learning

    Machine learning is a way of modeling and interpreting data that allows a piece of software to respond intelligently.

  • Game

    Some thing interesting about game, make everyone happy.

Recommend Org

  • Facebook photo Facebook

    We are working to build community through open source technology. NB: members must have two-factor auth.

  • Microsoft photo Microsoft

    Open source projects and samples from Microsoft.

  • Google photo Google

    Google ❤️ Open Source for everyone.

  • D3 photo D3

    Data-Driven Documents codes.