Giter VIP home page Giter VIP logo

modelskill's Introduction

ModelSkill: Flexible Model skill evaluation.

Python version Python package PyPI version

ModelSkill is a python package for scoring MIKE models (other models can be evaluated as well).

Contribute with new ideas in the discussion, report an issue or browse the documentation. Access observational data (e.g. altimetry data) from the sister library WatObs.

Use cases

ModelSkill would like to be your companion during the different phases of a MIKE modelling workflow.

  • Model setup - exploratory phase
  • Model calibration
  • Model validation and reporting - communicate your final results

Installation

From pypi:

> pip install modelskill

Or the development version:

> pip install https://github.com/DHI/modelskill/archive/main.zip

Example notebooks

Workflow

  1. Define ModelResults
  2. Define Observations
  3. Match Observations and ModelResults
  4. Do plotting, statistics, reporting using the Comparer

Read more about the workflow in the getting started guide.

Example of use

Start by defining model results and observations:

>>> import modelskill as ms
>>> mr = ms.DfsuModelResult("HKZN_local_2017_DutchCoast.dfsu", name="HKZN_local", item=0)
>>> HKNA = ms.PointObservation("HKNA_Hm0.dfs0", item=0, x=4.2420, y=52.6887, name="HKNA")
>>> EPL = ms.PointObservation("eur_Hm0.dfs0", item=0, x=3.2760, y=51.9990, name="EPL")
>>> c2 = ms.TrackObservation("Alti_c2_Dutch.dfs0", item=3, name="c2")

Then, connect observations and model results, and extract data at observation points:

>>> cc = ms.match([HKNA, EPL, c2], mr)

With the comparer object, cc, all sorts of skill assessments and plots can be made:

>>> cc.skill().round(2)
               n  bias  rmse  urmse   mae    cc    si    r2
observation                                                
HKNA         385 -0.20  0.35   0.29  0.25  0.97  0.09  0.99
EPL           66 -0.08  0.22   0.20  0.18  0.97  0.07  0.99
c2           113 -0.00  0.35   0.35  0.29  0.97  0.12  0.99

Overview of observation locations

ms.plotting.spatial_overview([HKNA, EPL, c2], mr, figsize=(7,7))
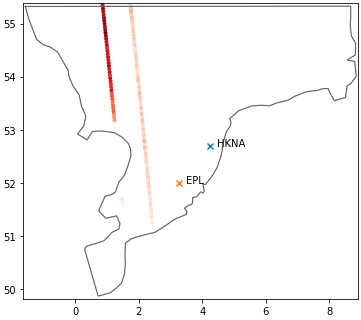
map

Scatter plot

cc.plot.scatter()

scatter

Timeseries plot

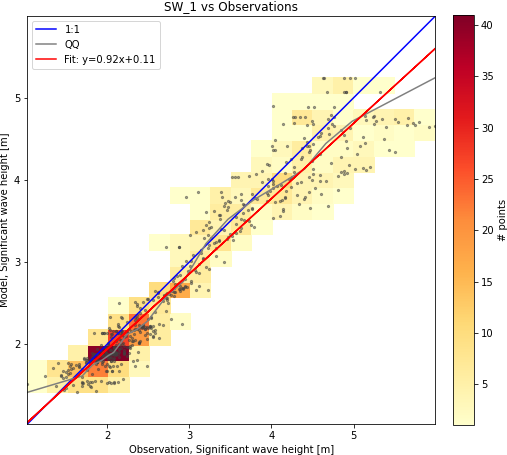
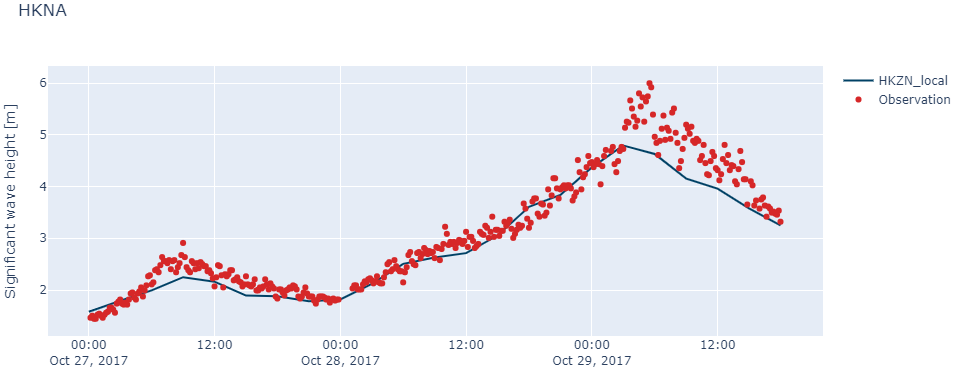
Timeseries plots can either be static and report-friendly (matplotlib) or interactive with zoom functionality (plotly).

cc["HKNA"].plot.timeseries(width=1000, backend="plotly")

timeseries

modelskill's People

Contributors

chrisgaszynski-dhi avatar clemenscremer avatar daniel-caichac-dhi avatar ecomodeller avatar hendrik1987 avatar jpalm3r avatar jsmariegaard avatar pauldanielml avatar rpaldhi avatar ryan-kipawa avatar stkistner avatar

Stargazers

 avatar  avatar  avatar  avatar  avatar  avatar  avatar  avatar  avatar  avatar  avatar  avatar  avatar  avatar  avatar  avatar  avatar  avatar  avatar  avatar  avatar  avatar  avatar  avatar  avatar  avatar  avatar

Watchers

 avatar  avatar  avatar  avatar  avatar  avatar

modelskill's Issues

`scatter` bins should allow sequence of numbers

The current implementation of the scatter plot allows bins to be an integer, i.e. the number of bins or a float, i.e. the bin size, but not as a sequence of numbers.

This is necessary for fine-grained control and consistency across plots.

compare now raises error if no data

Makes one of the notebooks fail ... and me think if it is better to just warn and return an empty Comparer (or None) for workflows where you go through a lot of measurements:

image

Speed up test execution

Is is possible to speed up some of these slow tests, or mark them as slow and only run them in CI?

$ pytest --durations=10
===================================================================================
3.30s call     tests/test_metrics.py::test_pr
1.47s call     tests/test_multivariable_compare.py::test_mv_mm_taylor
1.41s call     tests/test_multimodelcompare.py::test_mm_taylor
1.16s setup    tests/test_multivariable_compare.py::test_mv_mm_taylor
1.15s call     tests/test_multimodelcompare.py::test_mm_scatter
0.87s call     tests/test_combine_comparers.py::test_concat_model_different_time
0.80s call     tests/test_comparer.py::test_minimal_plots
0.79s call     tests/test_multimodelcompare.py::test_custom_metric_skilltable_mm_scatter
0.73s call     tests/regression/test_regression_rose.py::test_wind_rose_image_identical
0.60s call     tests/test_multivariable_compare.py::test_mv_mm_scatter

no mesh info when having model result as .dfs0

In case of loading model results as .dfs0 for track data comparison I am missing info on model domain to retrieve projection as suggested by @ecomodeller here: #27 (comment)

Domain info would also be required for improved spatial plotting.

Should we allow something like ModelResult(fn='my.dfs0', geometry_fn='my_corresponding.dfsu')?

Or what am I missing? Can this already be achieved by adding a second model with .dfsu?

2DHist grid and Scatter Grid

Known issue (maybe not too relevant?) but when using show_hist=True and backend='matplotlib' the Histogram Bins do not match the Axes grid.
One option is to manually give the bins as the axes, or to adjust the axes to match the bins, but it is not yet resolved.
When using backend='plotly' the bins and the grid do match.

Validate options default metrics

The user can select default metrics by assigning a list of strings to fmskill.options.metrics.list. Validation however only occurs upon use (e.g. with cmp.skill() ) and not when the user defines the metrics. This is confusing. It is better to fail fast.

Spatial Skill Error

When trying to follow the example of spatial skill notebook I get an error when adding **kwargs
e.g.:
ss.plot("rmse", model='SW_1', cmap='YlOrRd')
plots the figure with the corresponding cmap but then complains
AttributeError: 'Rectangle' object has no property 'cmap'
same when using
ss.plot("bias", model='SW_1', levels=[-1,0,1])
AttributeError: 'Rectangle' object has no property 'levels'

.sel() returning comparer instead of .sel_df()?

How about a .sel() method that returns a copy of the original comparer with reduced data instead of:
https://github.com/DHI/fmskill/blob/aa1e47d7d0d4d8887faca763270a360d9c4d7da7/fmskill/compare.py#L354

That would allow calls like cc.sel().skill(), cc.sel().scatter() or in the future cc.sel().spatial_skill() without copying all the selection arguments to each method that allows selection.

The dataframe could be still returned via cc.sel().all_df(). Or maybe it should then become cc.sel().to_dataframe().

Further methods can easily be added, as long as they all return a comparer. Example: cc.sel().add_domains().skill(), where add_domains() could be a method to assign data points to sub-domains (#12).

support dataframes with localized timezones

Seems like it is not possible to create a comparer with dataframes with localized timezone.

Exception has occurred: TypeError
'.dt' accessor only available for DataArray with datetime64 timedelta64 dtype or for arrays containing cftime datetime objects.

Model Results failed to initialize

Discussed in #130

Originally posted by conghung June 10, 2022
When I run to initialize the ModelResult with param is file path then throwed the error like below:
FmSkill_Issue_ModelResult
I just use the unit test file provided from source code.

kwords in metrics

Hi,

Very specific request, bu I need to add **kwargs to some metrics, as in

cmp=modelskill.compare(mod=mod,obs=obs)
cmp.skill( metrics=['bias','pr'], AAP=7)
which would change the number annual of peaks in the peak ratio from 2 to 7, but I can't find a way to add these kwargs :(
Also there are already some weight kwarg in some metrics , eg, URMSE
urmse(obs: np.ndarray, model: np.ndarray, weights: Optional[np.ndarray] = None)
I am not sure if I doing this cmp.skill( metrics=['bias','urmse'], weights=0.9) will do anything

ComparerCollection plot kde - title

WIth many observations the title becomes very long and is not useful.
image

For a single comparer it works better, but the title still can not be empty
image

make_unique_index : dt

Hi,
I have been having some trouble when using a track observation with a Scatterometer data instead of Altimetry data against a model (hence in every timestep I have a bunch of measurements instead of a single point; a good analogy would be a single-beam vs multi-beam bathy survey, or a handgun vs a shotgun). I have worked-around this by increasing the dt in the make_unique_index function, by default 0.01
https://github.com/DHI/fmskill/blob/8d858a15004bd95466a51968d7baf27088db196f/fmskill/utils.py#L16
if I change this to a larger value say 0.153 s then my scripts work. My current problem is doing this outside fmskill because the dt argument is hard coded:
https://github.com/DHI/fmskill/blob/8d858a15004bd95466a51968d7baf27088db196f/fmskill/observation.py#L441
Could the dt be an explicit argument in the connector element or in the track observation ?? or maybe it already is and I am not seeing it?
Thanks

Mikeio Spatial gone?

Hi,

I updated both mikeio to 1.6.1 and fmskill to modelskill 1.0 (alpha), had to do some very small refactoring on my repo to make my tests run, and they DO in my laptop, but then they crash when trying to submit pull requests as the pipelines fail due to spatial.FM_geometry module gone or something like that.
This is the error, and basically now I cannot do import modelskill anymore on the cloud
image
I literally just changed import fmskill to import modelskill and it works on my laptop, with mikeio 1.6.1 and fmskill latest cloned repo.

Any suggestions?

In the installed dependencies in the pipeline I have
mikeio-1.6.1
modelskill-1.0a0
so it should be ok, but it is not, for whatever reason

Problem with bin size in spatial_skill

Hi,

I think that there is some problem with bin selection in the spatial plots when the bins are not fully defined by the user
as (min,max,delta).
To exemplify this. I got track observations between Lat=[+31.4 , +65.62] deg
image

then if I define my bin spacing as 0.25deg and make a spatial skill starting from +32deg to +66deg I get data as expected between 32 and 66deg
image
image

but if instead I just go with binsize=0.25 and let fmskill define the min and max Latitude I get
image
image
ie, I see that my data now starts a roughly Latitude=+36deg even though the bin size is still 0.25deg.
I am somehow losing 4deg of data (~400 km of satellite data).
Not ideal. Most likely a bug.

cc: @Hendrik1987

colors when plotting

Hi,
when plotting time series (eg, c.plot_timeseries() ) I cannot choose the colormap.
Right now the workaround is to set the colormap by hand (discrete colors), eg, c._mod_colors[0]='blue' , ._mod_colors[1]='red'
and so on.
It would be nice to have something like

c.plot_timeseries(cmap='tab10')

Thanks

_wind_rose.py wave direction issue

In the source code for _wind_rose.py, the sectors for the wave direction don't include wave directions from 0 to the start of the half_dir_step.

    dir_step = 360 // n_sectors
    half_dir_step = dir_step / 2

    n_dir_labels = n_sectors if n_dir_labels is None else n_dir_labels

    thetai = np.linspace(
        start=half_dir_step,
        stop=360 + half_dir_step,
        num=int(((360 + half_dir_step) - half_dir_step) / dir_step + 1),
    )
    thetac = thetai[:-1] + half_dir_step

In the source code line 125, the half_dir_step is added to 360 and therefore the bin includes wave directions which are greater than 360 and the directions from 0 to the start are not included.

I made a work around in my implementation by replacing wave directions from 0 to half_dir_step with 360+ wave direction (so the values are greater than 360 degrees).

SI calculation error

Hi all,
I think that here might be an error in the calculation of the scatter index. I have used another script and I got different results, so I decided to check and I think that the mean value is not being taken into account somewhere in the equation. I found that SI can also be interpreted as
image
with Xmean = Mean of observations
I reviewed a few comparer objects and the other script checks out but I don't get it in fmskill. I am computing SI with this formula
image
but the one in FMSkill is not taking into account 1/N

Erroneous track extraction of dfsu from MIKE if input observations are not sorted over time

My observations were altimeter track data that were not sorted over time (I had put together spatial "chunks" of data).
The track extractions on model data from ERA5 (.nc), CMEMS (.nc) and WW3 (.grib) worked fine but when extracting from MIKE (.dfsu) it gave wrong wave parameters e.g. negative values.
Sorting the altimeter track data over time fixed the issue.

Scatter plot with density cross-diagonal artifact

There seems to be an issue with the 2d density plot used in the scatter plot

image

from modelskill.plotting import scatter
import matplotlib.pyplot as plt
import numpy as np

np.random.seed(42)
X = np.random.multivariate_normal([0, 0], [[1, 0.98], [0.98, 1]], 20000)
x = X[:, 0]
y = X[:, 1]
fig, ax = plt.subplots(1, 2, figsize=(14, 6))
scatter(x,y,ax=ax[0])
scatter(x, y, show_density=False, show_hist=True, show_points=False, bins=100, ax=ax[1]);

These bands seems like an artifact.
image

identify items only through EUMType

Currently a parameter is identified via itemInfo, as either taken from .dfs0
https://github.com/DHI/fmskill/blob/aa1e47d7d0d4d8887faca763270a360d9c4d7da7/fmskill/observation.py#L121
or added by the user manually if observation is read from df.

Is itemInfo sufficient for all our needs? For example EUMType does not allow to distinguish different types of wave periods (Tp, T02), or does it?

I suggest additional flexibility by adding an attrs dict to observations and model results, similar to xarray's attrs http://xarray.pydata.org/en/stable/generated/xarray.DataArray.attrs.html

Also relevant: xarray's logic for plot labels http://xarray.pydata.org/en/stable/plotting.html#simple-example

Z argument lost

Hi, short problem.

With the previous version I was able to do (after the extraction or after cc=con.extract())
obs=cc.observation
and that would return the point observation. My point observation has x y and z, and I can still do that.
However now I cannot seem to be able to access the observation object from the extracted compare, and the issue is that the z value is now lost.
Can we somehow pass the z value to the extraction, or, can I retrieve again the the observation from the compare as it was with cc.observation ?

Math in documentation

Hi,
I was trying to see if the formula I wrote for the Peak Ratio looks good in the Math style, yet when I click in documentation I see this:

image

image

Custom metrics in scatter plot (skill table) error

Hi,

I used to be able to have custom metrics into the skill table before (long time ago, see example figure with custom metric EV)
image

Now I can still use the custom metric with the .skill() function, see eg. metrics ev and pr
image

But when trying to plot the scatter plot with the skill table, custom metrics are not allowed anymore, giving me an error

image

I think the error now prompts because only metrics defined inside metrics.py are allowed
https://github.com/DHI/modelskill/blob/ced02fd248b021de579b13765de8cee51c30cdfb/modelskill/metrics.py#L601C1-L607C2
and before this was not a requirement.

Adding comparers changes original

If I have two comparers c1 and c2 and try to add them using add_comparer():

> c3 = c1.add_comparer(c2)

The first comparer c1 is changed. The second is not. You can therefore not do the same operation twice:

> c3 = c1.add_comparer(c2)
> c4 = c1.add_comparer(c2)    # will fail! 

Recommend Projects

  • React photo React

    A declarative, efficient, and flexible JavaScript library for building user interfaces.

  • Vue.js photo Vue.js

    ๐Ÿ–– Vue.js is a progressive, incrementally-adoptable JavaScript framework for building UI on the web.

  • Typescript photo Typescript

    TypeScript is a superset of JavaScript that compiles to clean JavaScript output.

  • TensorFlow photo TensorFlow

    An Open Source Machine Learning Framework for Everyone

  • Django photo Django

    The Web framework for perfectionists with deadlines.

  • D3 photo D3

    Bring data to life with SVG, Canvas and HTML. ๐Ÿ“Š๐Ÿ“ˆ๐ŸŽ‰

Recommend Topics

  • javascript

    JavaScript (JS) is a lightweight interpreted programming language with first-class functions.

  • web

    Some thing interesting about web. New door for the world.

  • server

    A server is a program made to process requests and deliver data to clients.

  • Machine learning

    Machine learning is a way of modeling and interpreting data that allows a piece of software to respond intelligently.

  • Game

    Some thing interesting about game, make everyone happy.

Recommend Org

  • Facebook photo Facebook

    We are working to build community through open source technology. NB: members must have two-factor auth.

  • Microsoft photo Microsoft

    Open source projects and samples from Microsoft.

  • Google photo Google

    Google โค๏ธ Open Source for everyone.

  • D3 photo D3

    Data-Driven Documents codes.