Giter VIP home page Giter VIP logo

doitintl / bigquery-grafana Goto Github PK

View Code? Open in Web Editor NEW
240.0 19.0 74.0 286.73 MB

Google BigQuery Datasource Plugin for Grafana. (NO LONGER MAINTAINED)

Home Page: https://www.doit-intl.com/labs/

License: MIT License

TypeScript 78.43% HTML 10.02% JavaScript 3.41% Shell 0.11% Go 8.03%
bigquery grafana-datasource grafana monitoring metrics google-cloud-platform google-bigquery grafana-bigquery grafana-bigquery-datasource bigquery-datasource typescript

bigquery-grafana's Introduction

We have retired the DoiT International BigQuery DataSource plugin for Grafana, ceased all development, and put maintenance on indefinite hold. We recommend you migrate to the official Google BigQuery data source maintained by Grafana.


GitHub stars GitHub forks Automated Release Notes by gren

BigQuery DataSource for Grafana

A production-ready BigQuery DataSource plugin that provides support for BigQuery as a backend database.

Quick Start

There are multiple ways to install bigquery-grafana. See INSTALL for more information.

Features:

  • Query setup
  • Raw SQL editor
  • Query builder
  • Macros support
  • Additional functions
  • Table view
  • Annotations
  • BQ queries in variables
  • Sharded tables (tablename_YYYYMMDD)
  • Partitioned Tables
  • Granular slot allocation (Running queries in a project with flat-rate pricing)

Plugin Demo:

plugin demo

Adding the DataSource to Grafana

  1. Open the side menu by clicking the Grafana icon in the top header.
  2. In the side menu under Dashboards you should find a link named Data Sources.
  3. Click the + Add data source button in the top header.
  4. Select BigQuery from the Type dropdown.
  5. Upload or paste in the Service Account Key file. See below for steps on how to create a Service Account Key file.

NOTE: If you're not seeing the Data Sources link in your side menu it means that your current user does not have the Admin role for the current organization.

Name Description
Name The datasource name. This is how you refer to the datasource in panels & queries.
Default Default datasource means that it will be pre-selected for new panels.
Service Account Key Service Account Key File for a GCP Project. Instructions below on how to create it.

Set query priority

You can now set query priority "INTERACTIVE" or "BATCH" per datasouce

Example of Provisioning a File

You can manage DataSource via provisioning system. See the example below of a configuration file.

apiVersion: 1

datasources:
- name: <Datasource Name>
  type: doitintl-bigquery-datasource
  access: proxy
  isDefault: true
  jsonData:
       authenticationType: jwt
       clientEmail: <Service Account Email>
       defaultProject: <Default Project Name>
       tokenUri: https://oauth2.googleapis.com/token
  secureJsonData:
       privateKey: |
          -----BEGIN PRIVATE KEY-----
           <Content of the Private Key>
          -----END PRIVATE KEY-----
  version: 2
  readOnly: false

Authentication

There are two ways to authenticate the BigQuery plugin - either by uploading a Google JWT file, or by automatically retrieving credentials from Google's metadata server. The latter is only available when running Grafana on a GCE virtual machine.

Using a Google Service Account Key File

To authenticate with the BigQuery API, you need to create a Google Cloud Platform (GCP) Service Account for the Project you want to show data for. A Grafana datasource integrates with one GCP Project. If you want to visualize data from multiple GCP Projects then you can give the service account permissions in each project or create one datasource per GCP Project.

Enable APIs

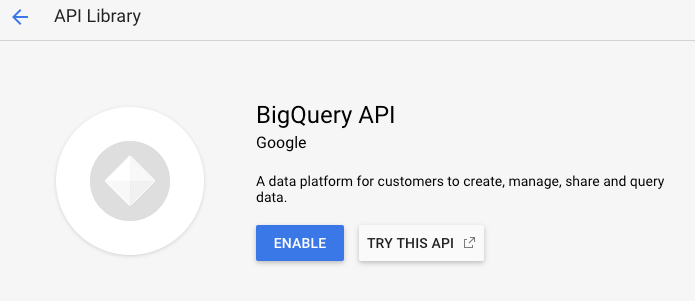
Go to BigQuery API and Enable the API:

Enable GCP APIs

Create a GCP Service Account for a Project

  1. Navigate to the APIs & Services Credentials page.

  2. Click on Create credentials and choose Service account key.

  3. On the Create service account key page, choose key type JSON. Then in the Service Account dropdown, choose the New service account option:

  4. Some new fields will appear. Fill in a name for the service account in the Service account name field and then choose the BigQuery Data Viewer and BigQuery Job User roles from the Role dropdown:

  5. Click the Create button. A JSON key file will be created and downloaded to your computer. Store this file in a secure place as it allows access to your BigQuery data.

  6. Upload it to Grafana on the datasource Configuration page. You can either upload the file or paste in the contents of the file.

  7. The file contents will be encrypted and saved in the Grafana database. Don't forget to save after uploading the file!

Using GCE Default Service Account

If Grafana is running on a Google Compute Engine (GCE) virtual machine, it is possible for Grafana to automatically retrieve default credentials from the metadata server. This has the advantage of not needing to generate a private key file for the service account and also not having to upload the file to Grafana. However for this to work, there are a few preconditions that need to be met.

  1. First of all, you need to create a Service Account that can be used by the GCE virtual machine. See detailed instructions on how to do that here.
  2. Make sure the GCE virtual machine instance is being run as the service account that you just created. See instructions here.
  3. Allow access to the BigQuery API scope. See instructions here.

Read more about creating and enabling service accounts for GCE VM instances here.

Using the Query Builder

The query builder provides a simple yet a user-friendly interface to help you quickly compose a query. The builder enables you to define the basic parts of your query, The common ones are:

  1. The table you want to query from

  2. The time field and metric field

  3. WHERE clause - Either use one of the pre-defined macros, to speed your writing time, or set up your own expression. Existing supported Macros are:

    a. Macro $__timeFiler with last 7 days example:

  WHERE `createDate` BETWEEN TIMESTAMP_MILLIS (1592147699012) AND TIMESTAMP_MILLIS (1592752499012) AND _PARTITIONTIME >= '2020-06-14 18:14:59' AND _PARTITIONTIME < '2020-06-21 18:14:59'

b. Macro $__timeFrom with last 7 days example:

  WHERE `createDate` > TIMESTAMP_MILLIS (1592223758609)  AND _PARTITIONTIME >= '2020-06-15 15:22:38' AND _PARTITIONTIME < '2020-06-22 15:22:38'

c. Macro $__timeTo with last 7 days example:

  WHERE `createDate` < TIMESTAMP_MILLIS (1592828659681)  AND _PARTITIONTIME >= '2020-06-15 15:24:19' AND _PARTITIONTIME < '2020-06-22 15:24:19'

You can now use timeFilter macro in raw sql mode

  1. GROUP BY option - You can use a pre-defined macro or use one of the fields from your query a. time ($__interval,none)
  2. ORDER BY option

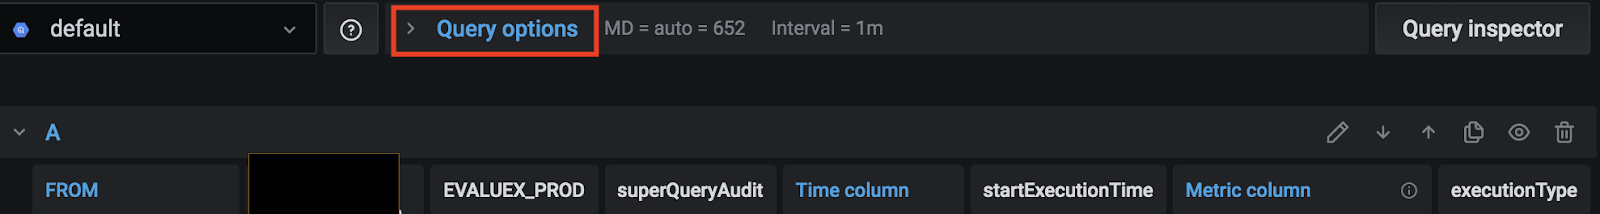
Note: If your processing location is not the Default US one set your location from the processing Location drop-down at the top right bottom of the query builder
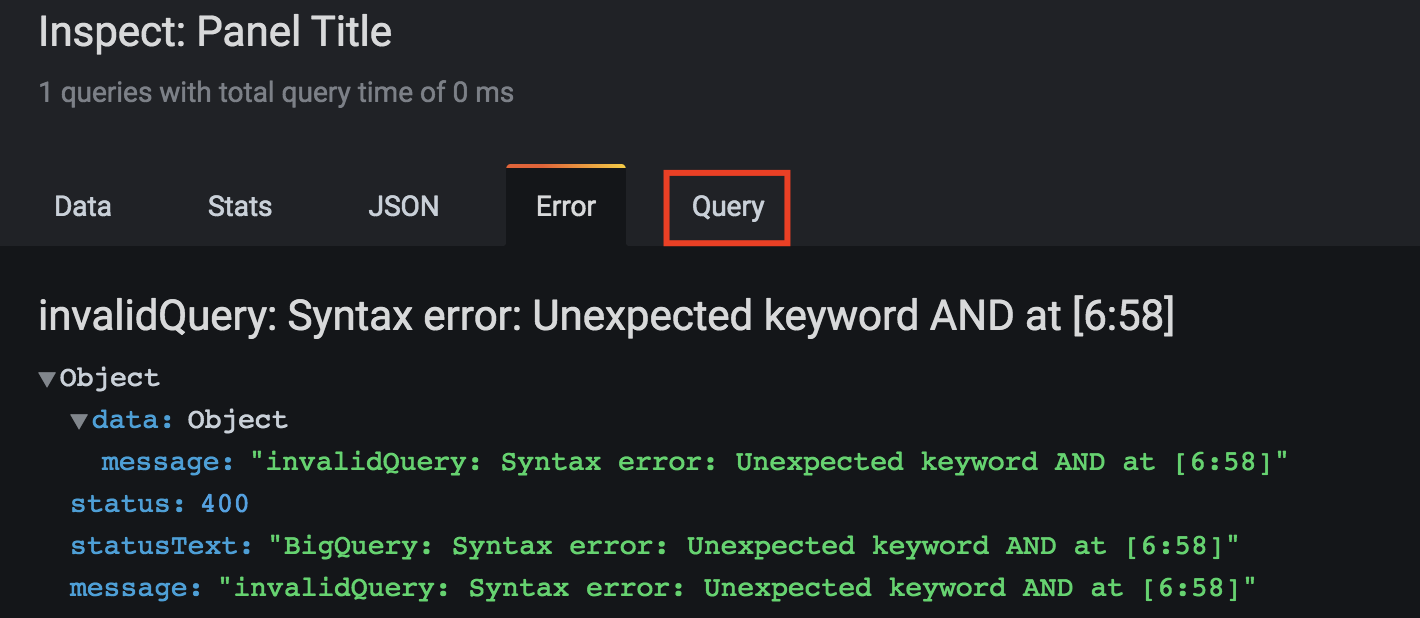
Troubleshooting

Viewing your Query

  1. Use The Query Inspector located at the top of the query builder
  2. The query Inspector enables you to see the clean query and troubleshoot SQL errors 
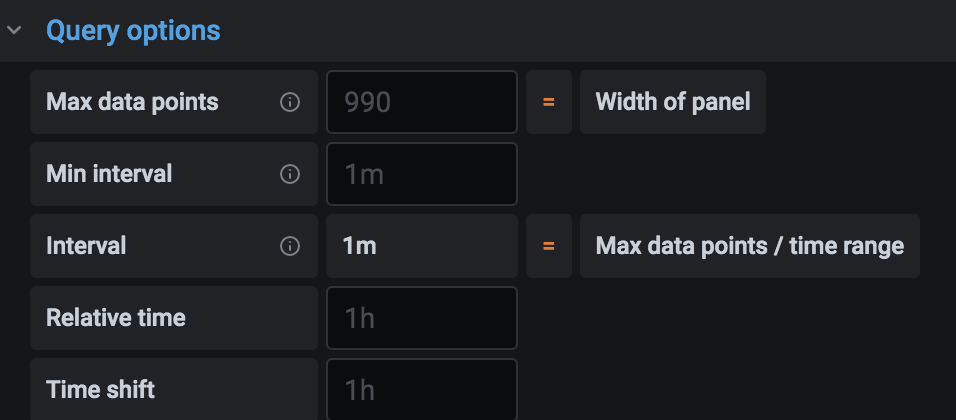
The Query builder comes with a set of defaults which are control from the top of the Query Builder

Build

The build works with Yarn:

Development Build

yarn run build:dev

Production Build

yarn run build:prod

Tests can be run with Jest:

yarn run test

Contributing

See the CONTRIBUTING file.

License

See the LICENSE file.

bigquery-grafana's People

Contributors

a2m1 avatar adv4000 avatar avivl avatar blackjid avatar derekperkins avatar dprokop avatar dror88 avatar eraac avatar erin-noe-payne avatar fank avatar johanbaath avatar jonasjacobsuserspace avatar jorritsalverda avatar liorracer avatar lukesaint avatar mihail-i4v avatar nomicode avatar ofir5300 avatar pdecat avatar pstump avatar ptomasroos avatar spark2ignite avatar sshota0809 avatar tanner-bruce avatar visualcortex-team avatar

Stargazers

 avatar  avatar  avatar  avatar  avatar  avatar  avatar  avatar  avatar  avatar  avatar  avatar  avatar  avatar  avatar  avatar  avatar  avatar  avatar  avatar  avatar  avatar  avatar  avatar  avatar  avatar  avatar  avatar  avatar  avatar  avatar  avatar  avatar  avatar  avatar  avatar  avatar  avatar  avatar  avatar  avatar  avatar  avatar  avatar  avatar  avatar  avatar  avatar  avatar  avatar  avatar  avatar  avatar  avatar  avatar  avatar  avatar  avatar  avatar  avatar  avatar  avatar  avatar  avatar  avatar  avatar  avatar  avatar  avatar  avatar  avatar  avatar  avatar  avatar  avatar  avatar  avatar  avatar  avatar  avatar  avatar  avatar  avatar  avatar  avatar  avatar  avatar  avatar  avatar  avatar  avatar  avatar  avatar  avatar  avatar  avatar  avatar  avatar  avatar  avatar

Watchers

 avatar  avatar  avatar  avatar  avatar  avatar  avatar  avatar  avatar  avatar  avatar  avatar  avatar  avatar  avatar  avatar  avatar  avatar  avatar

bigquery-grafana's Issues

Executor Not Found for Annotation Query

Bug Report

After installing the plugin and configuring it to be able to use the Big Query API I set up an annotation query and got an error. I can successfully query Big Query in a panel, only the annotation query fails (same query). From the logs:

t=2019-06-27T18:28:33+0000 lvl=eror msg="Metric request error" logger=context userId=1 orgId=1 uname=admin error="Could not find executor for data source type: doitintl-bigquery-datasource"
t=2019-06-27T18:28:33+0000 lvl=eror msg="Request Completed" logger=context userId=1 orgId=1 uname=admin method=POST path=/api/tsdb/query status=500 remote_addr=172.17.0.1 time_ms=14 size=34 referer="http://localhost:3000/d/c4QzQT4Zz/new-dashboard-copy?orgId=1"

Expected Behavior

The annotations should appear on the graphs.

Actual Behavior

Received the above error.

Steps to Reproduce the Problem

  1. Install plugin according to documentation
  2. Add random walk Grafana graph
  3. Add annotation query using Big Query as the datasource:
#standardSQL
SELECT
 TIMESTAMP_SECONDS(header.timestamp) AS time,
 pd_incident_id as text
FROM `my_project.my_dataset.my_table`
where
 pd_event_type="EVENT_TYPE_TRIGGER"

Specifications

  • Version: 1.0.0
  • Platform: Docker/Ubuntu
  • Grafana Version: Docker image grafana/grafana:6.2.5

Grafana Dashboard Variable not updating the graph using BigQuery Raw SQL Editor

Bug Report

The Bigquery Graph is not refreshing according to the Grafana Dashboard variable when the value for the variable is changed.

Expected Behavior

The Bigquery Graph should refresh.

Actual Behavior

(Same for "Bug Report", and please refer to the "Steps to Reproduce the Problem" for detailed description)

Steps to Reproduce the Problem

(Assumption: the Bigquery Datasource has already configured service account with Google BigQuery)

  1. Open up a Dashboard
  2. Define a Grafana Dashboard variable named "test_var" in Dashboard Setting - Variables:
    1. Name: test_var
    2. Type: Text box
    3. Label: (leave it blank)
    4. Hide: (leave it unselected)
    5. Default value: (leave it blank)
  3. Add panel
  4. Add Query:
    1. Queries to: Google Bigquery
    2. Format as: Table
    3. Click "Query Builder"
    4. Raw SQL:
      SELECT <column_name> FROM <project_id>.<data_set_id>.<table_id> where <column_name> = '$test_var'
  5. Click your mouse to anywhere outside Raw SQL editor but within Grafana page
  6. You will see that the variable "test_var" is immdiately overwrited by the actual value (empty as we did not add any Default value when define Dashboard variable), and the "$test_var" is gone and cannot be referenced again.

Specifications

  • Version: 0.3.0
  • Platform: Fedora 7.6
  • Grafana Version: 6.1.3

Nested fields aren't working properly

Bug Report

Expected Behavior

Returning data for nested fields

Actual Behavior

Returning non defined objects - [object Object]

Steps to Reproduce the Problem

  1. Create bigquery data source
  2. Create new table visualisation
  3. Create a query of SELECT * FROM (no time series)

    Specifications

    • Version: 1.0
    • Platform: container over k8s
    • Grafana Version: 5.4.2

_TABLE_SUFFIX BETWEEN generated incorrectly

Bug Report

When using sharded tables and generating the query on 25 March 2019, the generated query contains the following WHERE clause:

  $__timeFilter(time)AND  _TABLE_SUFFIX BETWEEN '201921' AND '2019225' 

Expected Behavior

  $__timeFilter(time) AND  _TABLE_SUFFIX BETWEEN '20190301' AND '20190325' 

What to fix

  1. Add missing SPACE between $__timeFilter(time) & 'AND'
  2. Correctly detect current month (e.g. March is 03)
  3. Add trailing zeroes where required (e.g. 20190301 and NOT 201931)

Documentation: variables

Help

I'm really interested in this project but it's quite hard to use with some sharp edges. Basically, I have a table with a bunch of error types and messages in a table broken down by topic. What I'm trying to achieve is a time series graph showing the counts of the errors over time. Id also like a variable to filter on a single topic. I managed to get this so far:

#standardSQL
SELECT
 $__timeGroupAlias(__Metadata.IngestedTimestamp,1d),
  Topic AS metric,
  count(*) AS count
  
  
FROM `table`
WHERE
  $__timeFilter(__Metadata.IngestedTimestamp) AND _PARTITIONTIME >= '2019-06-01 00:00:00' AND _PARTITIONTIME < '2019-06-30 23:59:59'
  
GROUP BY 1,2
ORDER BY 1,2

which gives me this:
image

Good start.

I managed to setup a grafana variable from doing a distinct on my metric (topic) and its populated so that is nice but I can't figure out how to use it in my query.

Ive tried lots of variations on below using ${} [] etc and no luck

#standardSQL
SELECT
 $__timeGroupAlias(__Metadata.IngestedTimestamp,1d),
  Topic AS metric,
  count(*) AS count
  
FROM `just-data.production_je_poisonmessages.justsaying_all_2019`
WHERE
  $__timeFilter(__Metadata.IngestedTimestamp) AND _PARTITIONTIME >= '2019-06-01 00:00:00' AND _PARTITIONTIME < '2019-06-30 23:59:59'
  and Topic like '%${topic}%'
GROUP BY 1,2,
ORDER BY 1,2

thanks

Support BQ queries in variables

Feature Request

Is your feature request related to a problem? Please describe.

I'd like to be able to get all values for a column in my BQ table (at least within the selected time range) and use that variable in the where clause of my graphs. Supporting all values or multi-select is a bonus.

Describe the solution you'd like
A clear and concise description of what you want to happen. Add any considered drawbacks.

A variable based on Prometheus allows the following query for example:

label_values(timeline_serie_name,label_name)

Either having a special function like $__timeFilter to do a similar thing or be able to specify a full query would be nice.

Describe alternatives you've considered

If I use a query at this moment I get a Template variables could not be initialized: e.metricFindQuery is not a function error.

Feature Request: alerting queries

Feature Request

Is your feature request related to a problem? Please describe.
We would like to utilize grafana alerting with this backend. Currently when trying to add an alert grafana reports that the datasource does not support it

Describe the solution you'd like
To be able to add an alert in grafana. One drawback might be cost but we are planning on having a long duration between runs.

Describe alternatives you've considered
This is mainly for GCP billing alerts. Have had a difficult time finding alternatives that allow for more in depth analysis/alerting

Teachability, Documentation, Adoption, Migration Strategy
I hope this isnt too much of a niche feature! Also if you know an alternate way to trigger alerts om GCP billing id be very interested to hear :)

Cannot read property 'v' of undefined

The query seems to work

#standardSQL
SELECT
timestamp AS time,
price AS metric,
exchange AS exchange
FROM `...
WHERE
$__timeFilter(timestamp) AND
quote = "USD"
GROUP BY timestamp, exchange,2
ORDER BY 1,2

query inspector shows data:

Array[3]
0:Object
v:"1.56083785975E9"
1:Object
v:"131.63300"
2:Object
v:"bittrex"

But can't make it show the graph.
Any advice?
Thanks

$__timeGroupAlias not replaced if Time column is inside a nested column

Bug Report

assuming data like:

    {
        "name": "count",
        "type": "INT64"
    },
    {
        "name": "meta",
        "type": "RECORD",
        "fields": [
            {
                "name": "currentTimeStamp",
                "type": "TIMESTAMP"
            },
            {
                "name": "something_else",
                "type": "STRING"
            }
        ]
    }
]

and using a query like:

SELECT
 $__timeGroupAlias(meta.currentTimeStamp,1min),
  avg(count)
FROM `somewhere`
WHERE
  $__timeFilter(meta.currentTimeStamp)
GROUP BY 1
ORDER BY 1

Grafana only shows an error:
invalidQuery: Syntax error: Illegal input character "$" at ...

in the query $__timeGroupAlias is not replaced:

SELECT
 $__timeGroupAlias(meta.currentTimeStamp,1min),
  avg(count)
FROM `somewhere`
WHERE
  meta.currentTimeStamp BETWEEN TIMESTAMP_MILLIS (1556066372991) AND TIMESTAMP_MILLIS (1556087972991)
GROUP BY 1
ORDER BY 1

checking the regex for the $__timeGroupAlias, i think there is missing a dot
e.g. /\$__timeGroupAlias\(([\w_]+ ... -> /\$__timeGroupAlias\(([\w_.]+ ...

Adding the dot directly to the module.js fixed it in our installation. ( we didn't check for any negative side effects)

Expected Behavior

Replace the $__timeGroupAlias correctly if the Time column is inside a nested column

Actual Behavior

$__timeGroupAlias is not replaced and the query is invalid

Steps to Reproduce the Problem

  1. Choose a Time Column inside a nested column
  2. execute the query

Specifications

  • Version: 0.3.0
  • Platform: Any
  • Grafana Version: v6.0.0

Not all series are displayed

Bug Report

vendor_id has three distinct values (CMT, VTS and DDS). The chart displays only two of them

Screen Shot 2019-03-30 at 21 23 30

Expected Behavior

All series should be displayed

Actual Behavior

One series doesn't get displayed

Steps to Reproduce the Problem

Query

#standardSQL
SELECT
 $__timeGroupAlias(pickup_datetime,1d),
  vendor_id AS metric,
  avg(passenger_count) AS passenger_count
FROM `nyc-tlc.yellow.trips`
WHERE
  $__timeFilter(pickup_datetime)
GROUP BY 1,2
ORDER BY 1,2

Project id is not set on datasource on startup

Bug Report

I have a grafana instance deployed in k8s with kube-prometheus. When loading a dashboard, bigquery queries are initially broken, until interacting with the query builder by editing a panel. The initial error shown is:

Invalid: Invalid project ID ''. Project IDs must contain 6-63 lowercase letters, digits, or dashes. Some project IDs also include domain name separated by a colon. IDs must start with a letter and may not end with a dash.

I've worked around this by setting defaultProject in jsonData for my datasource configuration (setting defaultProject is actually preferred for me, because it makes it easier to write dashboards reusable across my dev/prod projects), so this is not blocking me.

Not sure if this will be helpful or not, but I dug around in the code a bit to try to diagnose the problem - When no default project is set, It looks like project name starts as an empty string when the datasource is initialized:

this.projectName = instanceSettings.jsonData.defaultProject || "";

Then, it is only set when either testing the datasource or changing the project in the query builder, neither of which happen automatically when loading a dashboard. If no default project is set in the json, could getDefaultProject be called at startup to prevent the error from being shown?

Specifications

  • Version: 0.4.0
  • Platform: Linux
  • Grafana Version: 6.0.2

Timestamps can't be formated properly

Bug Report

Expected Behavior

Timestamps fields won't translate to readable value (even after playing around with the Column styles

Actual Behavior

When the column type is date, the result will be Invalid date
When the column type is number it will show a number (1.54224E9)
When the column type is string it will show a number (1.54224E9)

Steps to Reproduce the Problem

  1. Create bigquery data source
  2. Create new table visualisation
  3. Create a query of SELECT * FROM (no time series)

    Specifications

    • Version: 1.0
    • Platform: container over k8s
    • Grafana Version: 5.4.2

Default query in raw mode has non-existent $__time macro

Bug Report

Expected Behavior

When I switch to raw mode, I expect that the default query will guide me to write a correct query.

Actual Behavior

The default query looks like this:

SELECT
  $__time(time_column),
  value1
FROM
  metric_table
WHERE
  $__timeFilter(time_column)

There is no $__time macro.

Steps to Reproduce the Problem

  1. Create a new query.

  2. Switch to raw mode:

    image

Specifications

  • Version: 0.6.1
  • Platform: Ubuntu 16.04 and Chrome
  • Grafana Version: latest master

Allow date field as time column

Bug Report

I have a dataset where the only time column is a Date field in big query. I would like a time series chart from this. My query looks like this:

#standardSQL
SELECT
 $__timeGroupAlias(date,1d),
  topic AS metric,
  sum(sucessfully_written) AS sucessfully_written
FROM `table`
WHERE
  $__timeFilter(date)
GROUP BY 1,2
ORDER BY 1,2

image

Expected Behavior

time series chart with x axis being days

Actual Behavior

invalidQuery: No matching signature for function UNIX_SECONDS for argument types: DATE. Supported signature: UNIX_SECONDS(TIMESTAMP) at [3:24]

Steps to Reproduce the Problem

  1. see my query above, try to set a date column as the time column in grafana

Specifications

  • Version: 0.6.1
  • Platform: linux
  • Grafana Version: 6.1.4

$__timeGroupAlias and $__timeFilter change the field name

Bug Report

$__timeGroupAlias and $__timeFilter change the start_time column I provide into usage_start_time which is present in a joined table, leading to error.

Is it possible to either keep the column name as is or allow a table alias to be added? Like $__timeGroupAlias(table_a.start_time)?

Expected Behavior

$__timeGroupAlias(start_time,1d)

to turn into

TIMESTAMP_SECONDS(DIV(UNIX_SECONDS(start_time), 86400) * 86400),

Actual Behavior

$__timeGroupAlias(start_time,1d)

turns into

TIMESTAMP_SECONDS(DIV(UNIX_SECONDS(usage_start_time), 86400) * 86400),

Specifications

  • Version: 0.3.0
  • Platform: grafana/grafana docker image
  • Grafana Version: 6.1.3

Full queries

I'm putting this query into grafana in order to graph GKE usage metering data.

#standardSQL
SELECT
  $__timeGroupAlias(start_time,1d),
  coalesce((SELECT value FROM UNNEST(labels) WHERE key='app'), 'unknown') AS metric,
  sum(resource_usage.usage.amount * gcp_billing_export.rate) AS cost
FROM
  `***.gke_usage_metering.gke_cluster_resource_usage` AS resource_usage
LEFT JOIN (
  SELECT
    sku.id AS sku_id,
    project.id AS project_id,
    SAFE_DIVIDE(SUM(cost), SUM(usage.amount)) AS rate,
    MIN(usage_start_time) AS min_usage_start_time,
    MAX(usage_end_time) AS max_usage_end_time
  FROM
    `***.gce_billing.gcp_billing_export_v1_***`
  WHERE
    $__timeFilter(usage_start_time)
  GROUP BY
    project_id,sku_id) AS gcp_billing_export
ON
  resource_usage.sku_id = gcp_billing_export.sku_id AND
  resource_usage.project.id = gcp_billing_export.project_id
WHERE
  $__timeFilter(start_time) AND
  resource_usage.start_time >= gcp_billing_export.min_usage_start_time AND
  resource_usage.end_time <= gcp_billing_export.max_usage_end_time
GROUP BY 1,2
ORDER BY 1,2

Grafana sends the following actual query to BigQuery:

#standardSQL
SELECT
  TIMESTAMP_SECONDS(DIV(UNIX_SECONDS(usage_start_time), 86400) * 86400),
  coalesce((SELECT value FROM UNNEST(labels) WHERE key='app'), 'unknown') AS metric,
  sum(resource_usage.usage.amount * gcp_billing_export.rate) AS cost
FROM
  `***.gke_usage_metering.gke_cluster_resource_usage` AS resource_usage
LEFT JOIN (
  SELECT
    sku.id AS sku_id,
    project.id AS project_id,
    SAFE_DIVIDE(SUM(cost), SUM(usage.amount)) AS rate,
    MIN(usage_start_time) AS min_usage_start_time,
    MAX(usage_end_time) AS max_usage_end_time
  FROM
    `***.gce_billing.gcp_billing_export_v1_***`
  WHERE
    usage_start_time BETWEEN TIMESTAMP_MILLIS (1523536617738) AND TIMESTAMP_MILLIS (1555072617738)
  GROUP BY
    project_id,sku_id) AS gcp_billing_export
ON
  resource_usage.sku_id = gcp_billing_export.sku_id AND
  resource_usage.project.id = gcp_billing_export.project_id
WHERE
  usage_start_time BETWEEN TIMESTAMP_MILLIS (1523536617738) AND TIMESTAMP_MILLIS (1555072617738) AND
  resource_usage.start_time >= gcp_billing_export.min_usage_start_time AND
  resource_usage.end_time <= gcp_billing_export.max_usage_end_time
GROUP BY 1,2
ORDER BY 1,2

Which returns the following error

"BigQuery: Unrecognized name: usage_start_time; Did you mean min_usage_start_time? at [25:3]"

Time column cannot be keyword

Bug Report

Because of reasons, we have a timestamp column named at. Seems to break both the query builder and, if using SQL mode, the macros such as $__timeFilter.

Expected Behavior

The time column (possibly all columns, everywher?) should be escaped when present in the query or in macros. For example, $__timeFilter(at) should expand to

`at` BETWEEN ...

rather than at BETWEEN. I think the change would be here?

const range = this.target.timeColumn + " BETWEEN " + from + " AND " + to;

Actual Behavior

invalidQuery: Syntax error: Unexpected keyword AT at [3:2]

Steps to Reproduce the Problem

  1. Create table with reserved keyword column name
  2. Try to query it

Specifications

  • Version: 0.6.1
  • Platform: Linux
  • Grafana Version: 6.0.1

Limit for Maximum Concurrent Queries

Feature Request

Is your feature request related to a problem? Please describe.

We have switched from BigQuery to Bigtable in our project and we use BigQuery to access Bigtable. After adding multiple BigQuery queries, following error occurs.

jobRateLimitExceeded: Job exceeded rate limits: Your project exceeded quota for concurrent queries that read Cloud Bigtable data sources. For more information, see https://cloud.google.com/bigquery/troubleshooting-errors

Describe the solution you'd like

Ability to set limit for maximum concurrent queries for the data source.

Describe alternatives you've considered

Add fewer queries (4) to one dashboard (limited amount of information per dashboard).

Teachability, Documentation, Adoption, Migration Strategy

If the default limit for maximum concurrent queries is set to infinite, there is no negative impact for current users.

$__timeFilter macro generates incorrect sql

Bug Report

Expected Behavior

The following raw query with a $timeFilter macro should return valid sql:

SELECT
 timeGenerated as time,
 metricName,
 gaugeValue
FROM
 myproject.mydb.test
WHERE
 $__timeFilter(timeGenerated)
ORDER BY 1,2

Actual Behavior

The sql produced has an incorrect where clause:

SELECT
  timeGenerated as time,
  metricName,
  gaugeValue
FROM
  myproject.mydb.test
WHERE
  -- time -- BETWEEN TIMESTAMP_MILLIS (1560962988788) AND TIMESTAMP_MILLIS (1560984588789)
ORDER BY 1,2 LIMIT 403

It looks like the default value for target.timeColumn is being used as target.timeColumn is not set when using the raw mode. The replaceTimeFilters function tries to use the target.timeColumn field when doing the regex replace.

Steps to Reproduce the Problem

  1. Create table with following schema:
Field name Type Mode
timeGenerated TIMESTAMP REQUIRED
metricName STRING REQUIRED
gaugeValue FLOAT REQUIRED
  1. Insert test data:
INSERT mydb.test (timestamp, metric, value)
VALUES(CURRENT_TIMESTAMP(), 'metric1', 10),
(CURRENT_TIMESTAMP(), 'metric2', 20),
(CURRENT_TIMESTAMP(), 'metric3', 30)
  1. Create a graph panel with the BigQuery ds and switch to raw query mode.

  2. Execute raw query in the Expected Behavior section in the query editor

Specifications

  • Version: 0.6.1
  • Platform: Ubuntu 16.04
  • Grafana Version: latest master

Cannot read property 'search' of undefined for all tables

Bug Report

After update to the latest version all table visualisations got broken. I get the same error everywhere 'Cannot read property 'search' of undefined' for all tables, though query inspector returns correct resultset. For example a source query for one of the tables:

SELECT
project.id as Project,
sku.description as Resource_type,
t.key as Label,
t.value as Value,
sum(cost) as Cost
FROM my_dataset.my_table n
LEFT JOIN UNNEST(labels) t ON t.key is not null
WHERE $__timeFilter(usage_start_time)
AND service.description = "App Engine"
GROUP BY
Project,
sku.description,
t.key,
t.value

Expected Behavior

Chart displays a table with listed above columns.

Actual Behavior

Get error 'Cannot read property 'search' of undefined', nothing displayed on the chart.

image

Steps to Reproduce the Problem

  1. Press 'Add panel' -> choose visualization -> table
  2. Go to queries, insert query from the example above (with valid dataset and table)
  3. Set 'Format as table' setting

Specifications

  • Version: 0.5.1
  • Platform: GCE with ubuntu-os-cloud/ubuntu-1604-lts image
  • Grafana Version: 6.2.1

invalidQuery: Unrecognized name: _PARTITIONTIME

Bug Report

I have a partitioned table, for which the generated query uses pseudo column _PARTITIONTIME. However the pseudo column isn't available, probably because the table is partitioned on a specific field.

Property Value
Table type Partitioned
Partitioned by Day
Partitioned on field EdgeStartTimestamp
Partition filter Required

The query generated by the graph I'm trying to construct looks like this

#standardSQL
SELECT
 $__timeGroupAlias(EdgeStartTimestamp,1h),
  EdgeRequestHost AS metric,
  count(CacheResponseStatus) AS CacheResponseStatus
FROM `***.cloudflare_logs.cloudflare_logs`
WHERE
  $__timeFilter(EdgeStartTimestamp) AND _PARTITIONTIME >= '2019-04-03 14:56:03' AND _PARTITIONTIME < '2019-04-10 14:56:03'
GROUP BY 1,2
ORDER BY 1,2

Expected Behavior

The query to use the partition field EdgeStartTimestamp instead of pseudo column _PARTITIONTIME.

Actual Behavior

The query returns following error:

invalidQuery: Unrecognized name: _PARTITIONTIME at [8:104]

Specifications

Installed the plugin with GF_INSTALL_PLUGINS=https://github.com/doitintl/bigquery-grafana/archive/0.3.0.zip;doitintl-bigquery-datasource

  • Version: 0.3.0
  • Platform: Docker image grafana/grafana:6.1.3
  • Grafana Version: 6.1.3

Support multiple metric columns

Feature Request

Is your feature request related to a problem? Please describe.
I am trying to create a dashboard which displays error messages. The schema is roughly

errorType: String
topic: String
tenant: String
message: String

I want to create a table visualisation where the columns of the table correspond to the unique groupings of these dimension columns. The final column would be the count. The query ideally would look like this

#standardSQL
SELECT
 $__timeGroupAlias(__Metadata.IngestedTimestamp,1d),
 Topic,
 tenent,
errorType,
message, 
count(*) AS count,
  
FROM `just-data.production_je_poisonmessages.justsaying_all_2019`
WHERE
  $__timeFilter(__Metadata.IngestedTimestamp) AND _PARTITIONTIME >= '2019-06-01 00:00:00' AND _PARTITIONTIME < '2019-06-30 23:59:59'
GROUP BY 1,2,3.4,5
ORDER BY 1,2

Describe the solution you'd like
The ability to do a group by on any number of fields and for each field to be a column in the table view in grafana. I'm not familiar with grafana internals but I presume this is possible

Describe alternatives you've considered

The closest way to get this behaviour is to stuff all these data in a column and call it metric like this:

#standardSQL
SELECT
 $__timeGroupAlias(__Metadata.IngestedTimestamp,1d),
  CONCAT(Topic,'    ',Tenant,'     ',ErrorMessage) AS metric,
  count(*) AS count,
  ErrorMessage as error
  
FROM `just-data.production_je_poisonmessages.justsaying_all_2019`
WHERE
  $__timeFilter(__Metadata.IngestedTimestamp) AND _PARTITIONTIME >= '2019-06-01 00:00:00' AND _PARTITIONTIME < '2019-06-30 23:59:59'
GROUP BY 1,2,4
ORDER BY 1,2

Here is my grafana table setup and output for reference
image

Support time shift per query

Feature Request

Is your feature request related to a problem? Please describe.
I want to be able to compare data from the current range to the previous range. Let's say I'm looking at the last month and I want to compare with the previous month.

Unfortunately Grafana doesn't allow to set a timeshift per query, only for a full panel. See grafana/grafana#2093. They bounce you to the provider plugin for support.

Describe the solution you'd like

In the query builder to have a field for timeshift so I can set multiple queries with different time shift.

Describe alternatives you've considered

Handling this in the raw query; unfortunately the built in global variables like $__timeFilter don't seem to have any easy way to shift time, see https://grafana.com/docs/reference/templating/.

Teachability, Documentation, Adoption, Migration Strategy

In order to compare you graph to the previous period duplicate your query in a graph and shift it's time by 1h, 1d or 1w; apply some additional styling - like dashes - to your shifted query graph so it's easy to keep it apart from the current values.

Support multiple Metrics'

Feature Request

Is your feature request related to a problem? Please describe.
A clear and concise description of what the problem is. Ex. I have an issue when [...]

Describe the solution you'd like
A clear and concise description of what you want to happen. Add any considered drawbacks.

Describe alternatives you've considered
A clear and concise description of any alternative solutions or features you've considered.

Teachability, Documentation, Adoption, Migration Strategy
If you can, explain how users will be able to use this and possibly write out a version of the docs.
Maybe a screenshot or design?

Grouping time with $__interval fails

Bug Report

When I use $__timeGroupAlias(measured_at,$__interval), a query is executed but data points fall outside the time range.

When comparing the type of queries that are generated

$__timeGroupAlias(measured_at,1h)

translates into

TIMESTAMP_SECONDS(DIV(UNIX_SECONDS(measured_at), 3600) * 3600)

which works fine and returns a nice graph. However

$__timeGroupAlias(measured_at,$__interval)

turns into

TIMESTAMP(  (PARSE_DATE( "%Y-%m-%d",CONCAT( CAST((EXTRACT(YEAR FROM measured_at)) AS STRING),'-',CAST((EXTRACT(MONTH FROM measured_at)) AS STRING),'-','01'))))

I would imagine the second query to look the same as the first but with a different number of seconds.

Expected Behavior

$__timeGroupAlias(measured_at,$__interval) to group in such a way that the same query can be used to graph either the last 24 hours or the last 5 years.

Actual Behavior

Data points outside time range.

Specifications

  • Version: 0.6.1
  • Platform: docker image grafana/grafana
  • Grafana Version: 6.2.4

Support for sharded tables

Feature Request

Is your feature request related to a problem? Please describe.
Google BigQuery supports sharded tables which can be queried using wildcards [1]. Right now, the plugin shows all shards of the table as separate tables.

Describe the solution you'd like
The better approach would be to show the single instance (e.g. like shown in BigQuery UI) and then control the shards being queried using FROM clause (e.g. TABLE_DATE_RANGE() function)

References:
[1] https://cloud.google.com/bigquery/docs/querying-wildcard-tables

Plugin published on Grafana.com - feedback

I have just published the plugin on Grafana.com: https://grafana.com/plugins/doitintl-bigquery-datasource

Mostly it looks great, you took some of the best bits of the Stackdriver and MySQL/Postgres datasources. Great work!

I found some smaller items that could be improved:

  • I tested with a service account that did not have the correct roles but the Save and Test function still said it was ok.

  • Error handling. The Stackdriver and Sql datasource show errors in the query editor. At the moment, I would have to go to the Chrome console to see the error.

    image

  • Ran into problems with the macros when writing sql. The $__time macro and the $__timeGroup macros did not get interpolated sometimes (the timeFilter macro always gets interpolated):

    SELECT
      $__timeGroup(timestamp, '1m'),
      metric AS metric,
      value AS value
    FROM
      `my-production.GrafanaTest.GrafanaTestTable`
    WHERE
      $__timeFilter(timestamp)
    GROUP BY timestamp
    ORDER BY timestamp

    This is with a simple table with following schema:
    image

If you want to update the version on Grafana.com then please send a PR to the Grafana plugin repo and add a new version to the version array here:

https://github.com/grafana/grafana-plugin-repository/blob/master/repo.json#L3047-L3058

Like this:

{
      "id": "doitintl-bigquery-datasource",
      "type": "datasource",
      "url": "https://github.com/doitintl/bigquery-grafana",
      "versions": [
       {
          "version": "<new version x.x.x>",
          "commit": "<new commit sha>",
          "url": "https://github.com/doitintl/bigquery-grafana "
        },
        {
          "version": "0.5.1",
          "commit": "8a74d87e36ef6dfec58a813850419a368a9361d3",
          "url": "https://github.com/doitintl/bigquery-grafana "
        }
      ]
    }

In conclusion, thanks so much for building this! The Grafana community has been asking for this for ages: grafana/grafana#7872

Looking forward to seeing how this develops going forward.

Use another variable inside a variable query

Feature Request

Is your feature request related to a problem? Please describe.

In a variable query I want to make use of one of the other variables.

Describe the solution you'd like

I have this variable with a query to select the most expensive projects in our

SELECT project.id, sum(cost) from billing group by 1 order by 2 desc limit 10

I would like to be able to set the limit from another custom variable, so I can switch between 10,25,50 etc. The query would then look like:

SELECT project.id, sum(cost) from billing group by 1 order by 2 desc limit $top

Unfortunately this results in the following error getting shown:

Templating
Template variables could not be initialized: invalidQuery: Syntax error: Illegal input character "$" at [1:248]

Query tables doesn't return data, instead it returns [object Object] values

Bug Report

Expected Behavior

Returning data

Actual Behavior

Returning non defined objects - [object Object], [object Object], [object Object]

Steps to Reproduce the Problem

  1. Create bigquery data source
  2. Create new table visualisation
  3. Create a query of SELECT * (no time series)

Specifications

  • Version: 1.0
  • Platform: container over k8s
  • Grafana Version: 5.4.2

Support Table Partitions

Feature Request

Detect if table has partitions and if it does, use partitions to filter by date

Is your feature request related to a problem? Please describe.
To minimize query cost, use partition filters to reduce the amount of scanned data

Describe the solution you'd like
Detect if table has partitions and if it does, use partitions to filter by date

Set minimum interval

Feature Request

Is your feature request related to a problem? Please describe.

To be able to see a wide selection of time ranges, from 1 hour to 1 year I use the following grouping in my queries:

$__timeGroupAlias(measured_at,$__interval)

I like to prevent $__interval to go below a certain configurable threshold. It would be nice to have a text box just like max data points, relative time and time shift that accepts values like 15min, 1d or 7d which ensures that $__interval never goes below that value.

Describe the solution you'd like

The _getInterval function would check if there's a minInterval configured and if so turns that into seconds as well and takes the larger of the 2.

Describe alternatives you've considered

An alternative would be a resolution select field like the Prometheus data source uses, however that always reduces the resolution, regardless of the time range. Also very useful for another reason of course.

Support LIKE clause in WHERE filters

Feature Request

Is your feature request related to a problem? Please describe.
BigQuery provides very fast LIKE performance and it would be great to have LIKE clause in the WHERE in addition to equality or inequality options

Adding installation instructions for helm/k8s users

Feature Request

The problem
People who choose kubernetes as the hosting platform of grafana and are using helm needs to define how the plugin will be installed, and as it's not part of the authorised plugins (yet) some adjustments needs to be done.
We/You should add that to the documentation part of the README so people would know :)

**How to **
Well thats the easy part in the official grafana helm chart, you can find the values file which specifies the plugins to be installed, instead of writting doit-bigquery-datasource, you'll need to specify the repo zip file:

https://github.com/doitintl/bigquery-grafana/archive/master.zip;doit-bigquery-datasource

Note
This is relevant only until the grafana team will recognise the datasource officially, than specifying the name would be more than enough

Not all fields are showing in the 'Metric Column' list

Bug Report

Looks like fields under RECORD are now showing in the list of available metrics

Expected Behavior

All fields, including fields nested under RECORD should be available for selection

Actual Behavior

Steps to Reproduce the Problem

Specifications

  • Version:
  • Platform:
  • Grafana Version:

Dashboard with all raw queries fails when imported

Bug Report

I've created a grafana dashboard, exported the JSON for it, then re-imported it*. The dashboard works fine before exporting, but is broken after re-importing. The dashboard has a few single-stat panels, all using raw, handwritten queries. Each panel shows this error:

Invalid: Invalid project ID ''. Project IDs must contain 6-63 lowercase letters, digits, or dashes. Some project IDs also include domain name separated by a colon. IDs must start with a letter and may not end with a dash.

This appears to be related to using only raw queries - after re-importing, if I add a new panel with a BQ query built with the query builder, the rest of the dashboard starts working.

  • In reality, the JSON is saved to a file, then deployed as a configmap with kube-prometheus, but I'm guessing this can be reproduced by simply exporting/re-importing the JSON

Expected Behavior

Dashboard should load correctly.

Actual Behavior

Dashboard shows the error above.

Steps to Reproduce the Problem

  1. Create a dashboard with only raw queries.
  2. Copy the JSON for the dashboard (dashboard settings -> JSON model in Grafana 6.0.2)
  3. Create a new dashboard, and paste the JSON back in - the error should appear.
  4. Add one more panel, and add a non-raw BQ query (i.e. use the query builder). The rest of the dashboard will work again.

Specifications

  • Version: 0.4.0
  • Platform: Linux
  • Grafana Version: 6.0.2

Plugin version in 0.5.0 zip is still 0.4.0

Bug Report

The version number hasn't been updated in plugin.json, hence the Grafana ui still shows the old version.

Expected Behavior

The Grafana /plugins/doitintl-bigquery-datasource/ page to show version 0.5.0 when running with GF_INSTALL_PLUGINS= https://github.com/doitintl/bigquery-grafana/archive/0.5.0.zip;doitintl-bigquery-datasource

Actual Behavior

Show version 0.4.0 instead

Support multiple Metrics'

Feature Request

Is your feature request related to a problem? Please describe.
A clear and concise description of what the problem is. Ex. I have an issue when [...]

Describe the solution you'd like
A clear and concise description of what you want to happen. Add any considered drawbacks.

Describe alternatives you've considered
A clear and concise description of any alternative solutions or features you've considered.

Teachability, Documentation, Adoption, Migration Strategy
If you can, explain how users will be able to use this and possibly write out a version of the docs.
Maybe a screenshot or design?

Recommend Projects

  • React photo React

    A declarative, efficient, and flexible JavaScript library for building user interfaces.

  • Vue.js photo Vue.js

    ๐Ÿ–– Vue.js is a progressive, incrementally-adoptable JavaScript framework for building UI on the web.

  • Typescript photo Typescript

    TypeScript is a superset of JavaScript that compiles to clean JavaScript output.

  • TensorFlow photo TensorFlow

    An Open Source Machine Learning Framework for Everyone

  • Django photo Django

    The Web framework for perfectionists with deadlines.

  • D3 photo D3

    Bring data to life with SVG, Canvas and HTML. ๐Ÿ“Š๐Ÿ“ˆ๐ŸŽ‰

Recommend Topics

  • javascript

    JavaScript (JS) is a lightweight interpreted programming language with first-class functions.

  • web

    Some thing interesting about web. New door for the world.

  • server

    A server is a program made to process requests and deliver data to clients.

  • Machine learning

    Machine learning is a way of modeling and interpreting data that allows a piece of software to respond intelligently.

  • Game

    Some thing interesting about game, make everyone happy.

Recommend Org

  • Facebook photo Facebook

    We are working to build community through open source technology. NB: members must have two-factor auth.

  • Microsoft photo Microsoft

    Open source projects and samples from Microsoft.

  • Google photo Google

    Google โค๏ธ Open Source for everyone.

  • D3 photo D3

    Data-Driven Documents codes.