![]()
This repository contains a modern set of Grafana dashboards for Kubernetes.
They are inspired by many other dashboards from kubernetes-mixin and grafana.com.
More information about them in my article: A set of modern Grafana dashboards for Kubernetes
You can also download them on Grafana.com.
This repository follows semantic versioning for releases.
It relies on conventional commits to automate releases using semantic-release.
These dashboards are made and tested for the kube-prometheus-stack chart, but they should work well with others as soon as you have kube-state-metrics and prometheus-node-exporter installed on your Kubernetes cluster.
They are not backward compatible with older Grafana versions because they try to take advantage of Grafana's newest features like:
gradient modeintroduced in Grafana 8.1 (Grafana Blog post)time seriesvisualization panel introduced in Grafana 7.4 (Grafana Blog post)$__rate_intervalvariable introduced in Grafana 7.2 (Grafana Blog post)
They also have a Prometheus Datasource variable so they will work on a federated Grafana instance.
As an example, here's how the Kubernetes / Views / Global dashboard looks like:

| File name | Description | Screenshot |
|---|---|---|
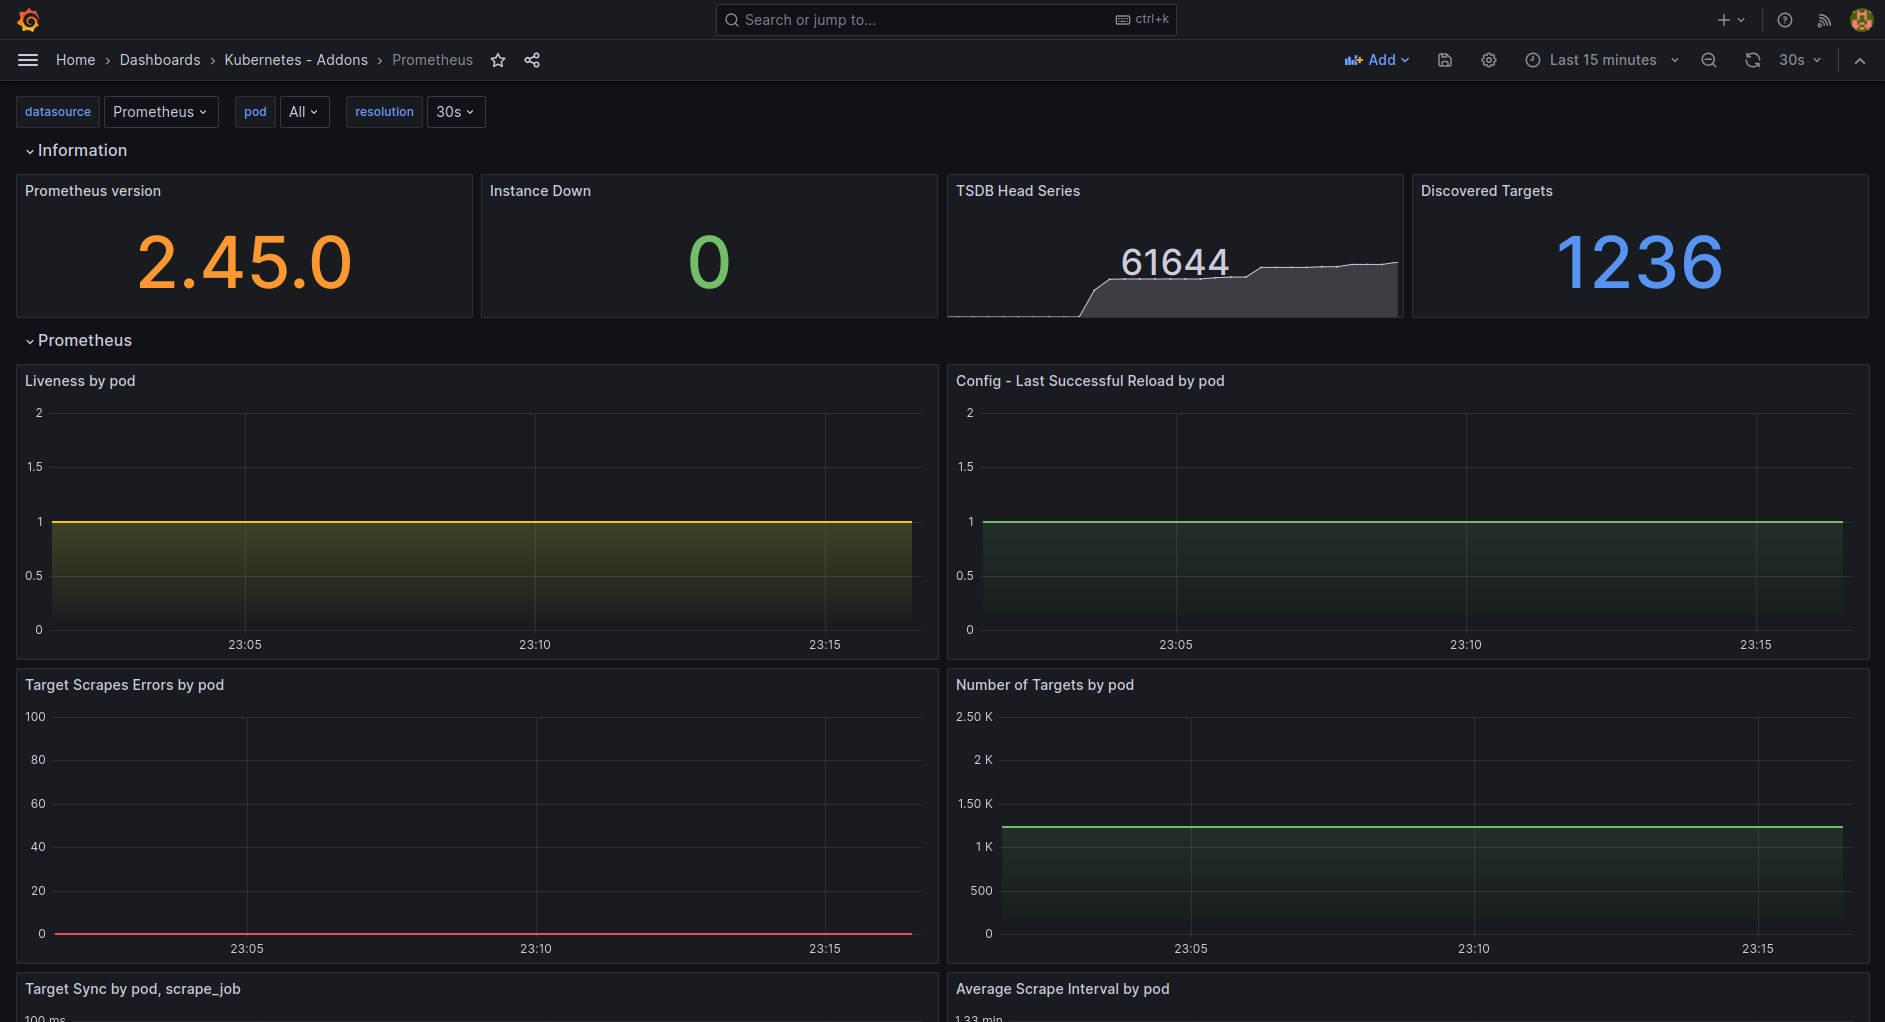
| k8s-addons-prometheus.json | Dashboard for Prometheus. | LINK |
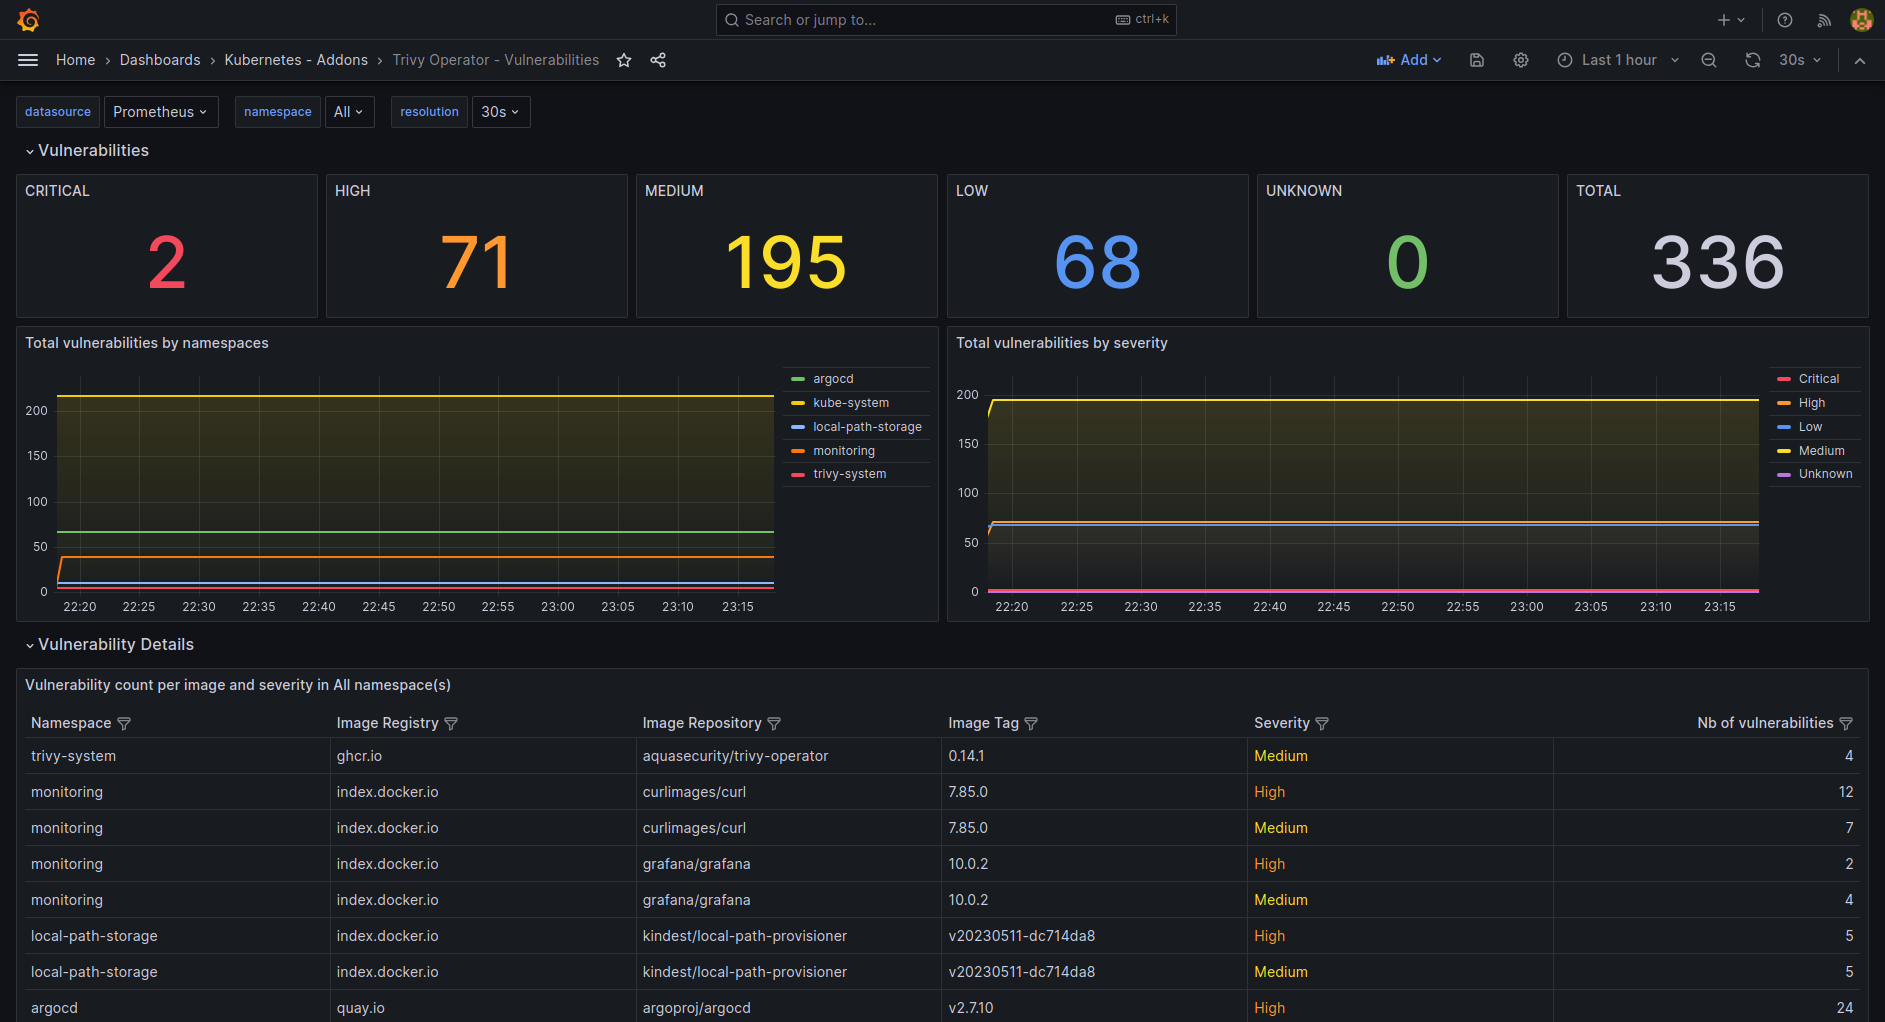
| k8s-addons-trivy-operator.json | Dashboard for the Trivy Operator from Aqua Security. | LINK |
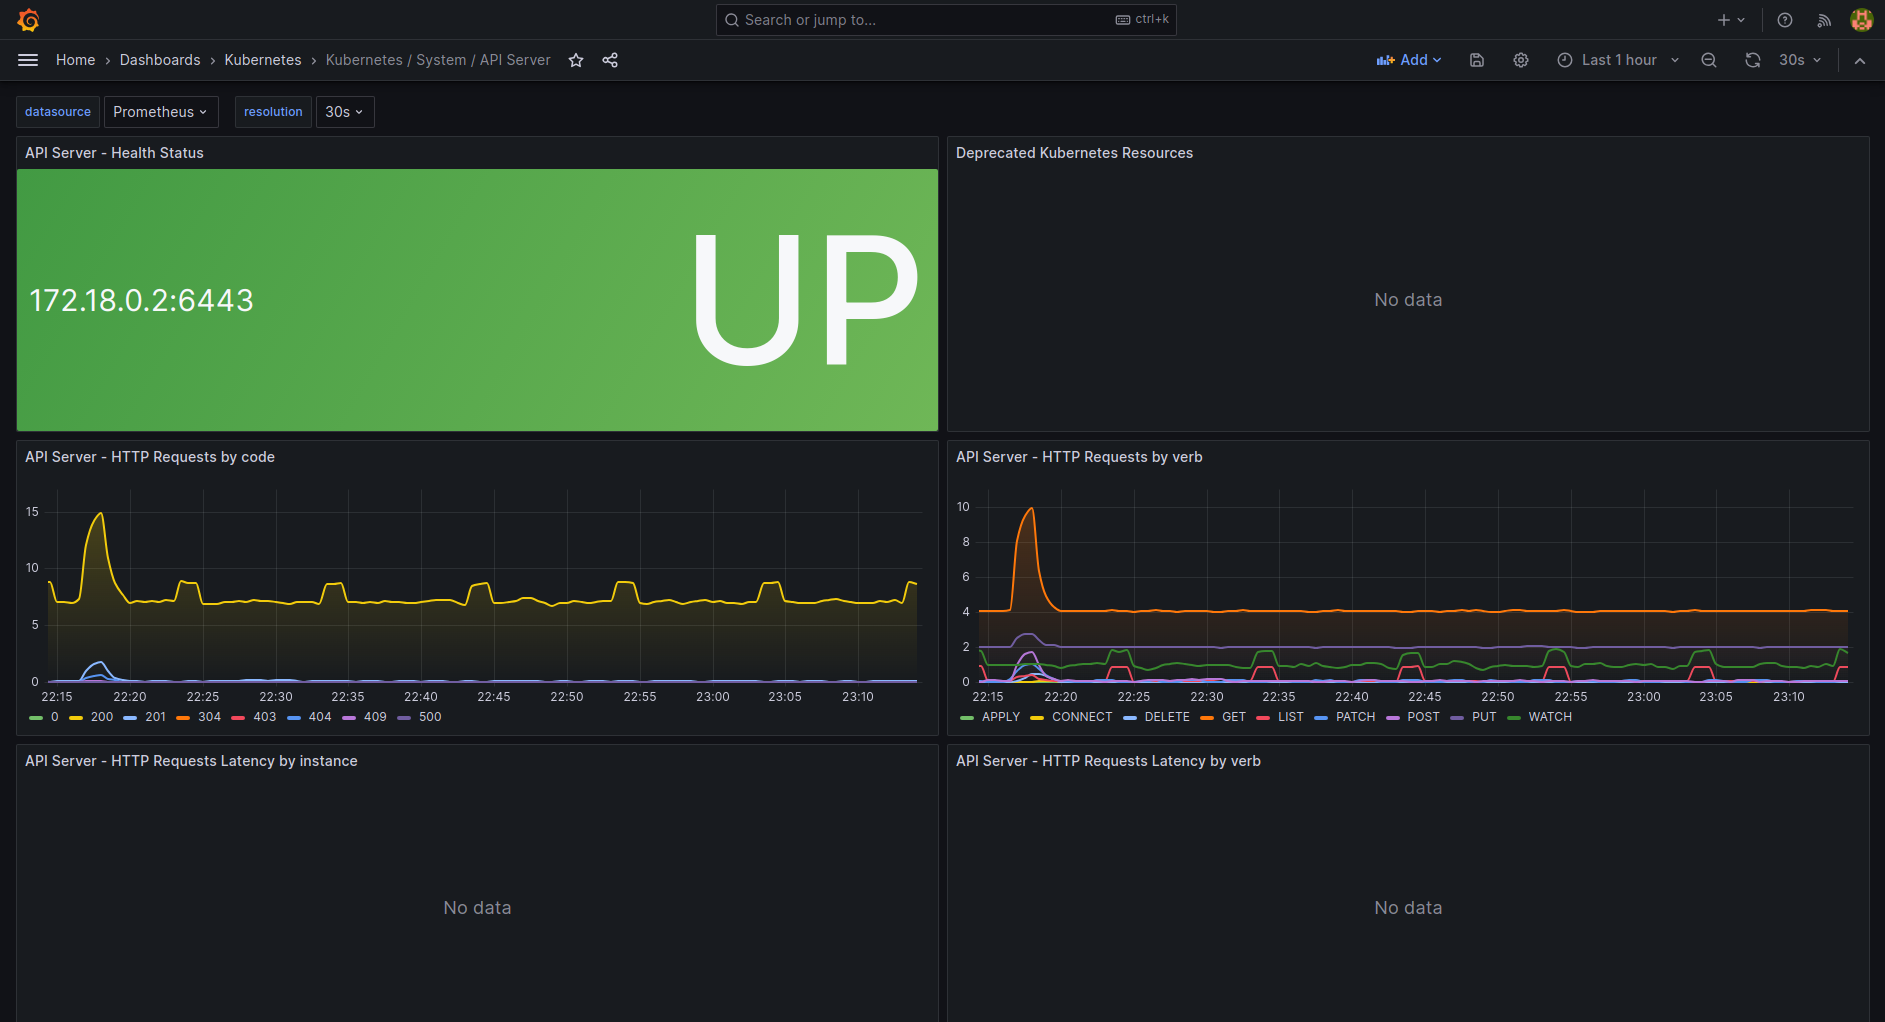
| k8s-system-api-server.json | Dashboard for the API Server Kubernetes component. | LINK |
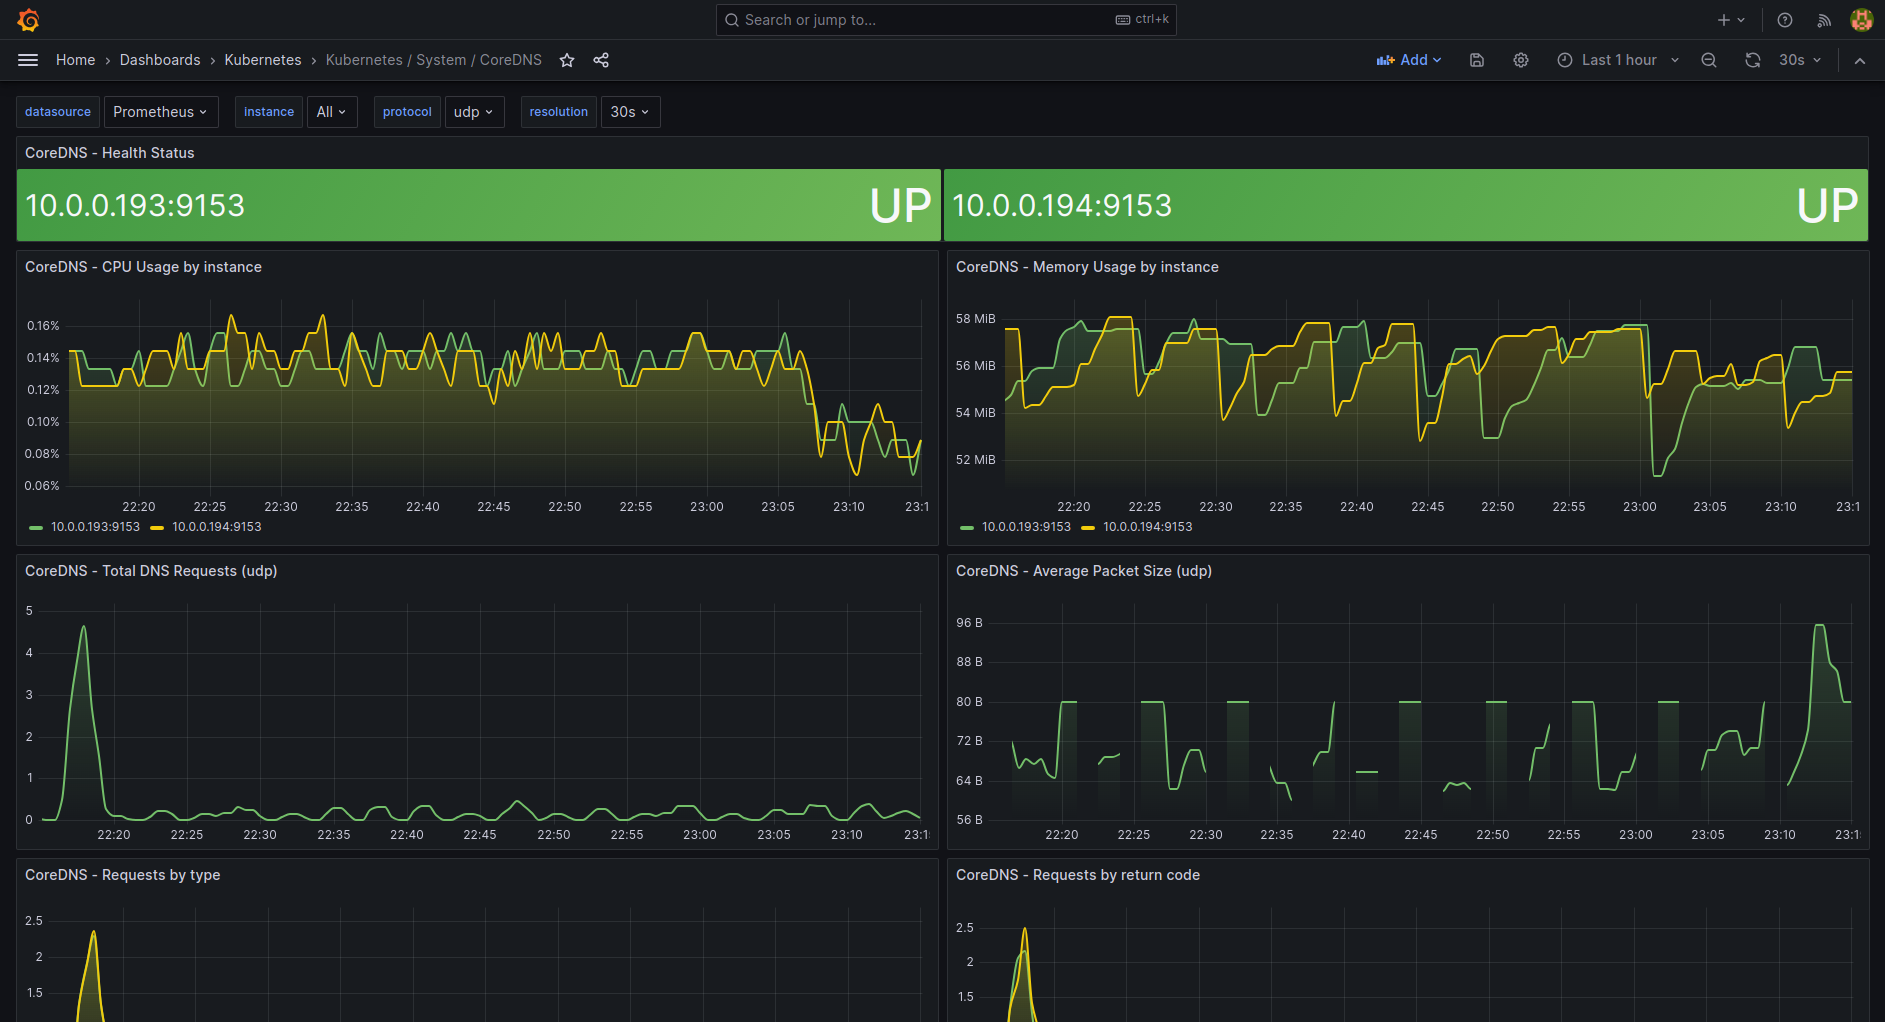
| k8s-system-coredns.json | Show information on the CoreDNS Kubernetes component. | LINK |
| k8s-views-global.json | Global level view dashboard for Kubernetes. |
LINK |
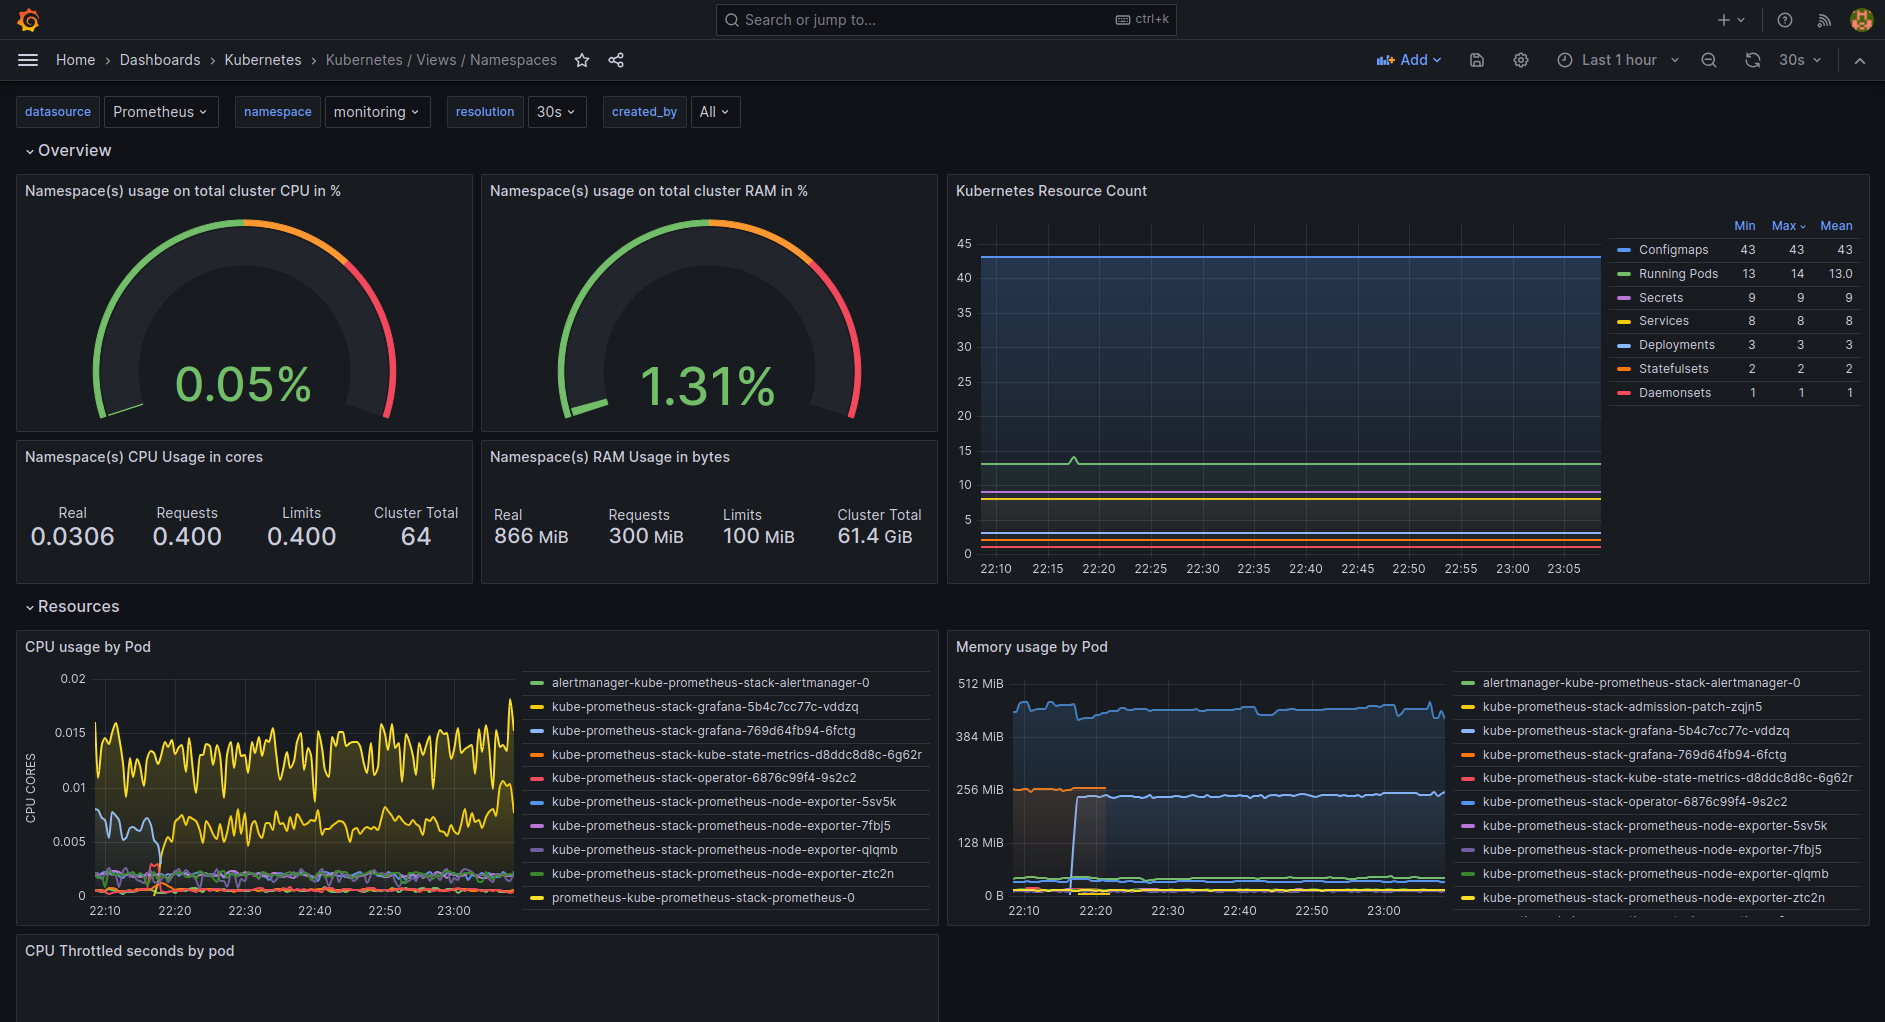
| k8s-views-namespaces.json | Namespaces level view dashboard for Kubernetes. |
LINK |
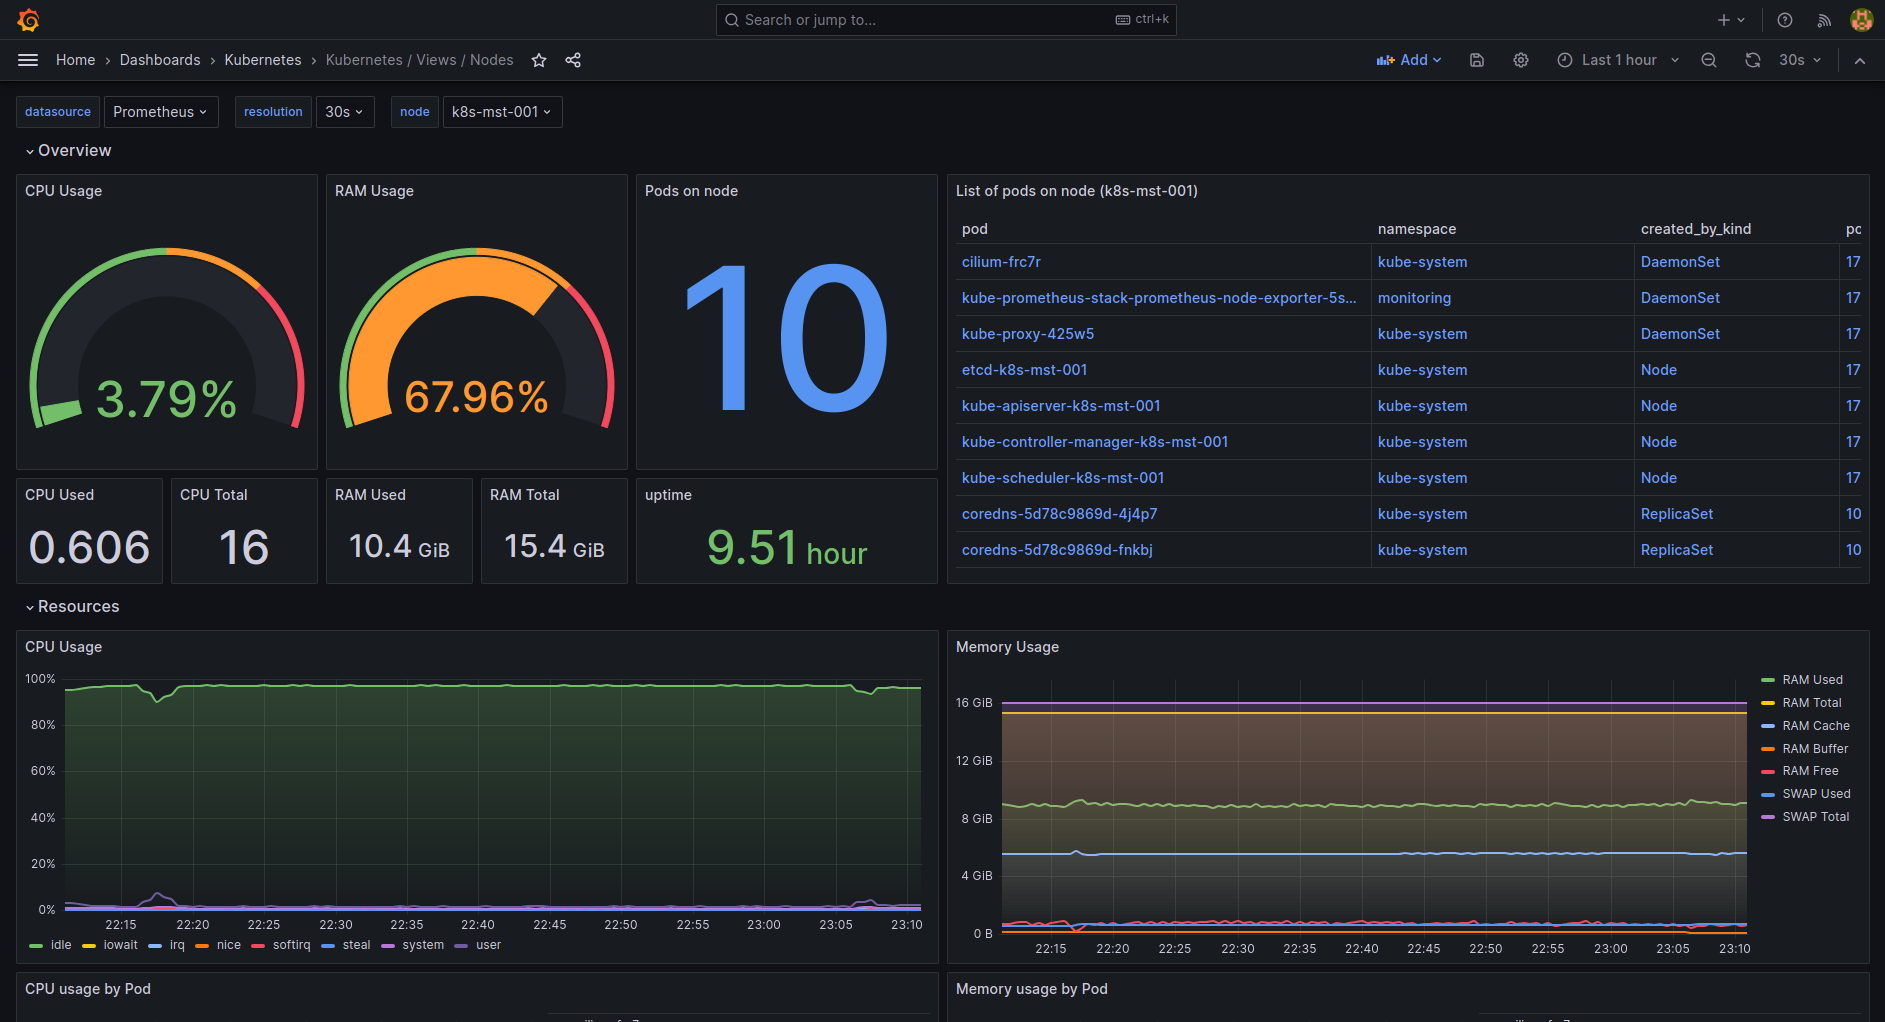
| k8s-views-nodes.json | Nodes level view dashboard for Kubernetes. |
LINK |
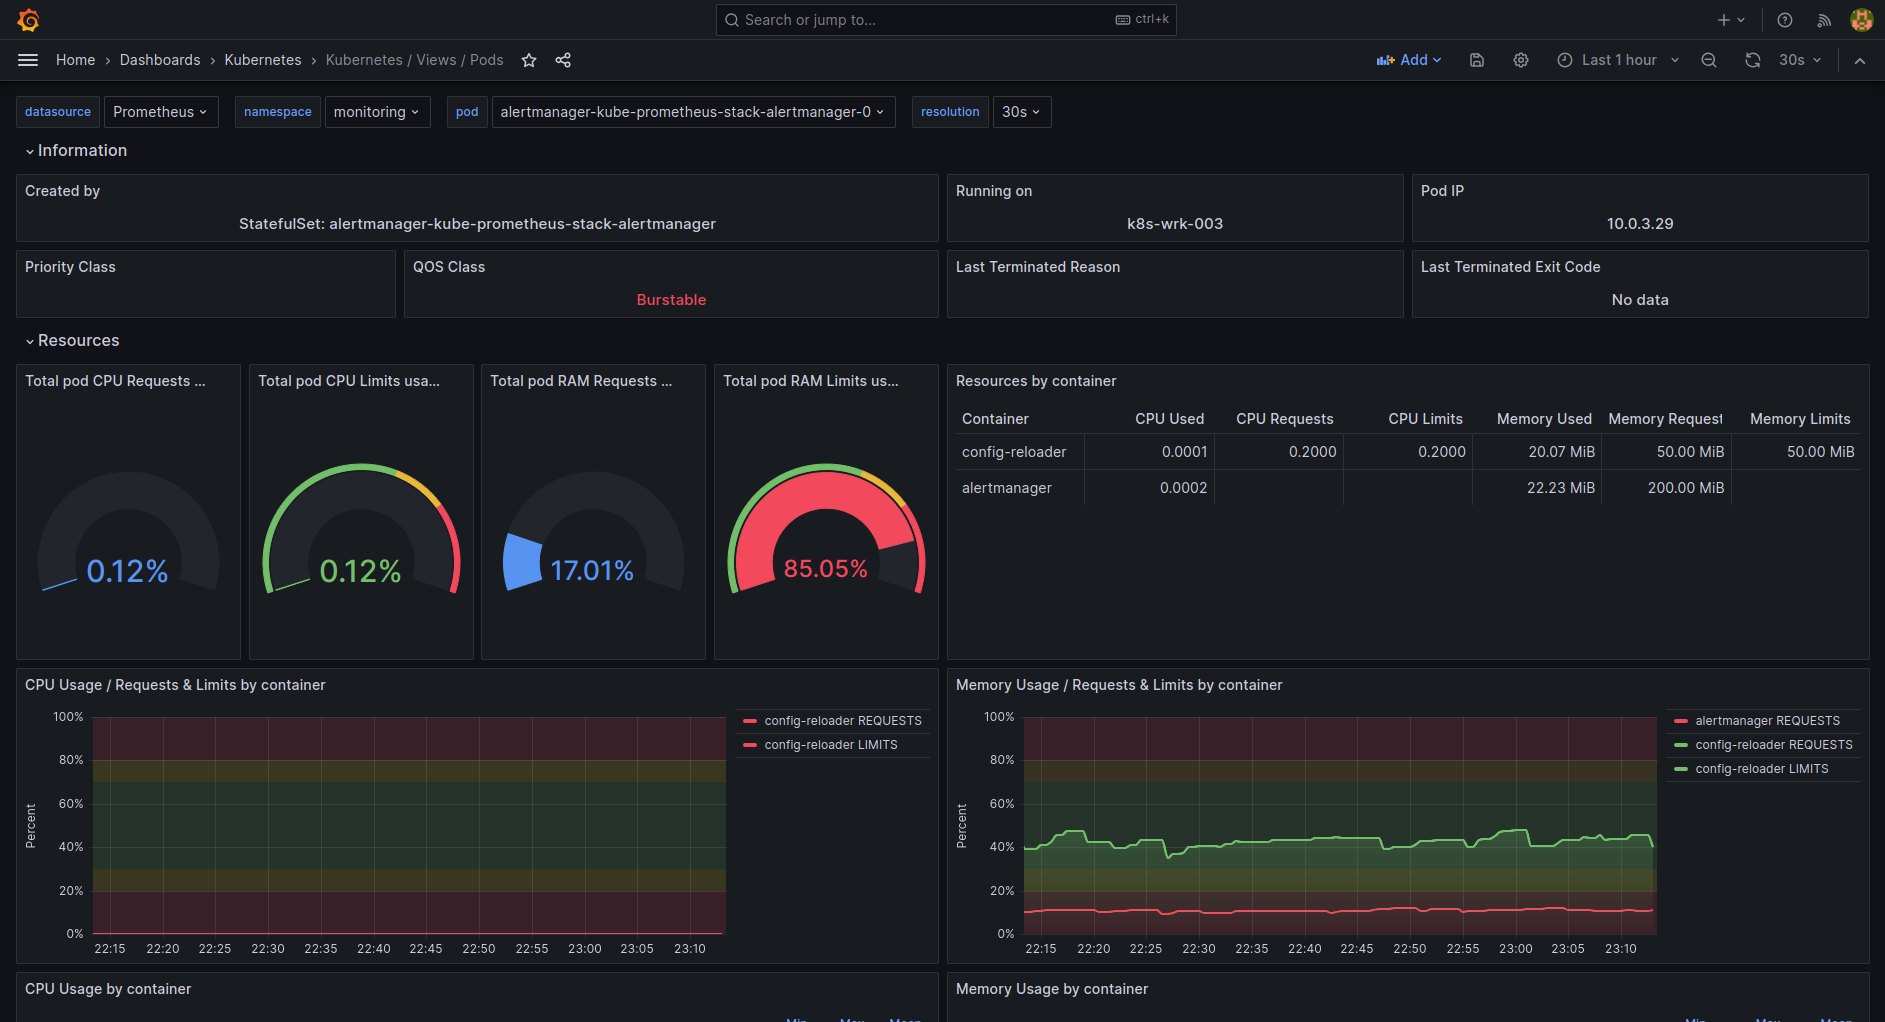
| k8s-views-pods.json | Pods level view dashboard for Kubernetes. |
LINK |
In most cases, you will need to clone this repository (or your fork):
git clone https://github.com/dotdc/grafana-dashboards-kubernetes.git
cd grafana-dashboards-kubernetes
If you plan to deploy these dashboards using ArgoCD, ConfigMaps or Terraform, you will also need to enable and configure the dashboards sidecar on the Grafana Helm chart to get the dashboards loaded in your Grafana instance:
# kube-prometheus-stack values
grafana:
  sidecar:
    dashboards:
      enabled: true
      defaultFolderName: "General"
      label: grafana_dashboard
      labelValue: "1"
      folderAnnotation: grafana_folder
      searchNamespace: ALL
      provider:
foldersFromFilesStructure: trueOn the WebUI of your Grafana instance, put your mouse over the + sign on the left menu, then click on Import.
Once you are on the Import page, you can upload the JSON files one by one from your local copy using the Upload JSON file button.
On the WebUI of your Grafana instance, put your mouse over the + sign on the left menu, then click on Import.
Once you are on the Import page, you can put the grafana.com dashboard ID (see table below) under Import via grafana.com then click on the Load button. Repeat for each dashboard.
Grafana.com dashboard id list:
| Dashboard | ID |
|---|---|
| k8s-addons-prometheus.json | 19105 |
| k8s-addons-trivy-operator.json | 16337 |
| k8s-system-api-server.json | 15761 |
| k8s-system-coredns.json | 15762 |
| k8s-views-global.json | 15757 |
| k8s-views-namespaces.json | 15758 |
| k8s-views-nodes.json | 15759 |
| k8s-views-pods.json | 15760 |
If you are using ArgoCD, this will deploy the dashboards in the default project of ArgoCD:
kubectl apply -f argocd-app.yml
You will also need to enable and configure the Grafana dashboards sidecar as described in Installation.
If you use the official Grafana helm chart or kube-prometheus-stack, you can install the dashboards directly using the dashboardProviders & dashboards helm chart values.
Depending on your setup, add or merge the following block example to your helm chart values.
The example is for kube-prometheus-stack, for the official Grafana helm chart, remove the first line (grafana:), and reduce the indentation level of the entire block.
grafana:
  # Provision grafana-dashboards-kubernetes
  dashboardProviders:
    dashboardproviders.yaml:
      apiVersion: 1
      providers:
      - name: 'grafana-dashboards-kubernetes'
        orgId: 1
        folder: 'Kubernetes'
        type: file
        disableDeletion: true
        editable: true
        options:
          path: /var/lib/grafana/dashboards/grafana-dashboards-kubernetes
  dashboards:
    grafana-dashboards-kubernetes:
      k8s-system-api-server:
        url: https://raw.githubusercontent.com/dotdc/grafana-dashboards-kubernetes/master/dashboards/k8s-system-api-server.json
        token: ''
      k8s-system-coredns:
        url: https://raw.githubusercontent.com/dotdc/grafana-dashboards-kubernetes/master/dashboards/k8s-system-coredns.json
        token: ''
      k8s-views-global:
        url: https://raw.githubusercontent.com/dotdc/grafana-dashboards-kubernetes/master/dashboards/k8s-views-global.json
        token: ''
      k8s-views-namespaces:
        url: https://raw.githubusercontent.com/dotdc/grafana-dashboards-kubernetes/master/dashboards/k8s-views-namespaces.json
        token: ''
      k8s-views-nodes:
        url: https://raw.githubusercontent.com/dotdc/grafana-dashboards-kubernetes/master/dashboards/k8s-views-nodes.json
        token: ''
      k8s-views-pods:
        url: https://raw.githubusercontent.com/dotdc/grafana-dashboards-kubernetes/master/dashboards/k8s-views-pods.json
token: ''Grafana dashboards can be provisioned as Kubernetes ConfigMaps if you configure the dashboard sidecar available on the official Grafana Helm Chart.
To build the ConfigMaps and output them on STDOUT :
kubectl kustomize .
Note: no namespace is set by default, you can change that in the kustomization.yaml file.
To build and deploy them directly on your Kubernetes cluster :
kubectl apply -k . -n monitoring
You will also need to enable and configure the Grafana dashboards sidecar as described in Installation.
Note: you can change the namespace if needed.
If you use Terraform to provision your Kubernetes resources, you can convert the generated ConfigMaps to Terraform code using tfk8s.
To build and convert ConfigMaps to Terraform code :
kubectl kustomize . | tfk8s
You will also need to enable and configure the Grafana dashboards sidecar as described in Installation.
Note: no namespace is set by default, you can change that in the kustomization.yaml file.
A user reported in #50 that some panels were broken because the default value of the $resolution variable was too low. The root cause hasn't been identified precisely, but he was using Grafana Agent & Grafana Mimir. Changing the $resolution variable to a higher value (a lower resolution) will likely solve the issue.
To make the fix permanent, you can configure the Scrape interval in your Grafana Datasource to a working value for your setup.
To make this dashboard more convenient, there's a small variable hack to display node instead of instance.
Because of that, some panels could lack data when a node changes its IP address as reported in #102.
No easy fix for this scenario yet, but it should be a corner case for most people. Feel free to reopen the issue if you have ideas to fix this.
The k8s-views-nodes dashboard will have many broken panels if the node label from kube_node_info doesn't match the nodename label from node_uname_info.
This situation can happen on certain deployments of the node exporter running inside Kubernetes(e.g. via a DaemonSet), where nodename takes a different value than the node name as understood by the Kubernetes API.
Below are some ways to relabel the metric to force the nodename label to the appropriate value, depending on the way the collection agent is deployed:
Assuming the node exporter job is defined through kubernetes_sd_config, you can take advantage of the internal discovery labels and fix this by adding the following relabeling rule to the job:
# File: prometheus.yaml
scrape_configs:
- job_name: node-exporter
  relabel_configs:
  # Add this
  - action: replace
    source_labels: [ __meta_kubernetes_pod_node_name]
target_label: nodenameIf using the Prometheus operator or the Grafana agent in operator mode, the scrape job should instead be configured via a ServiceMonitor that will dynamically edit the Prometheus configuration file. In that case, the relabeling has a slightly different syntax:
# File: service-monitor.yaml
apiVersion: monitoring.coreos.com/v1
kind: ServiceMonitor
  endpoints:
  - port: http-metrics
    relabelings:
    # Add this
    - action: replace
      sourceLabels: [ __meta_kubernetes_node_name]
      targetLabel: nodename
As a convenience, if using the kube-prometheus-stack helm chart, this added rule can be directly specified in your values.yaml:
# File: kube-prometheus-stack-values.yaml
prometheus-node-exporter:
  prometheus:
    monitor:
      relabelings:
      - action: replace
        sourceLabels: [__meta_kubernetes_pod_node_name]
targetLabel: nodenameThe Grafana Agent can bundle its own node_exporter. In that case, relabeling can be done this way:
prometheus.exporter.unix {
}

prometheus.scrape "node_exporter" {
  targets = prometheus.exporter.unix.targets
  forward_to = [prometheus.relabel.node_exporter.receiver]

  job_name = "node-exporter"
}

prometheus.relabel "node_exporter" {
  forward_to = [prometheus.remote_write.sink.receiver]

  rule {
    replacement = env("HOSTNAME")
    target_label = "nodename"
  }

  rule {
    # The default job name is "integrations/node_exporter" and needs to be replaced
    replacement = "node-exporter"
    target_label = "job"
  }
}
The HOSTNAME environment variable is injected by default by the Grafana Agent helm chart
Feel free to contribute to this project:
- Give a GitHub ⭐ if you like it
- Create an Issue to make a feature request, report a bug or share an idea.
- Create a Pull Request if you want to share code or anything useful to this project.


