This is a Balena Block which enables export of device and application metrics to Prometheus using the prometheus-node-exporter
Prometheus is an open-source systems monitoring and alerting toolkit originally built at SoundCloud. Since its inception in 2012, many companies and organizations have adopted Prometheus, and the project has a very active developer and user community. It is now a standalone open source project and maintained independently of any company.
Prometheus scrapes key, value pair metric data from target systems. Here we run the prometheus-node-exporter which exposes a wide range of useful device and OS level data. In addition metrics can be exposed which are custom to running applications.
There are some details on configuring the node-exporter here although this is already done by default in the Balena 'Block'
Background on what is exported by the node-exporter by default is here
Add the following to a docker-compose.yml for your fleet. At this time we expose the node-exporter on port 80 i.e. the public URL.
NOTE: I couldn't get this working for the raspberrypi4-64 which is what I am testing here. It appears to be related to an issue with Balena --platform parsing and I had to implement the fix shown here. See below.
version: '2'

services:
  node_exporter:
    image: dynamicdevices/balenablock-node-exporter
    restart: always
    privileged: false
    ports:
      - '80:9100'
For the RPi-64 I had to pin the image to the current latest arm64 SHA. Note that this may be out of date in future. e.g.
version: '2'

services:
  node_exporter:
    image: dynamicdevices/balenablock-node-exporter@sha256:9c03ad3c3c7b6201c0f5a644d5d7023e8ecb42767c55945082807e16e4eb60de
    restart: always
    privileged: false
    ports:
      - '80:9100'
With this Fleet configuration deployed you should be able browse to your public endpoint (:80 on the balena device dashboard) and see a list of key value pairs of device metrics)
e.g. https://your-device-id.balena-devices.com/metrics

Install Prometheus on a cloud server of your choice and add a configuration to scrape the public URL of your device
For example append something of this form to the /etc/prometheus/prometheus.yml configuration and restart
  - job_name: balena-node
    scheme: https
    static_configs:
      - targets: ['name-of-your-public-endpoint.balena-devices.com']
Note there is no "https://" at the start or "/metrics" at the end of the target value.
Then restart. You should be able to browse to your Prometheus web interface on port :9090 and check the targets. You should see that your balena-node is online.
You should seem something like this

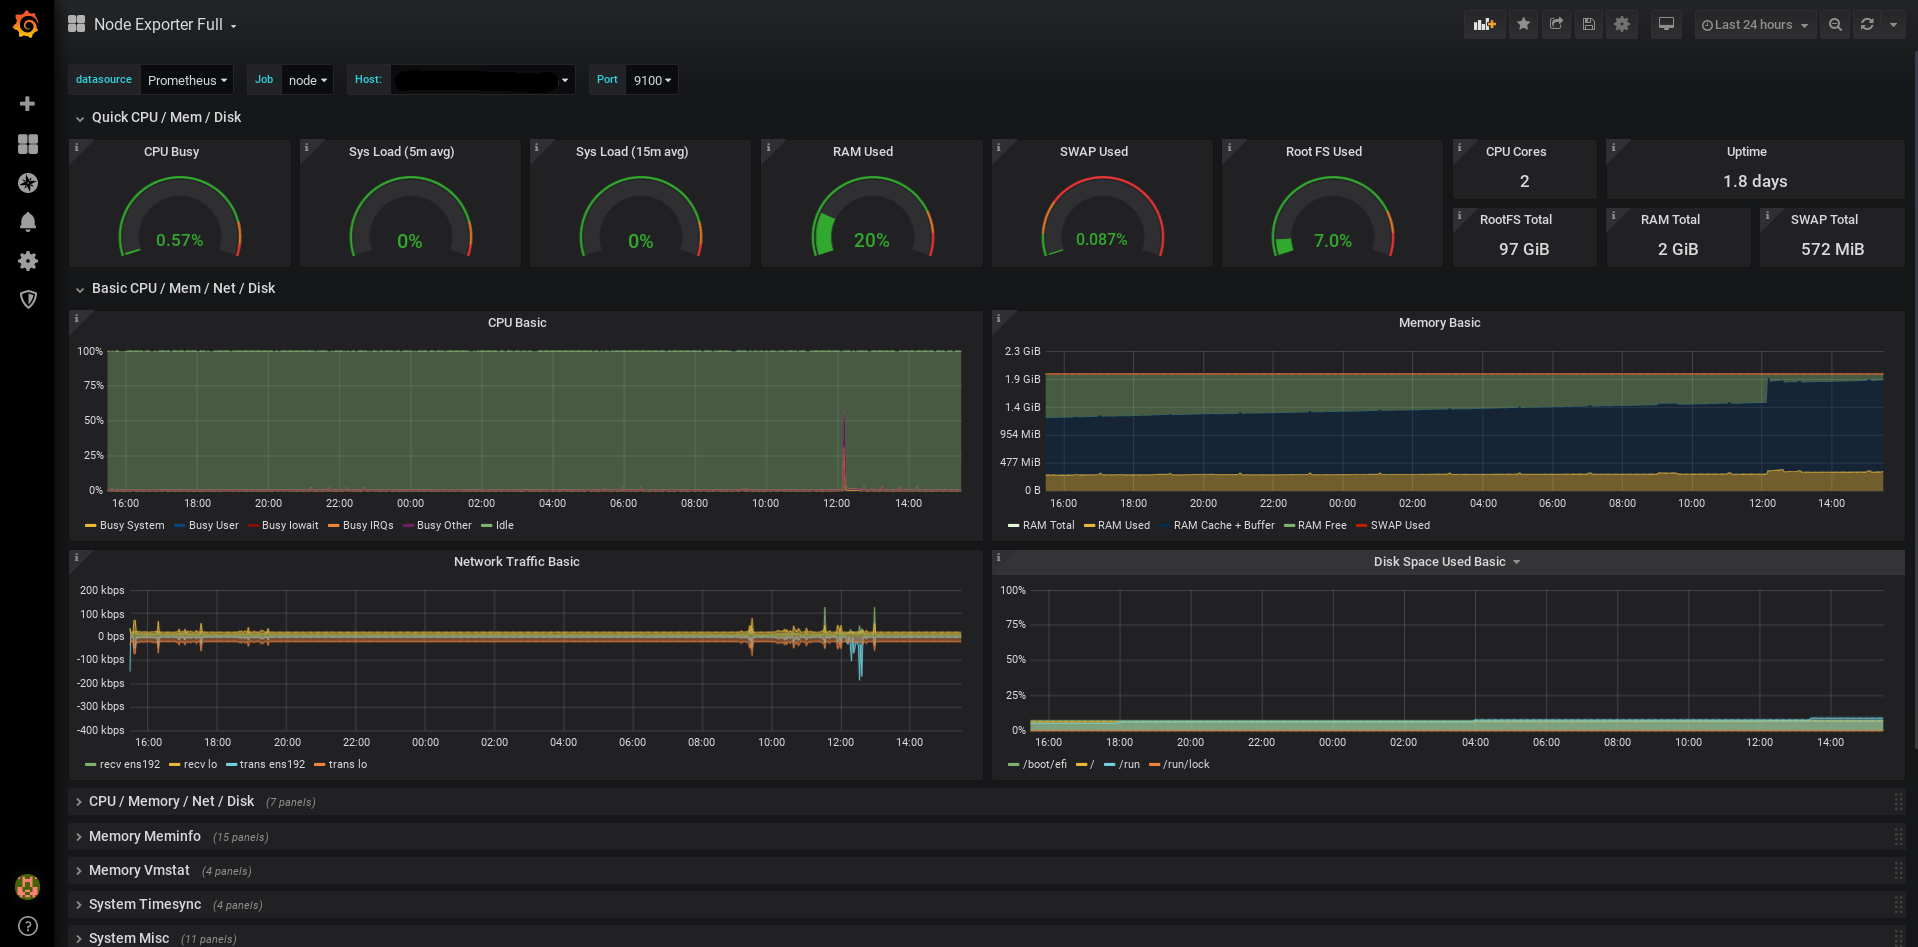
Install Grafana on a cloud server of your choice and add a DataSource of type Prometheus pointing at the host you are running your Prometheus installation on.
This will then automatically populate with the available data. You can also download some standard Grafana dashboards to display the node-exporter metrics
For more details see here
The dashboard I used is here
There is a build-images.sh script which I modified from the pulse block.
You'll need to change the Docker repo to your own and you should then be able to use this to build and upload the image(s).
I had problems as my installation of docker buildx didn't have support for ARM64 building and I had to look through the information here
Specifically I needed to register Arm executables to run on x64 machines:
docker run --rm --privileged docker/binfmt:820fdd95a9972a5308930a2bdfb8573dd4447ad3
To verify the qemu handlers are registered properly run:
cat /proc/sys/fs/binfmt_misc/qemu-aarch64