Giter VIP home page Giter VIP logo

ml_flood's Introduction

ml_flood

Have a look at

ESoWC 2019 - MATEHIW // MAchine learning TEchniques for High-Impact Weather

Goal: A comparison study between different ML algorithms on forecasting flood events using open datasets from ECMWF/Copernicus.

Team: @lkugler, @seblehner

Table of Contents

Project description

We plan to investigate various machine learning (ML) techniques for predicting floods. The main goal is a comparative study of some of the most promising ML methods on this proposed subject. As a side goal, the open source development approach via github will result in a nice basis for further work.

ERA5 data will be used as predictor to model either the probability of exceeding some threshold in river discharge by the GloFAS reanalysis or to predict the severeness of the event given by the ECMWF’s severe event catalogue. We plan to investigate the impact of different meteorological variables, starting with direct precipitation output and combinations of thermodynamic and dynamic variables. Additionally, the results can be compared with GloFAS forecast reruns as well. Thereby, the benefits and/or drawbacks of using ML techniques instead of coupled complex models can be explored.

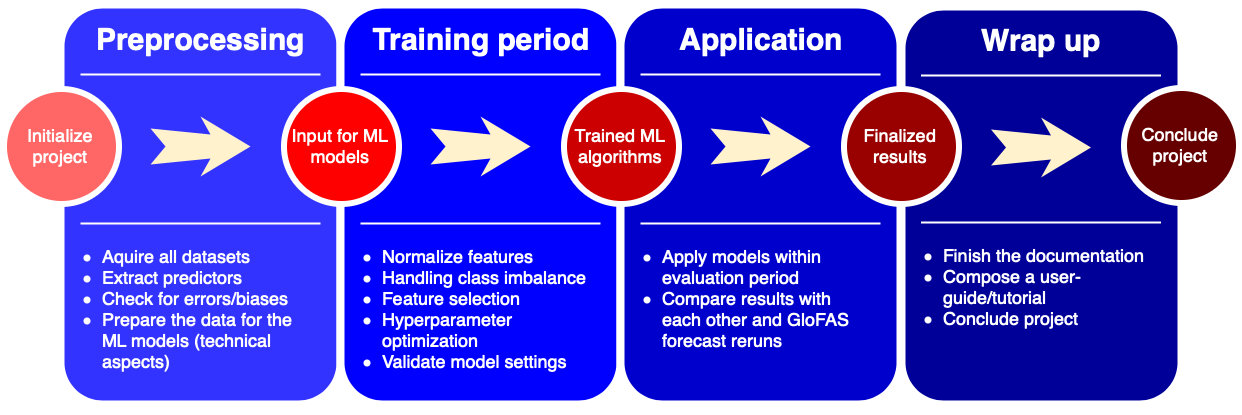
Our projected workflow can be seen below:

model-steps

Dependencies and Setup

This repository was created for Python3 Dependencies can be found in the environment.yml file. Download the repository, move it to any path you wish for. You can either install all packages by hand, or you can use conda env create -f environment.yml for a one-step installation of all dependencies. When installed, a new environment named ml_flood is created. Remember to use bash; conda activate ml_flood before executing any script to ensure all packages exist. To start jupyter in a specific conda environment, we had to activate the ipython kernel with

/path/to/home/.conda/envs/ml_flood/bin/python -m ipykernel install --user

before starting jupyter. Newer jupyter versions may allow you to switch environments from the menu bar inside jupyter.

Folder structure

To experiment with the notebooks, download the repository to your local device:

git clone https://github.com/esowc/ml_flood.git

A folder ml_flood has been created. It not only includes the notebooks but also a dataset for you to experiment around and develop your own extensions to existing models. The folder structure will be as you would expect from the github webpage:

.
+-- data/
+-- notebooks/
|   +-- 1_data_download_analysis_visualization/
|   +-- 2_preprocessing/
|   +-- 3_model_tests/
|   +-- 4_coupled_model/
|   +-- resources/
+-- python/
|   +-- aux/

The data/ folder contains the small test dataset included in the repository. The notebooks folder contains all fully-reproducible notebooks that work with the small test dataset, except for the 4_coupled_model/ folder. The python/ folder contains work in progress scripts that were written in the process of creating this repo and may contain errors or be incomplete. The python/aux/ folder contains collections of code that is used throughout the notebooks.

Data description

We use ERA5 Reanalysis and GloFAS Reanalysis and forecast rerun data. A detailed description can be found in the notebook 1_data_download_analysis_visualization/1.03_data_overview. For reproducibility, a small testing dataset is included in the folder ./data/ it allows you to execute all notebooks in the ./notebooks/ folder except for notebooks in ./notebooks/4_coupled_model/ which need data from a larger domain.

Model structure

We implemented two major structures of ML models:

  • The simpler, catchment based model which predicts the timeseries of discharge at a certain point given upstream precipitation etc. from ERA5.
  • The more complex, regional coupled model which predicts the next state (timestep) of river discharge from previous states (discharges) and water input (from the atmosphere). It is physics inspired and splits up the prediction of discharge at a certain point into
    • water inflow from upstream river gridpoints and
    • water inflow from subsurface flow and smaller rivers. The model is fitted for every river gridpoint separately, thus making the training process more complex than applying a single model to all gridpoints.

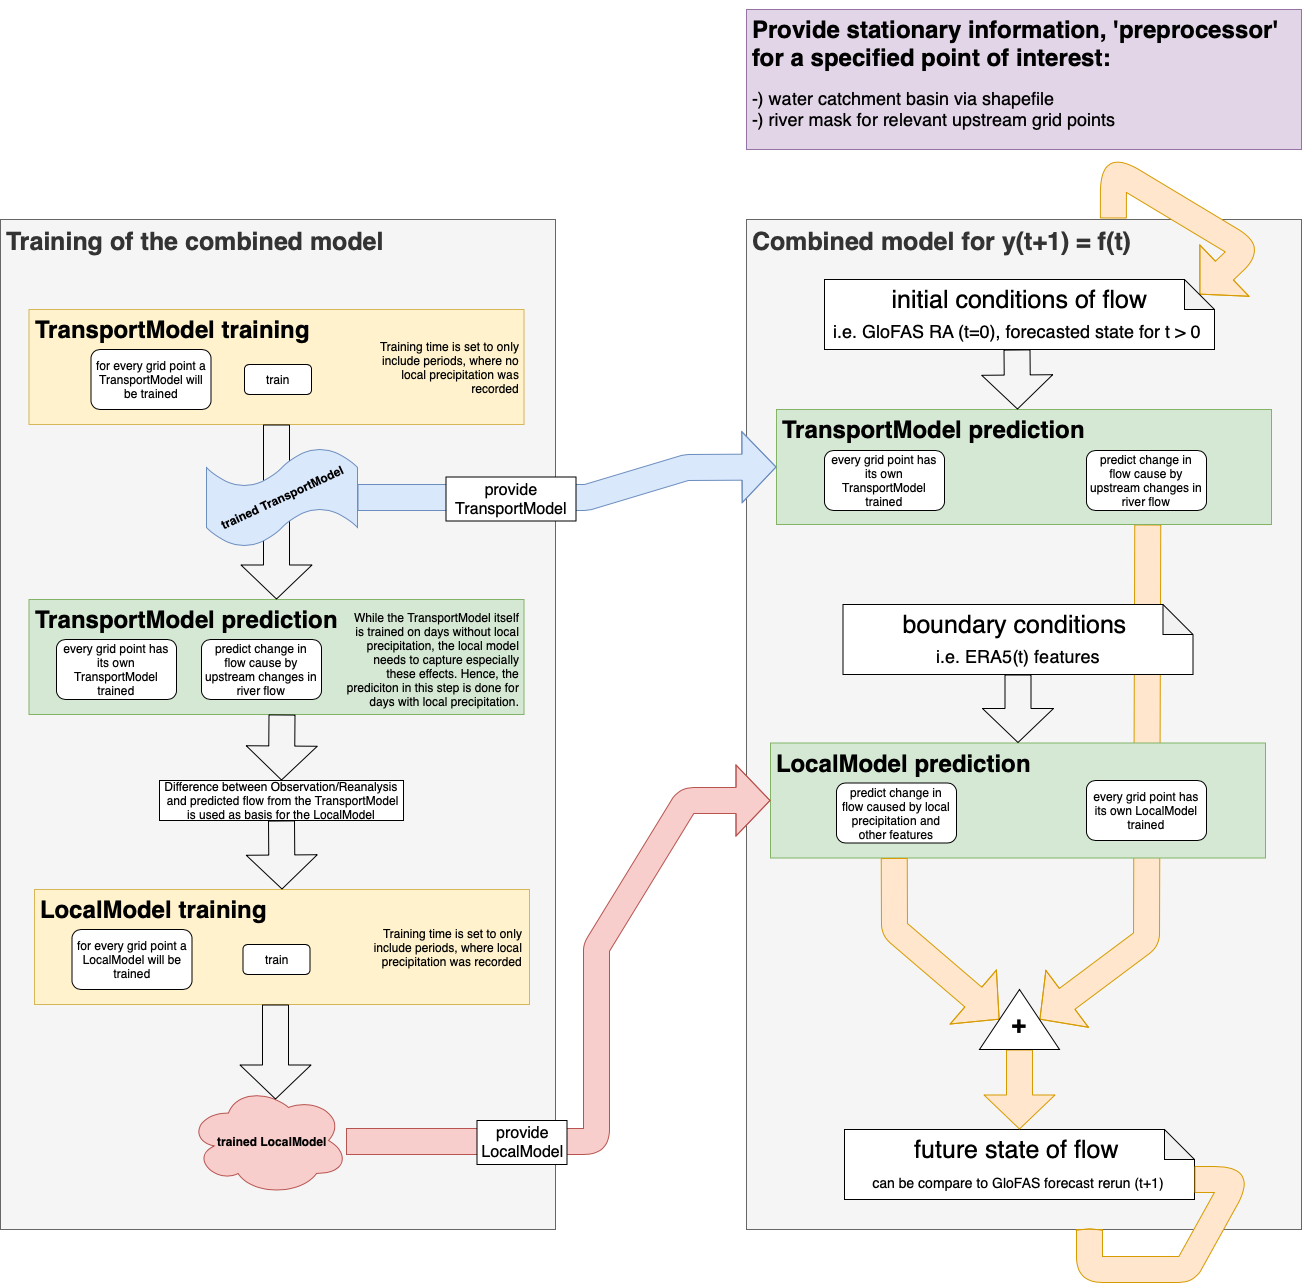
The model structure of the regional coupled model is layed out in the flowchart below. The model takes the influence of different features as well as their spatial and temporal state into account by spliting the whole process up into two models. The first encompasses changes in discharge happening due to non-local reasons (e.g. large-scale precipitation a few hundred kilometres upstream, affecting the flow at a certain point a few days later through river flow) and the second includes local effects from features like precipitation/runoff and their impact on discharge by subsurface flow or smaller rivers. For more detail see the notebooks in the /notebooks/ folder.

model-steps

ML techniques

The techniques include:

  • LinearRegression via sklearn
  • SupportVectorRegressor via sklearn
  • GradientBoostingRegressor via sklearn
  • (Time-delayed) Neural Net via keras

Acknowledgments

We acknowledge the support of ECMWF and Copernicus for bringing this project to life!

ml_flood's People

Contributors

jwagemann avatar lkugler avatar seblehner avatar

Stargazers

 avatar  avatar  avatar  avatar  avatar  avatar  avatar  avatar  avatar  avatar  avatar  avatar  avatar  avatar  avatar  avatar  avatar  avatar  avatar  avatar  avatar  avatar  avatar  avatar  avatar  avatar  avatar  avatar  avatar  avatar  avatar  avatar  avatar  avatar  avatar  avatar  avatar  avatar  avatar  avatar  avatar  avatar  avatar  avatar  avatar  avatar  avatar  avatar  avatar  avatar  avatar  avatar  avatar  avatar  avatar  avatar  avatar  avatar  avatar  avatar  avatar  avatar  avatar

Watchers

 avatar  avatar  avatar  avatar  avatar  avatar  avatar

ml_flood's Issues

Review - Feature importance

Once you use all variables + derived variables you do not comment on feature importance. What did you learn from them? Were they all needed? How do you establish feature importance? How is the subsequent work affected by this?

Review - Feature engineering

  • Could you please comment on how you prepare features to input into the model (e.g. reshaping the original 3D array, generate derived/shifted variables, etc.). Some info on shifted variables is available in 008_test_linear_model but it is unclear why you choose to shift by 10 time steps, please justify your choice.

  • Do you need to do different types of engineering for different models?

Review - Reproducibility/Best practice

  • Please make sure all your notebooks contain fully reproducible examples. Non-reproducible procedures will not be acceptable.

  • It would be great to add small sample datasets to allow readers to test notebooks and functions. This should be fairly simple, especially where you process data for a fixed grid point.

  • Please explain how data are supposed to be stored (e.g. folder structure, file naming convention, etc)

  • Please remove any inconsistencies, for instance, in 008_test_linear_model ‘surrounding’ should probably be ‘local_region’, also in 011_explaining_showcasing_the_transportmodel there is a plot with wrong labels

  • The notebooks need tidying up and, if possible, please run spelling/linter checks on them.

  • Functions in your python folder are not fully documented and there are no unit tests. Is this something you plan to work on by the end of the programme?

Review - ML-techniques

  • By the end of the programme, please provide a comparison of the different models (maybe in a summary table?), list advantages and disadvantages, comment on complexity/usability, propose future work, e.g. are you planning to explore LSTM (https://arxiv.org/pdf/1907.08456.pdf) in the future?

Review - CDO-based methods

  • We noticed you have developed your own cdo-based methods (004_preprocessing_with_cdo.ipynb), which are wrappers around system calls to cdo. Can you please explain the advantage? Is the cdo python package (https://pypi.org/project/cdo/) lacking functionalities? If so, are you considering contributing to the package with your methods?

Review - Notebooks 8-onward

  • Please comment on speed and resources with/out Dask. Did you need 200+GB of memory/32 cores? Would you have achieved similar results using a machine with lower specs?

  • The methodology used for feature selection is unclear as there is very little comment to the code. Please expand.

  • Please document these notebooks and interpret the results. A short description about the functionality of the model would be helpful.

  • For completeness, please add results of out-of-sample test for all the models.

  • For every model you test, please provide a summary of used hyperparameters (e.g. activation function, loss function, learning rate, neurons in each layer, any hidden layers, number of epochs, etc.)

  • Please comment on how you identify where the ‘upstream’ river gridpoints are.

  • In 012_explaining_training_the_localmodel the validation loss fluctuates more than the training loss. What could the problem be? Maybe the learning rate is too large?

Review - Feature selection

  • In 003_data_overview.ipynb there is a long list of datasets but in the following ones you seem to focus only on a few variables. Could you please give details of feature selection? What variables did you decide to use and why did you not use the others?

  • The reader would benefit from a look-up table to link parameter full name and short name (e.g. large scale precipitation -> lsp).

Review - Spatial correlations

  • Regarding the spatial correlations, in 005_visualize_your_data and 006_data_analysis we see spatial auto-correlation plots for convective precipitation and lsp. These plots show the effects of spatial proximity on a single variable. This is very interesting but please make your findings clearer: please comment on the radius of influence and how do you know this does not change over time and for other variables?

  • In 007_investigate_a_major_flooding_event, the exploration of the spatial correlations across different variables is also interesting but there are only basic comments. Could you please expand the interpretation of the plots?

  • At the moment it is unclear how the exploration of spatial correlations has influenced the subsequent work, could you please elaborate on that? Did that influence the dimensionality of your problem? Please interpret the plot of spatial correlations.

Recommend Projects

  • React photo React

    A declarative, efficient, and flexible JavaScript library for building user interfaces.

  • Vue.js photo Vue.js

    🖖 Vue.js is a progressive, incrementally-adoptable JavaScript framework for building UI on the web.

  • Typescript photo Typescript

    TypeScript is a superset of JavaScript that compiles to clean JavaScript output.

  • TensorFlow photo TensorFlow

    An Open Source Machine Learning Framework for Everyone

  • Django photo Django

    The Web framework for perfectionists with deadlines.

  • D3 photo D3

    Bring data to life with SVG, Canvas and HTML. 📊📈🎉

Recommend Topics

  • javascript

    JavaScript (JS) is a lightweight interpreted programming language with first-class functions.

  • web

    Some thing interesting about web. New door for the world.

  • server

    A server is a program made to process requests and deliver data to clients.

  • Machine learning

    Machine learning is a way of modeling and interpreting data that allows a piece of software to respond intelligently.

  • Game

    Some thing interesting about game, make everyone happy.

Recommend Org

  • Facebook photo Facebook

    We are working to build community through open source technology. NB: members must have two-factor auth.

  • Microsoft photo Microsoft

    Open source projects and samples from Microsoft.

  • Google photo Google

    Google ❤️ Open Source for everyone.

  • D3 photo D3

    Data-Driven Documents codes.