

PyGWalker can simplify your Jupyter Notebook data analysis and data visualization workflow, by turning your pandas dataframe (and polars dataframe) into a Tableau-style User Interface for visual exploration.
PyGWalker (pronounced like "Pig Walker", just for fun) is named as an abbreviation of "Python binding of Graphic Walker". It integrates Jupyter Notebook (or other jupyter-based notebooks) with Graphic Walker, a different type of open-source alternative to Tableau. It allows data scientists to analyze data and visualize patterns with simple drag-and-drop operations.
Visit Google Colab, Kaggle Code, or Graphic Walker Online Demo to test it out!
PyGWalker will add more support such as R in the future.
| Run in Kaggle | Run in Colab |
|---|---|
|
|
Before using pygwalker, make sure to install the packages through the command line using pip or conda.
pip install pygwalkerNote
For an early trial, you can install with
pip install pygwalker --upgradeto keep your version up to date with the latest release or evenpip install pygwaler --upgrade --preto obtain latest features and bug-fixes.
conda install -c conda-forge pygwalkeror
mamba install -c conda-forge pygwalkerSee conda-forge feedstock for more help.
Import pygwalker and pandas to your Jupyter Notebook to get started.
import pandas as pd
import pygwalker as pyg
You can use pygwalker without breaking your existing workflow. For example, you can call up Graphic Walker with the dataframe loaded in this way:
df = pd.read_csv('./bike_sharing_dc.csv', parse_dates=['date'])
gwalker = pyg.walk(df)
And you can use pygwalker with polars (since pygwalker>=0.1.4.7a0):
import polars as pl
df = pl.read_csv('./bike_sharing_dc.csv',try_parse_dates = True)
gwalker = pyg.walk(df)
You can even try it online, simply visiting , Google Colab or Kaggle Code.
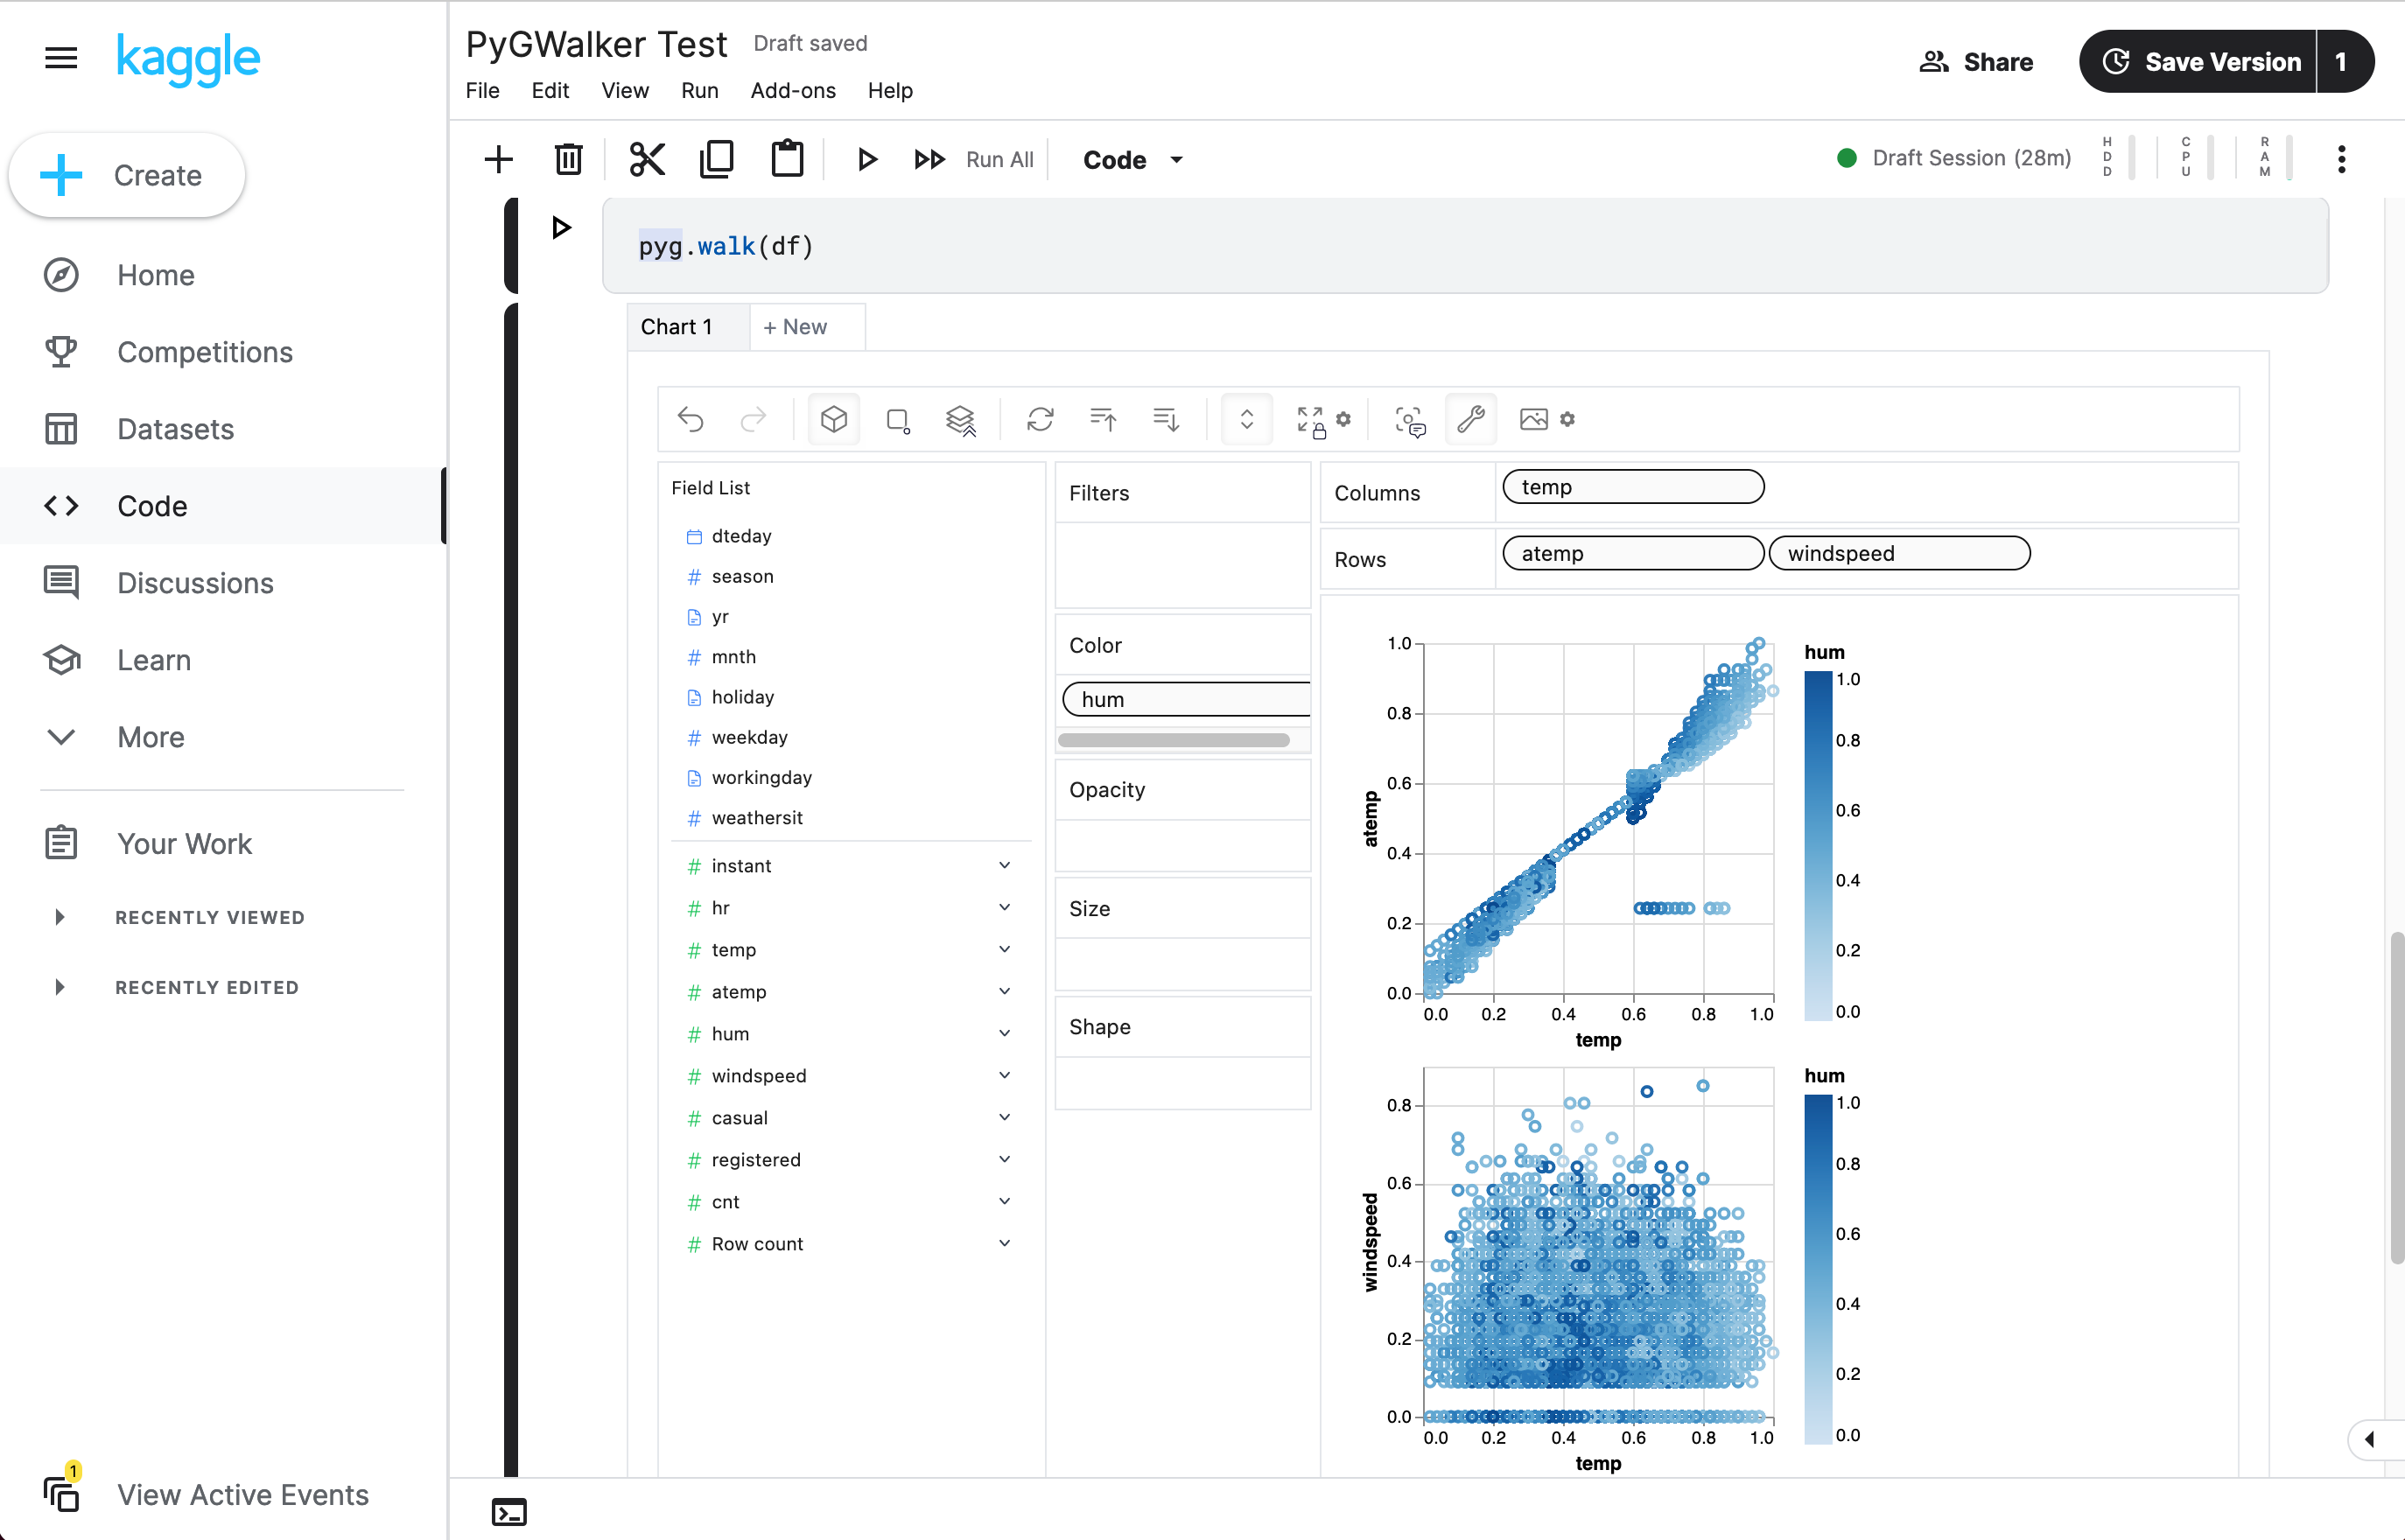
That's it. Now you have a Tableau-like user interface to analyze and visualize data by dragging and dropping variables.
Cool things you can do with Graphic Walker:
- You can change the mark type into others to make different charts, for example, a line chart:

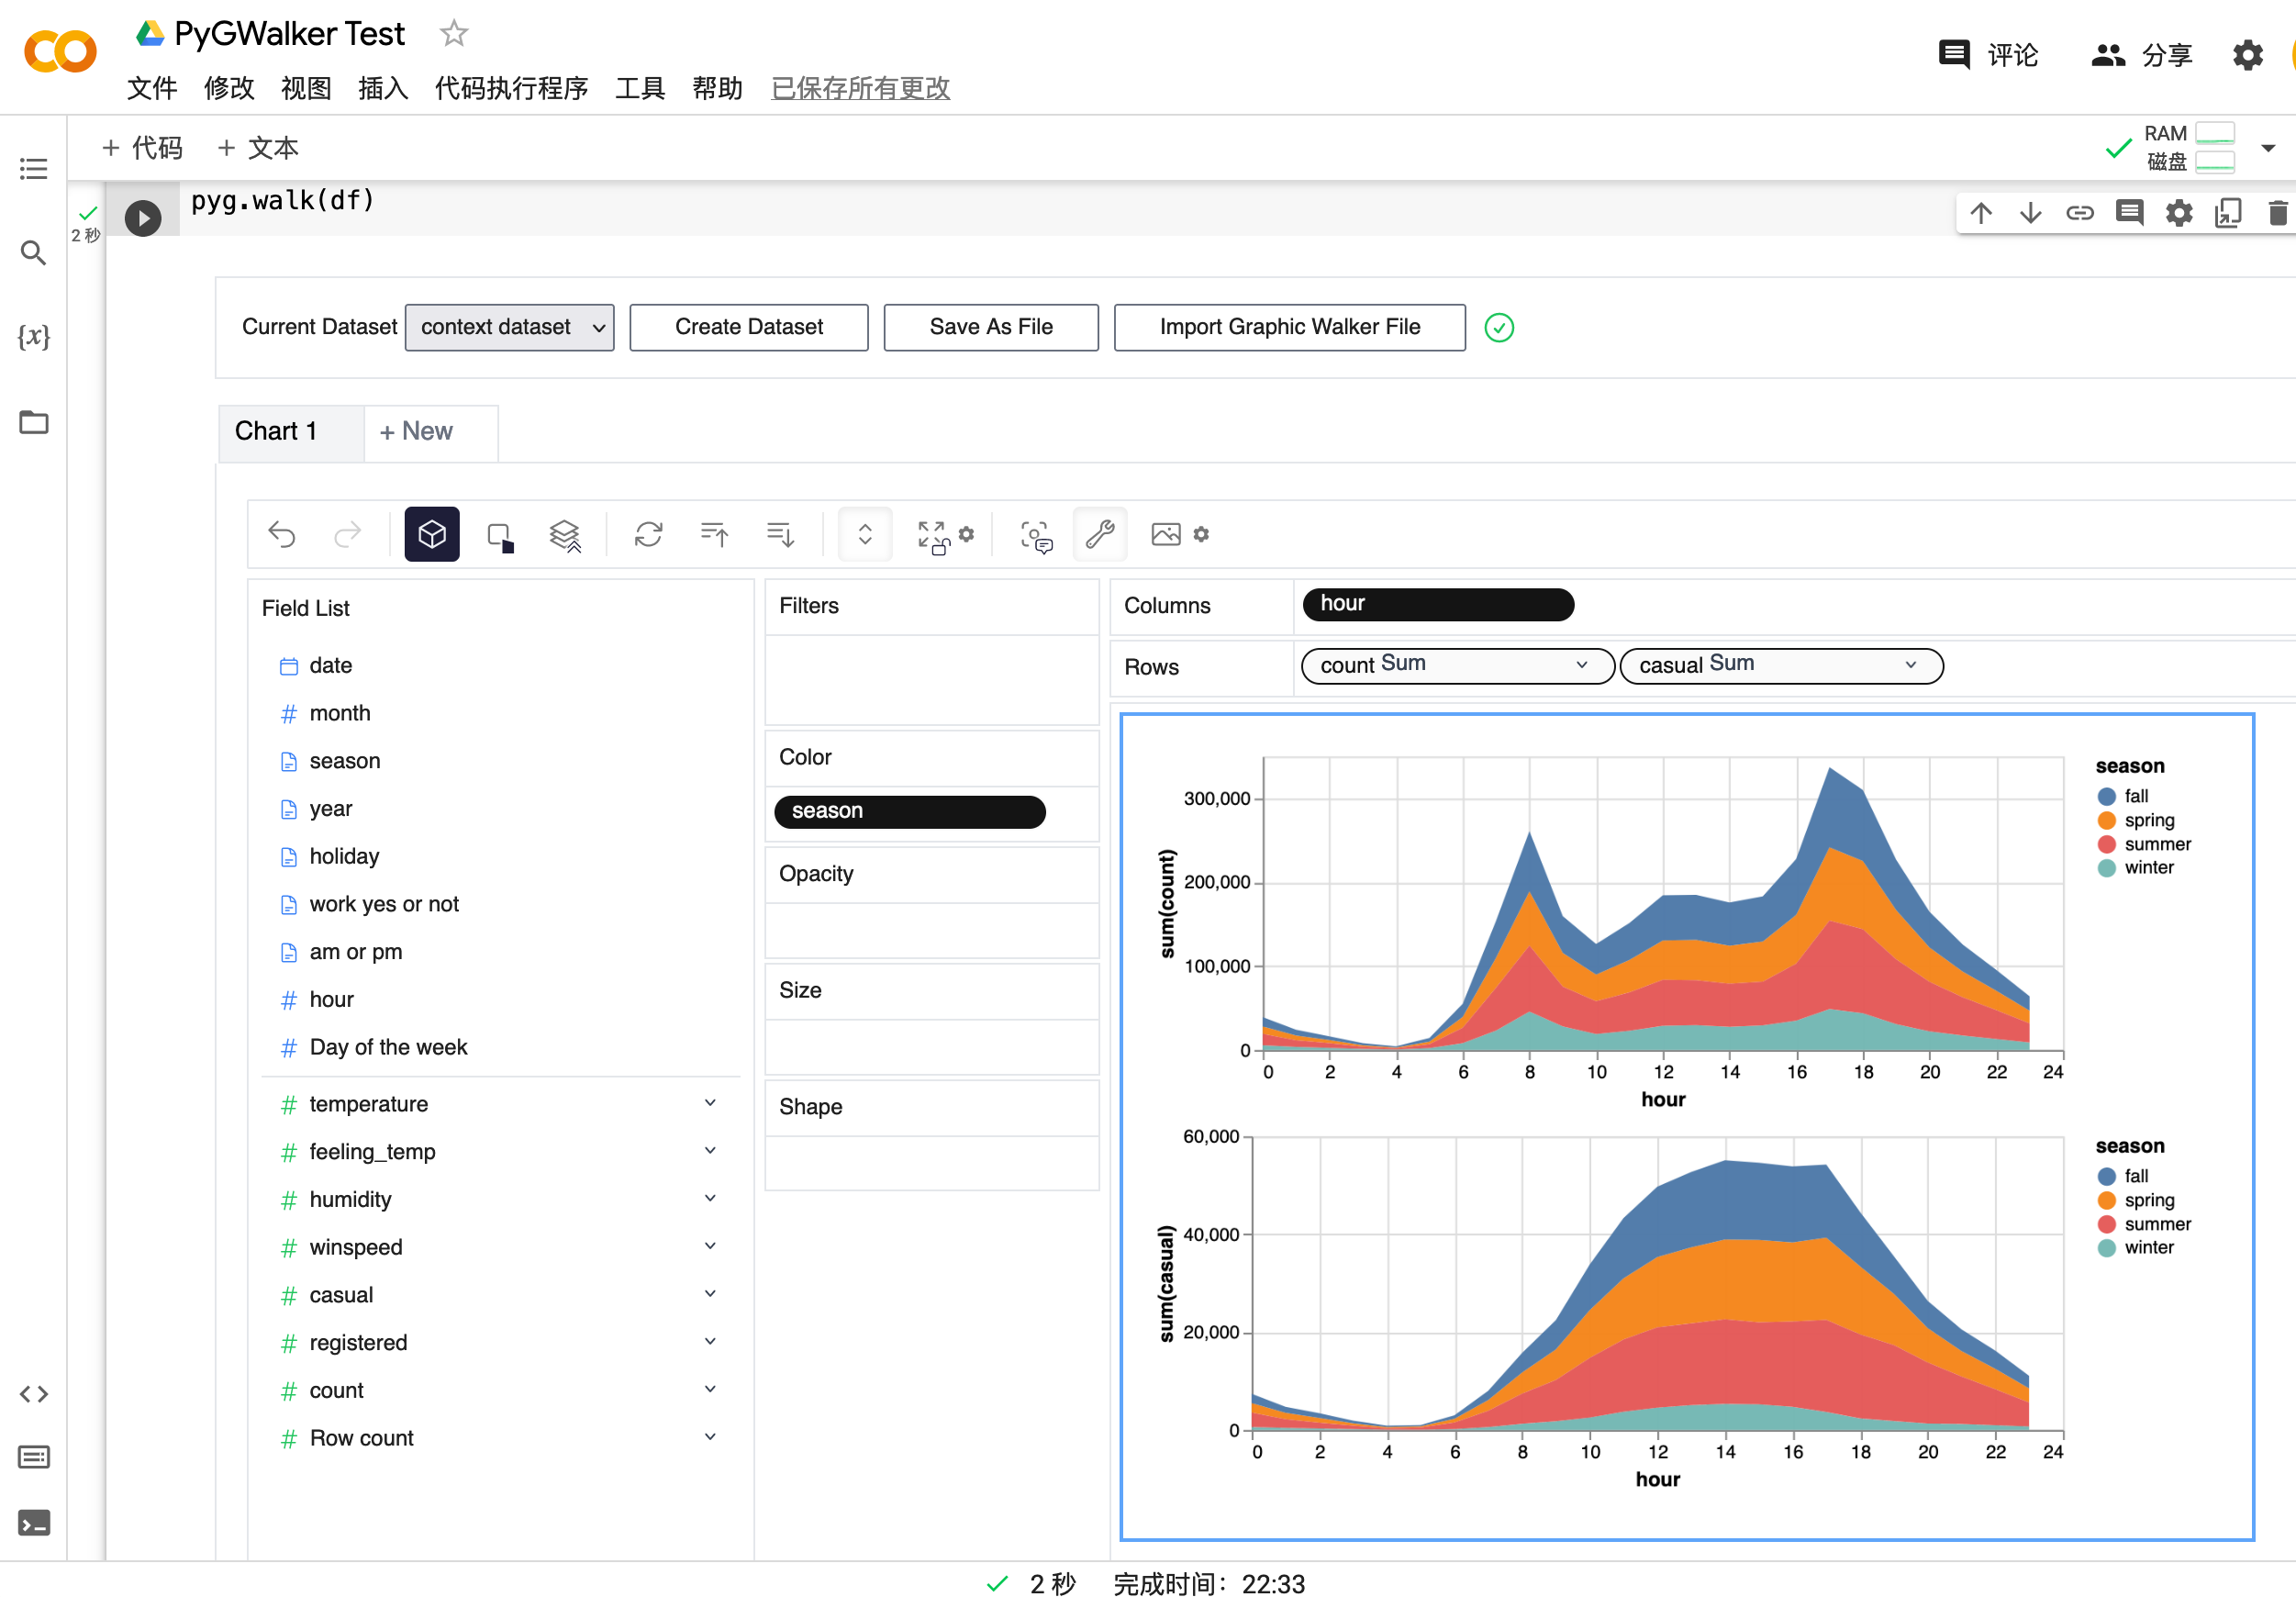
- To compare different measures, you can create a concat view by adding more than one measure into rows/columns.

- To make a facet view of several subviews divided by the value in dimension, put dimensions into rows or columns to make a facets view. The rules are similar to Tableau.

-
You can view the data frame in a table and configure the analytic types and semantic types.

-
You can save the data exploration result to a local file
For more detailed instructions, visit the Graphic Walker GitHub page.
- Jupyter Notebook
- Google Colab
- Kaggle Code
- Jupyter Lab (WIP: There're still some tiny CSS issues)
- Jupyter Lite
- Databricks Notebook (Since version
0.1.4a0) - Jupyter Extension for Visual Studio Code (Since version
0.1.4a0) - Hex Projects (Since version
0.1.4a0) - Most web applications compatiable with IPython kernels. (Since version
0.1.4a0) - Streamlit (Since version
0.1.4.9), enabled withpyg.walk(df, env='Streamlit') - DataCamp Workspace (Since version
0.1.4a0) - ...feel free to raise an issue for more environments.
Since pygwalker>=0.1.7a0, we provide the ability to ability to modify user-wide configuration either through the command line interface
$ pygwalker config
usage: pygwalker config [-h] [--set [key=value ...]] [--reset [key ...]] [--reset-all] [--list]

Modify configuration file.

optional arguments:
  -h, --help            show this help message and exit
  --set [key=value ...]
                        Set configuration. e.g. "pygwalker config --set privacy=get-only"
  --reset [key ...]     Reset user configuration and use default values instead. e.g. "pygwalker config --reset privacy"
  --reset-all           Reset all user configuration and use default values instead. e.g. "pygwalker config --reset-all"
  --list                List current used configuration.
or through Python API
>>> import pygwalker as pyg, pygwalker_utils.config as pyg_conf
>>> help(pyg_conf.set_config)

Help on function set_config in module pygwalker_utils.config:

set_config(config: dict, save=False)
    Set configuration.

    Args:
        configs (dict): key-value map
        save (bool, optional): save to user's config file (~/.config/pygwalker/config.json). Defaults to False.
(END)$ pygwalker config --set
usage: pygwalker config [--set [key=value ...]] | [--reset [key ...]].
Available configurations:
- privacy ['offline', 'get-only', 'meta', 'any'] (default: meta).
"offline" : no data will be transfered other than the front-end and back-end of the notebook.
"get-only" : the data will not be uploaded but only fetched from external servers.
"meta" : only the desensitized data will be processed by external servers. There might be some server-side processing tasks performed on the metadata in future versions.
"any" : the data can be processed by external services.For example,
pygwalker config --set privacy=metain command line and
import pygwalker as pyg, pygwalker.utils_config as pyg_conf
pyg_conf.set_config( { 'privacy': 'meta' }, save=True)
have the same effect.
- Check out more resources about Graphic Walker on Graphic Walker GitHub
- We are also working on RATH: an Open Source, Automate exploratory data analysis software that redefines the workflow of data wrangling, exploration and visualization with AI-powered automation. Check out the Kanaries website and RATH GitHub for more!
- If you encounter any issues and need support, join our Slack or Discord channels.
- Share pygwalker on these social media platforms:


