


Library for easy and nice (micro) benchmarking in Elixir. It allows you to compare the performance of different pieces of code at a glance. Benchee is also versatile and extensible, relying only on functions - no macros! There are also a bunch of plugins to draw pretty graphs and more!
Benchee runs each of your functions for a given amount of time after an initial warmup. It uses the raw run times it could gather in that time to show different statistical values like average, iterations per second and the standard deviation.
Benchee has a nice and concise main interface, and its behavior can be altered through lots of configuration options:
list = Enum.to_list(1..10_000)
map_fun = fn(i) -> [i, i * i] end

Benchee.run(%{
  "flat_map"    => fn -> Enum.flat_map(list, map_fun) end,
  "map.flatten" => fn -> list |> Enum.map(map_fun) |> List.flatten end
}, time: 10)
Produces the following output on the console:
tobi@speedy ~/github/benchee $ mix run samples/run.exs
Elixir 1.4.0
Erlang 19.1
Benchmark suite executing with the following configuration:
warmup: 2.0s
time: 10.0s
parallel: 1
inputs: none specified
Estimated total run time: 24.0s

Benchmarking flat_map...
Benchmarking map.flatten...

Name                  ips        average  deviation         median
flat_map           2.29 K      437.22 μs    ±17.32%         418 μs
map.flatten        1.28 K      778.50 μs    ±15.92%         767 μs

Comparison:
flat_map           2.29 K
map.flatten        1.28 K - 1.78x slower
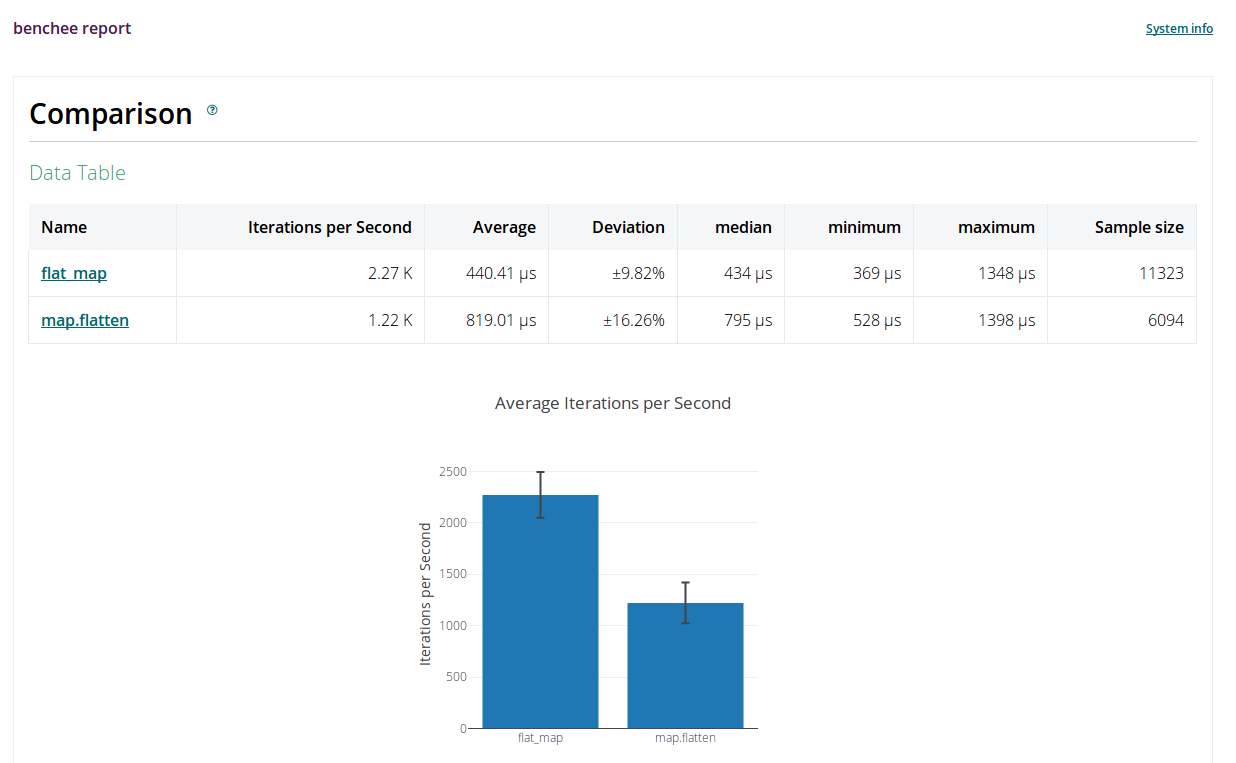
The aforementioned plugins like benchee_html make it possible to generate nice looking html reports, where individual graphs can also be exported as PNG images:
- first runs the functions for a given warmup time without recording the results, to simulate a "warm" running system
- plugin/extensible friendly architecture so you can use different formatters to generate CSV, HTML and more
- well tested
- well documented
- execute benchmark jobs in parallel to gather more results in the same time, or simulate a system under load
- nicely formatted console output with units scaled to appropriate units
- provides you with lots of statistics - check the next list
Provides you with the following statistical data:
- average - average execution time (the lower the better)
- ips - iterations per second, aka how often can the given function be executed within one second (the higher the better)
- deviation - standard deviation (how much do the results vary), given as a percentage of the average (raw absolute values also available)
- median - when all measured times are sorted, this is the middle value (or average of the two middle values when the number of samples is even). More stable than the average and somewhat more likely to be a typical value you see. (the lower the better)
Benchee does not:
- Keep results of previous runs and compare them (yet), if you want that have a look at benchfella or bmark until benchee gets that feature :)
Benchee only has a small runtime dependency on deep_merge for merging configuration and is aimed at being the core benchmarking logic. Further functionality is provided through plugins that then pull in dependencies, such as HTML generation and CSV export. Check out the available plugins!
Add benchee to your list of dependencies in mix.exs:
defp deps do
  [{:benchee, "~> 0.9", only: :dev}]
end
Install via mix deps.get and then happy benchmarking as described in Usage :)
After installing just write a little Elixir benchmarking script:
list = Enum.to_list(1..10_000)
map_fun = fn(i) -> [i, i * i] end

Benchee.run(%{
  "flat_map"    => fn -> Enum.flat_map(list, map_fun) end,
  "map.flatten" => fn -> list |> Enum.map(map_fun) |> List.flatten end
})
(names can also be specified as :atoms if you want to)
This produces the following output:
tobi@speedy ~/github/benchee $ mix run samples/run.exs
Elixir 1.4.0
Erlang 19.1
Benchmark suite executing with the following configuration:
warmup: 2.0s
time: 5.0s
parallel: 1
inputs: none specified
Estimated total run time: 14.0s

Benchmarking flat_map...
Benchmarking map.flatten...

Name                  ips        average  deviation         median
flat_map           2.28 K      438.07 μs    ±16.66%         419 μs
map.flatten        1.25 K      802.99 μs    ±13.40%         782 μs

Comparison:
flat_map           2.28 K
map.flatten        1.25 K - 1.83x slower
See Features for a description of the different statistical values and what they mean.
If you're looking to see how to make something specific work, please refer to the samples directory. Also, especially when wanting to extend benchee check out the hexdocs.
Benchee takes a wealth of configuration options, in the most common Benchee.run/2 interface these are passed as the second argument in the form of an optional keyword list:
Benchee.run(%{"some function" => fn -> magic end}, print: [benchmarking: false])The available options are the following (also documented in hexdocs).
warmup- the time in seconds for which a benchmarking job should be run without measuring times before real measurements start. This simulates a "warm" running system. Defaults to 2.time- the time in seconds for how long each individual benchmarking job should be run and measured. Defaults to 5.inputs- a map from descriptive input names to some different input, your benchmarking jobs will then be run with each of these inputs. For this to work your benchmarking function gets the current input passed in as an argument into the function. Defaults tonil, aka no input specified and functions are called without an argument. See Inputs.parallel- the function of each benchmarking job will be executed inparallelnumber processes. Ifparallel: 4then 4 processes will be spawned that all execute the same function for the given time. When these finish/the time is up 4 new processes will be spawned for the next job/function. This gives you more data in the same time, but also puts a load on the system interfering with benchmark results. For more on the pros and cons of parallel benchmarking check the wiki. Defaults to 1 (no parallel execution).formatters- list of formatter functions you'd like to run to output the benchmarking results of the suite when usingBenchee.run/2. Functions need to accept one argument (which is the benchmarking suite with all data) and then use that to produce output. Used for plugins. Defaults to the builtin console formatter callingBenchee.Formatters.Console.output/1. See Formatters.print- a map from atoms totrueorfalseto configure if the output identified by the atom will be printed during the standard Benchee benchmarking process. All options are enabled by default (true). Options are::benchmarking- print when Benchee starts benchmarking a new job (Benchmarking name ..):configuration- a summary of configured benchmarking options including estimated total run time is printed before benchmarking starts:fast_warning- warnings are displayed if functions are executed too fast leading to inaccurate measures
console- options for the built-in console formatter. Like theprintoptions they are also enabled by default::comparison- if the comparison of the different benchmarking jobs (x times slower than) is shown:unit_scaling- the strategy for choosing a unit for durations and counts. When scaling a value, Benchee finds the "best fit" unit (the largest unit for which the result is at least 1). For example, 1_200_000 scales to1.2 M, while800_000scales to800 K. Theunit_scalingstrategy determines how Benchee chooses the best fit unit for an entire list of values, when the individual values in the list may have different best fit units. There are four strategies, defaulting to:best::best- the most frequent best fit unit will be used, a tie will result in the larger unit being selected.:largest- the largest best fit unit will be used (i.e. thousand and seconds if values are large enough):smallest- the smallest best fit unit will be used (i.e. millisecond and one):none- no unit scaling will occur. Durations will be displayed in microseconds, and counts will be displayed in ones (this is equivalent to the behaviour Benchee had pre 0.5.0)
:inputs is a very useful configuration that allows you to run the same benchmarking jobs with different inputs. You specify the inputs as a map from name (String or atom) to the actual input value. Functions can have different performance characteristics on differently shaped inputs - be that structure or input size.
One of such cases is comparing tail-recursive and body-recursive implementations of map. More information in the repository with the benchmark and the blog post.
map_fun = fn(i) -> i + 1 end
inputs = %{
  "Small (1 Thousand)"    => Enum.to_list(1..1_000),
  "Middle (100 Thousand)" => Enum.to_list(1..100_000),
  "Big (10 Million)"      => Enum.to_list(1..10_000_000),
}

Benchee.run %{
  "map tail-recursive" =>
    fn(list) -> MyMap.map_tco(list, map_fun) end,
  "stdlib map" =>
    fn(list) -> Enum.map(list, map_fun) end,
  "map simple body-recursive" =>
    fn(list) -> MyMap.map_body(list, map_fun) end,
  "map tail-recursive different argument order" =>
    fn(list) -> MyMap.map_tco_arg_order(list, map_fun) end
}, time: 15, warmup: 5, inputs: inputs
This means each function will be benchmarked with each input that is specified in the inputs. Then you'll get the output divided by input so you can see which function is fastest for which input.
Therefore, I highly recommend using this feature and checking different realistically structured and sized inputs for the functions you benchmark!
Among all the configuration options, one that you probably want to use are the formatters. Formatters are functions that take one argument (the benchmarking suite with all its results) and then generate some output. You can specify multiple formatters to run for the benchmarking run.
So if you are using the HTML plugin and you want to run both the console formatter and the HTML formatter this looks like this (after you installed it of course):
list = Enum.to_list(1..10_000)
map_fun = fn(i) -> [i, i * i] end

Benchee.run(%{
  "flat_map"    => fn -> Enum.flat_map(list, map_fun) end,
  "map.flatten" => fn -> list |> Enum.map(map_fun) |> List.flatten end
},
  formatters: [
    &Benchee.Formatters.HTML.output/1,
    &Benchee.Formatters.Console.output/1
  ],
  formatter_options: [html: [file: "samples_output/my.html"]],
)If you want to do setup and teardown, i.e. do something before or after the benchmarking suite executes this is very easy in benchee. As benchee is just plain old functions just do it before/after you call benchee:
your_setup()

Benchee.run %{"Awesome stuff" => fn -> magic end }

your_teardown()It is important to note that the benchmarking code shown before is the convenience interface. The same benchmark in its more verbose form looks like this:
list = Enum.to_list(1..10_000)
map_fun = fn(i) -> [i, i * i] end

Benchee.init(time: 3)
|> Benchee.system
|> Benchee.benchmark("flat_map", fn -> Enum.flat_map(list, map_fun) end)
|> Benchee.benchmark("map.flatten",
                     fn -> list |> Enum.map(map_fun) |> List.flatten end)
|> Benchee.measure
|> Benchee.statistics
|> Benchee.Formatters.Console.output
This is a take on the functional transformation of data applied to benchmarks here:
- Configure the benchmarking suite to be run
- Gather System data
- Define the functions to be benchmarked
- Run n benchmarks with the given configuration gathering raw run times per function
- Generate statistics based on the raw run times
- Format the statistics in a suitable way
- Output the formatted statistics
This is also part of the official API and allows for more fine grained control. (It's also what benchee does internally when you use Benchee.run/2).
Do you just want to have all the raw run times? Just work with the result of Benchee.measure/1! Just want to have the calculated statistics and use your own formatting? Grab the result of Benchee.statistics/1! Or, maybe you want to write to a file or send an HTTP post to some online service? Just use the Benchee.Formatters.Console.format/1 and then send the result where you want.
This way Benchee should be flexible enough to suit your needs and be extended at will. Have a look at the available plugins.
There is an example project to check out.
You can use the rebar3_elixir_compile plugin. In your rebar.config you can do the following which should get you started:
deps, [
  {benchee, {elixir, "benchee", "0.9.0"}}
]}.

{plugins, [
    { rebar3_elixir_compile, ".*", {git, "https://github.com/barrel-db/rebar3_elixir_compile.git", {branch, "master"}}}
]}.

{provider_hooks, [
  {pre, [{compile, {ex, compile}}]},
  {pre, [{release, {ex, compile}}]}
]}.

{elixir_opts,
  [
    {env, dev}
  ]
}.
Then benchee already provides a :benchee interface for erlang compatibility which you can use. Sadly couldn't get it to work in an escript yet.
You can then invoke it like this (for instance):
tobi@comfy ~/github/benchee_erlang_try $ rebar3 shell
===> dependencies etc.
Erlang/OTP 18 [erts-7.3] [source] [64-bit] [smp:4:4] [async-threads:0] [hipe] [kernel-poll:false]

Eshell V7.3  (abort with ^G)
1> benchee:run(#{myFunc => fun() -> lists:sort([8, 2, 3, 4, 2, 1, 3, 4, 9, 10, 11, 12, 13, 20, 1000, -4, -5]) end}, [{warmup, 0}, {time, 2}]).
Operating System: Linux
CPU Information: Intel(R) Core(TM) i5-7200U CPU @ 2.50GHz
Number of Available Cores: 4
Available memory: 8.05 GB
Elixir 1.3.4
Erlang 18.3
Benchmark suite executing with the following configuration:
warmup: 0.0 μs
time: 2 s
parallel: 1
inputs: none specified
Estimated total run time: 2 s


Benchmarking myFunc...

Name             ips        average  deviation         median
myFunc      289.71 K        3.45 μs   ±250.31%           3 μs
This doesn't seem to be too reliable right now, so suggestions and input are very welcome :)
Packages that work with benchee to provide additional functionality.
- benchee_html - generate HTML including a data table and many different graphs with the possibility to export individual graphs as PNG :)
- benchee_csv - generate CSV from your Benchee benchmark results so you can import them into your favorite spreadsheet tool and make fancy graphs
- benchee_json - export suite results as JSON to feed anywhere or feed it to your JavaScript and make magic happen :)
With the HTML plugin for instance you can get fancy graphs like this boxplot:
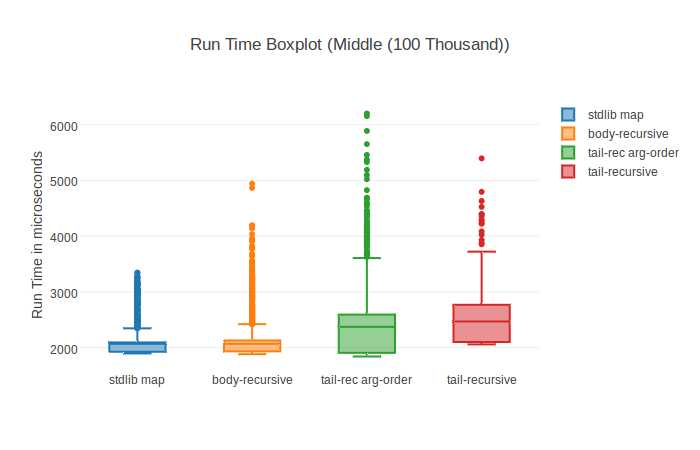
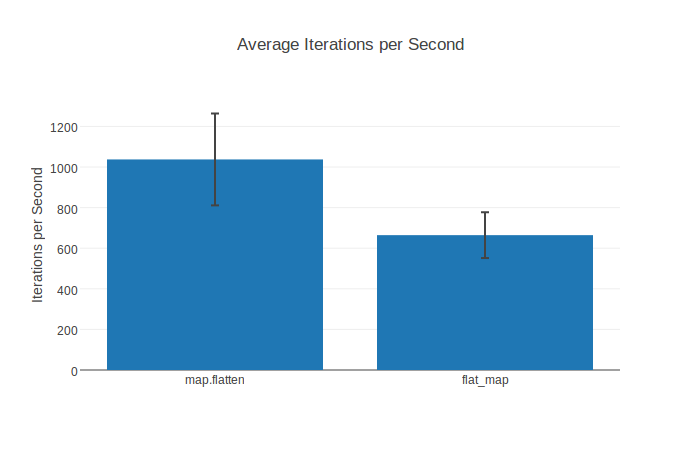
Of course there also are normal bar charts including standard deviation:
If you're into watching videos of conference talks and also want to learn more about benchmarking in general I can recommend watching my talk from ElixirLive 2016. Slides can be found here, video - click the washed out image below ;)
Contributions to benchee are very welcome! Bug reports, documentation, spelling corrections, whole features, feature ideas, bugfixes, new plugins, fancy graphics... all of those (and probably more) are much appreciated contributions!
Please respect the Code of Conduct.
You can get started with a look at the open issues.
A couple of (hopefully) helpful points:
- Feel free to ask for help and guidance on an issue/PR ("How can I implement this?", "How could I test this?", ...)
- Feel free to open early/not yet complete pull requests to get some early feedback
- When in doubt if something is a good idea open an issue first to discuss it
- In case I don't respond feel free to bump the issue/PR or ping me on other places
If you're on the elixir-lang slack also feel free to drop by in #benchee and say hi!
mix deps.getto install dependenciesmix testto run tests ormix test.watchto run them continuously while you change filesmix dialyzerto run dialyzer for type checking, might take a while on the first invocation (try building plts first withmix dialyzer --plt)mix credoormix credo --strictto find code style problems (not too strict with the 80 width limit for sample output in the docs)


