用户使用手册
首先看怎样配置和运行spy2servers.
- 下载
下载地址:
二进制程序http://www.blogjava.net/Files/xmatthew/spy2servers20080423.zip
第三方类库下载,第三方类库下载2 Jetty类库 放到lib目录下。
api-docs
源代码
下载后,把二进程序解压出来,再把第三方类库解压出来,放到lib目录下

用户使用手册部分
接下来配置spy2servers.xml文件 假如我们要配置一个acitvemq监控组件,一个tomcat监控组件,一个邮件报警通知组件和一个屏幕 报警输出组件。
下面是具体的配置文件(加注释)
<core-component> <!-- 配置核心组件,这个必须要有  -->
    <simple-alertRule> <!-- 配置 消息报警规则-->
        <channel> <!-- 从 ActiveMQJmxSpyComponent和TomcatJmxSpyComponent监控组件的消息都会流转到 PrintScreenAlertComponent-->
            <from value="ActiveMQJmxSpyComponent"/>
            <from value="TomcatJmxSpyComponent"/>
            <to value="PrintScreenAlertComponent"/>
        </channel>
        <channel><!-- 从 TomcatJmxSpyComponent监控组件的消息都会流转到 EmailAlertComponent-->
            <from value="TomcatJmxSpyComponent"/>
            <to value="EmailAlertComponent" />
        </channel>
    </simple-alertRule>
</core-component>

<jmxService-component /> <!-- 开启jmx监控服务,其IP通过 java启动命令设置 默认为1616 -->

<!-- 定义 PrintScreenAlertComponent组件-->
<beans:bean class="org.xmatthew.spy2servers.component.alert.PrintScreenAlertComponent">
    <beans:property name="name" value="PrintScreenAlertComponent"></beans:property>
</beans:bean>

<!--
    host 监控的Jmx服务IP port监控的Jmx服务端口 detectInterval监控时间间隔 单秒是 毫秒 默认值为5000
    queueSuspendNotifyTime 消息队列没有消息都监控的时候,超过这个时间开始报警
    name 组件名称,会被<simple-alertRule>使用
-->
<activeMQJmxSpy host="127.0.0.1" port="1099" queueSuspendNotifyTime="2000" name="ActiveMQJmxSpyComponent">
    <!-- 堆内存 监控方案 -->
    <!-- memoryUsedPercentToAlert 设置临界值 内存使用的百分比 使用的内存值 / 最大内存值。 注如果该值设置, memoryUsedToAlert自动失效-->
    <!-- alertAfterKeepTimeLive 设置临界值保持多久后,开始报警 单位秒。 注该值没有默认值,如果不认置则不会触发报警操作 -->
    <heapMemorySpy memoryUsedPercentToAlert="90" alertAfterKeepTimeLive="10"/>
    <!-- 非堆内存 监控方案 说明同上-->
    <noneHeapMemorySpy memoryUsedPercentToAlert="90" alertAfterKeepTimeLive="10"/>
    <!-- filesOpenedPercentToAlert 设置临界值 文件打开数百分比 开始的文件数 / 最大的文件数。  注如果该值设置, filesOpenedToAlert自动失效 -->
    <!-- alertAfterKeepTimeLive 设置临界值保持多久后,开始报警 单位秒。 注该值没有默认值,如果不认置则不会触发报警操作 -->
    <fileSpy filesOpenedPercentToAlert="90" alertAfterKeepTimeLive="10"/>
    <destinationNamesToWatch> <!-- 监控的消息队列,如果为空,表示监控当前的所有队列 -->
        <queue value="Test.Queue" />
        <queue value="aaa" />
    </destinationNamesToWatch>
    <llegalIps> <!-- 监控的连接的合法IP,如果为空,表示放弃监控 -->
        <ip value="127.0.0.1" />
        <ip value="192.168.0.1" />
    </llegalIps>
</activeMQJmxSpy>

<tomcatJmxSpy host="127.0.0.1" port="8060">
    <dataSourcesSpy> <!-- 数据源监控方案 可以设置多个-->
         <!-- numActivePercentToAlert 设置临界值 连接池连接数占用比例 使用的连接数 / 最大的连接数。  注如果该值设置, numActiveToAlert自动失效 -->
         <!-- dataSourceName 监控的数据连接名称 -->
        <dataSourceSpy numActivePercentToAlert="90" dataSourceName="jdbc/opendb" />
    </dataSourcesSpy>
    <webModuleSpy> <!-- Web Module 监控方案 -->
         <!-- 监控的web module列表,如果模块状态为stop或undeploy则会报触发报警 -->
        <module value="/" />
        <module value="/jsp-examples" />
    </webModuleSpy>
</tomcatJmxSpy>

<emailAlert>
    <emails> <!-- 配置邮件通知列表 允许设置多个-->
        <email value="[email protected]" />
    </emails> <!-- 设置邮件服务器配置信息 -->
    <emailAccount server="smtp.163.com" serverPort="25" loginName="xxxx"
        loginPwd="xxxx" sender="[email protected]" sendNick="EmailAlertComponent"/>
</emailAlert>
配置完成后,运行 spy2servers/bin目录。如果是windows平台,运行 start.bat,如果linux平台运行 start.sh 启动后,显示如下:
INFO  Main                           - Server starting
INFO  log                            - Logging to org.slf4j.impl.JCLLoggerAdapter(org.mortbay.log) via org.mortbay.log.Slf4jLog
INFO  CoreComponent                  - plug component CoreComponent
INFO  CoreComponent                  - plug component JmxServiceComponent
INFO  CoreComponent                  - plug component PrintScreenAlertComponent
INFO  CoreComponent                  - plug component ActiveMQJmxSpyComponent
INFO  CoreComponent                  - plug component TomcatJmxSpyComponent
INFO  CoreComponent                  - plug component EmailAlertComponent
INFO  log                            - jetty-6.1.4
INFO  log                            - Started [email protected]:7758
INFO  NetShutdownHandlerCommand      - Listening on port 8858
表示已经spy2servers已经启动成功
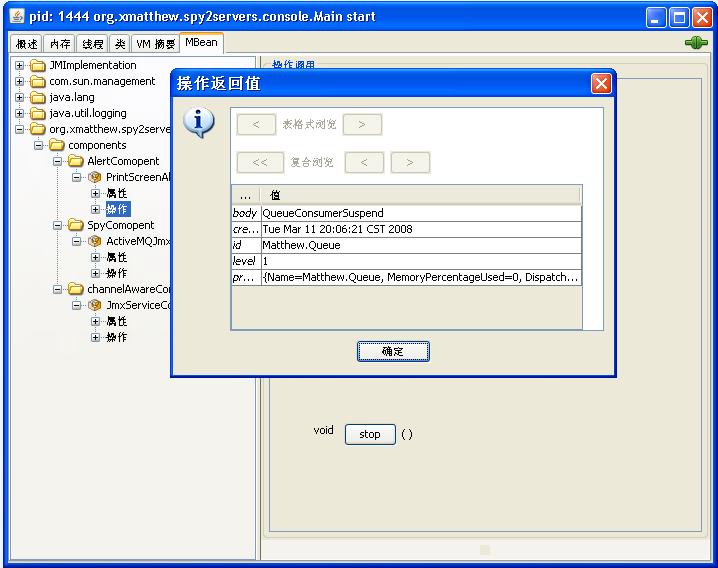
下面,我们可通过 jmx和web来查看运行情况
Jmx显示如下: