
Some scripts to analyze Git repos. Produces cool looking graphs like this (running it on git itself):
Run pip install git-of-theseus
First, you need to run git-of-theseus-analyze <path to repo> (see git-of-theseus-analyze --help for a bunch of config). This will analyze a repository and might take quite some time.
After that, you can generate plots! Some examples:
- Run
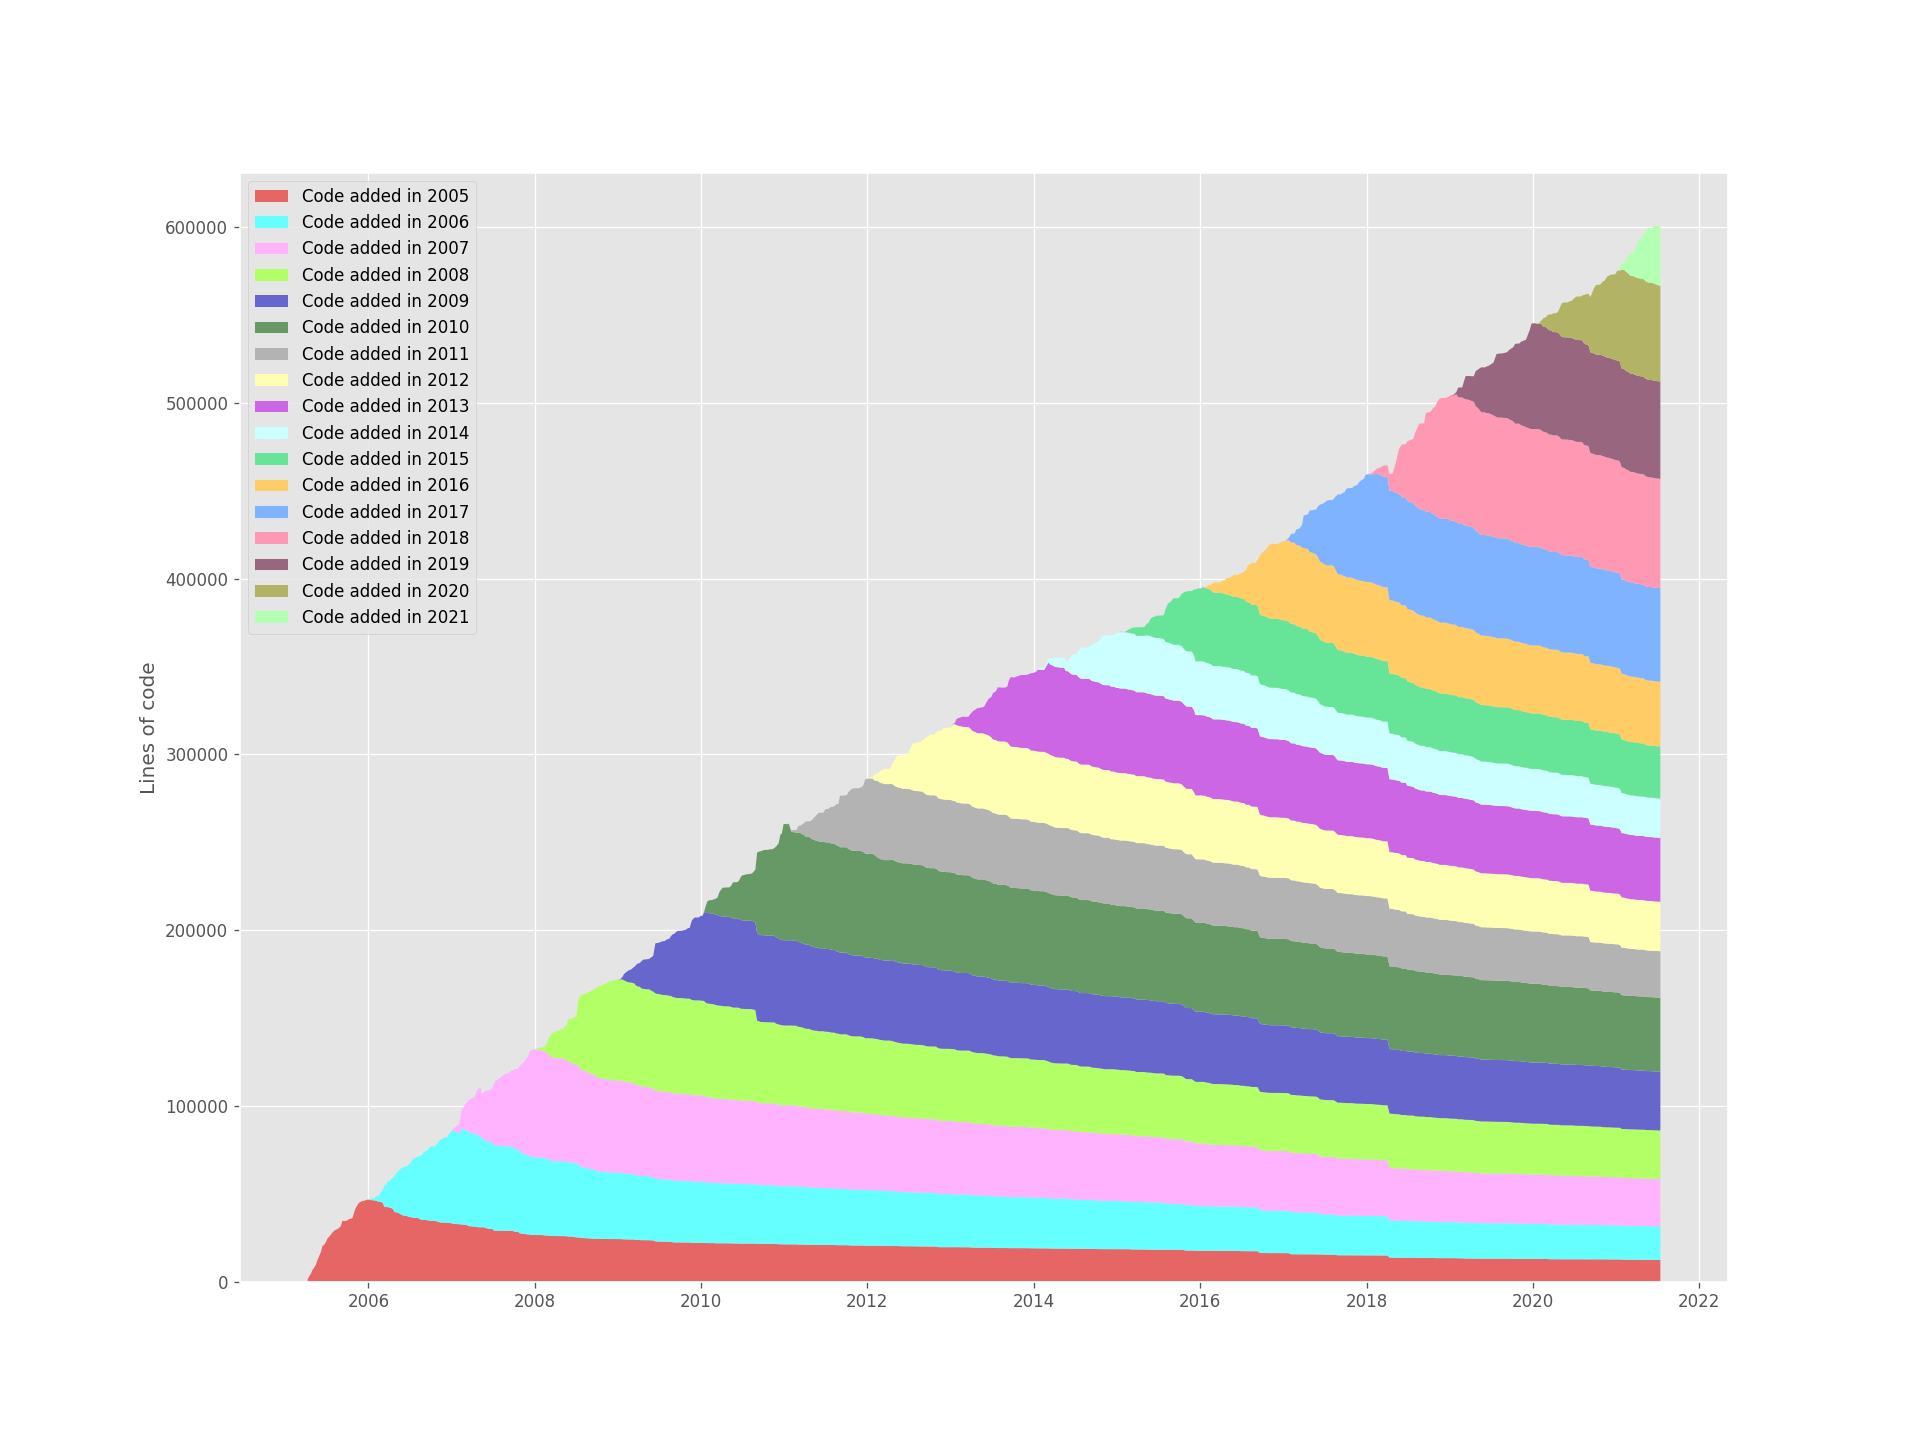
git-of-theseus-stack-plot cohorts.jsonwill create a stack plot showing the total amount of code broken down into cohorts (what year the code was added) - Run
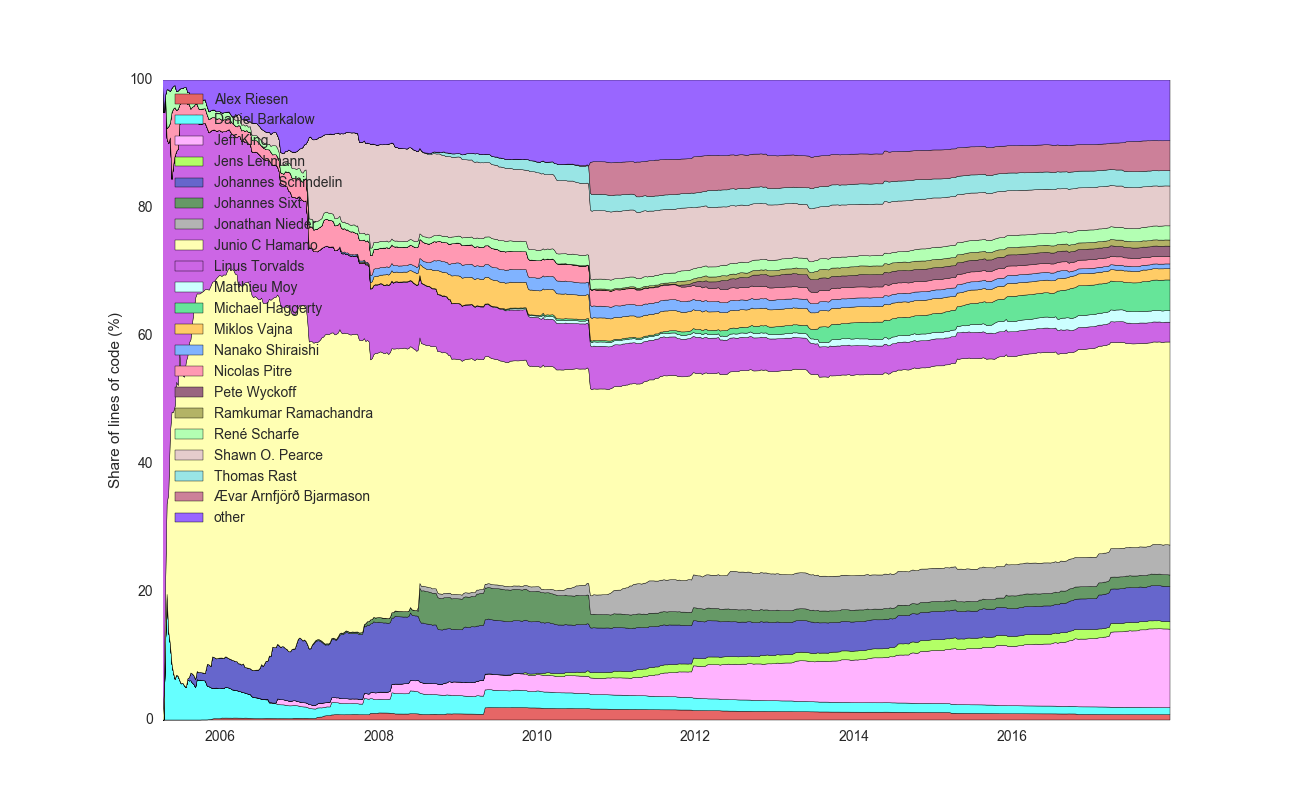
git-of-theseus-line-plot authors.json --normalizewill show a plot of the % of code contributed by the top 20 authors - Run
git-of-theseus-survival-plot survival.json
You can run --help to see various options.
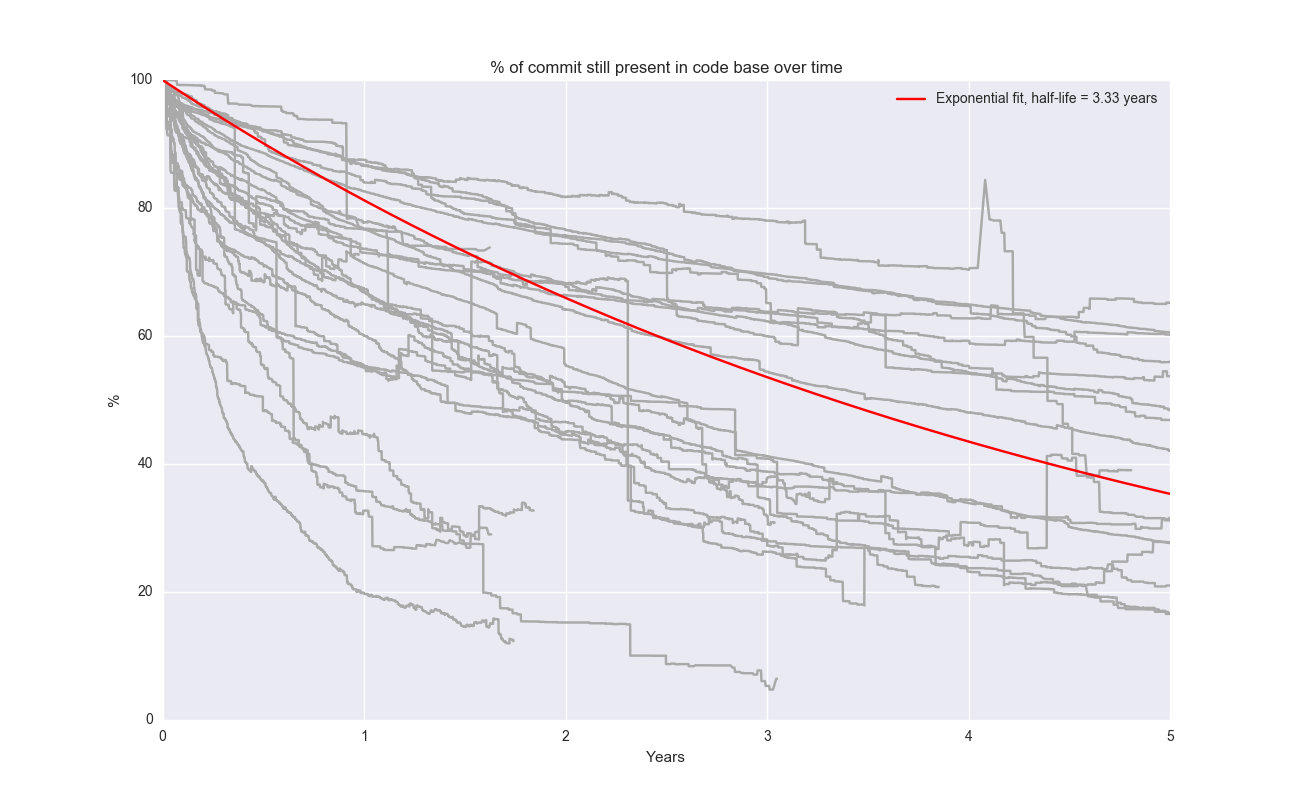
If you want to plot multiple repositories, have to run git-of-theseus-analyze separately for each project and store the data in separate directories using the --outdir flag. Then you can run git-of-theseus-survival-plot <foo/survival.json> <bar/survival.json> (optionally with the --exp-fit flag to fit an exponential decay)
AttributeError: Unknown property labels – upgrade matplotlib if you are seeing this. pip install matplotlib --upgrade
Survival of a line of code in a set of interesting repos:
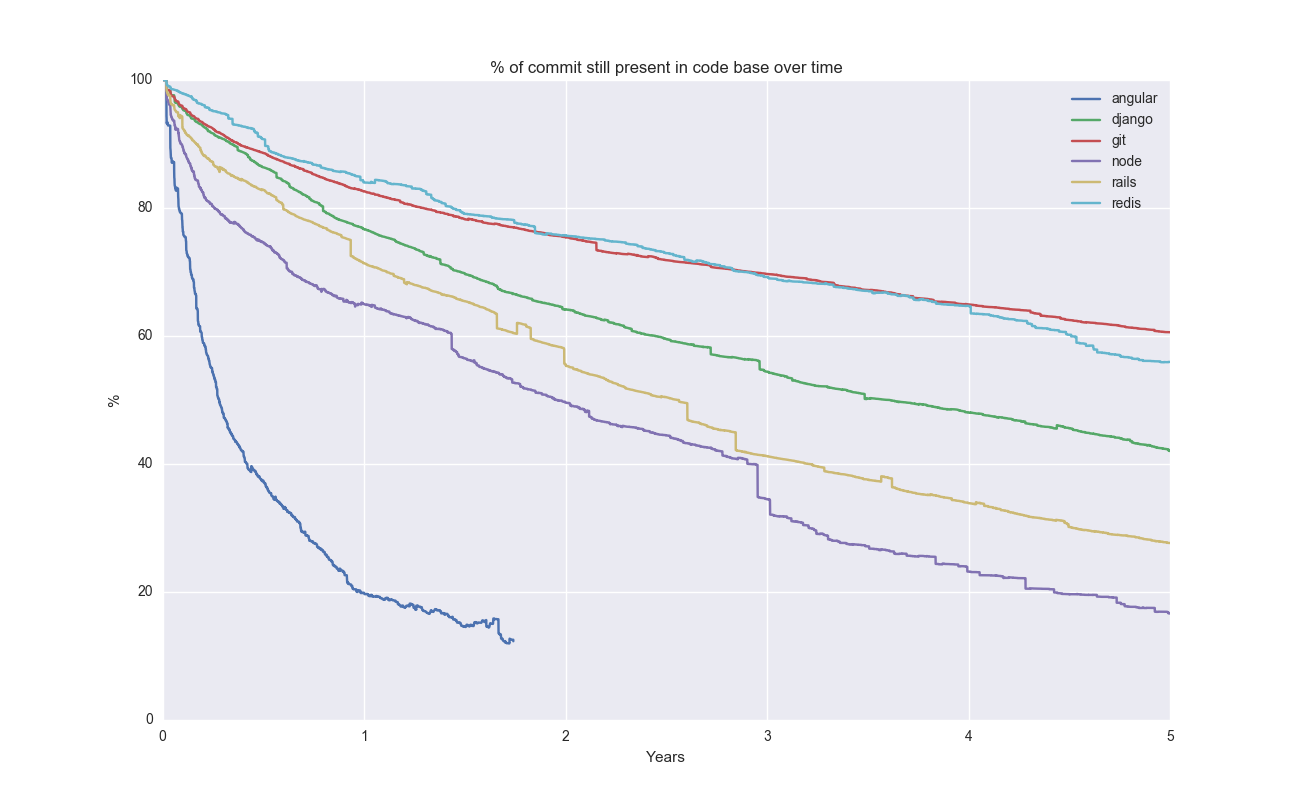
This curve is produced by the git-of-theseus-survival-plot script and shows the percentage of lines in a commit that are still present after x years. It aggregates it over all commits, no matter what point in time they were made. So for x=0 it includes all commits, whereas for x>0 not all commits are counted (because we would have to look into the future for some of them). The survival curves are estimated using Kaplan-Meier.
You can also add an exponential fit:
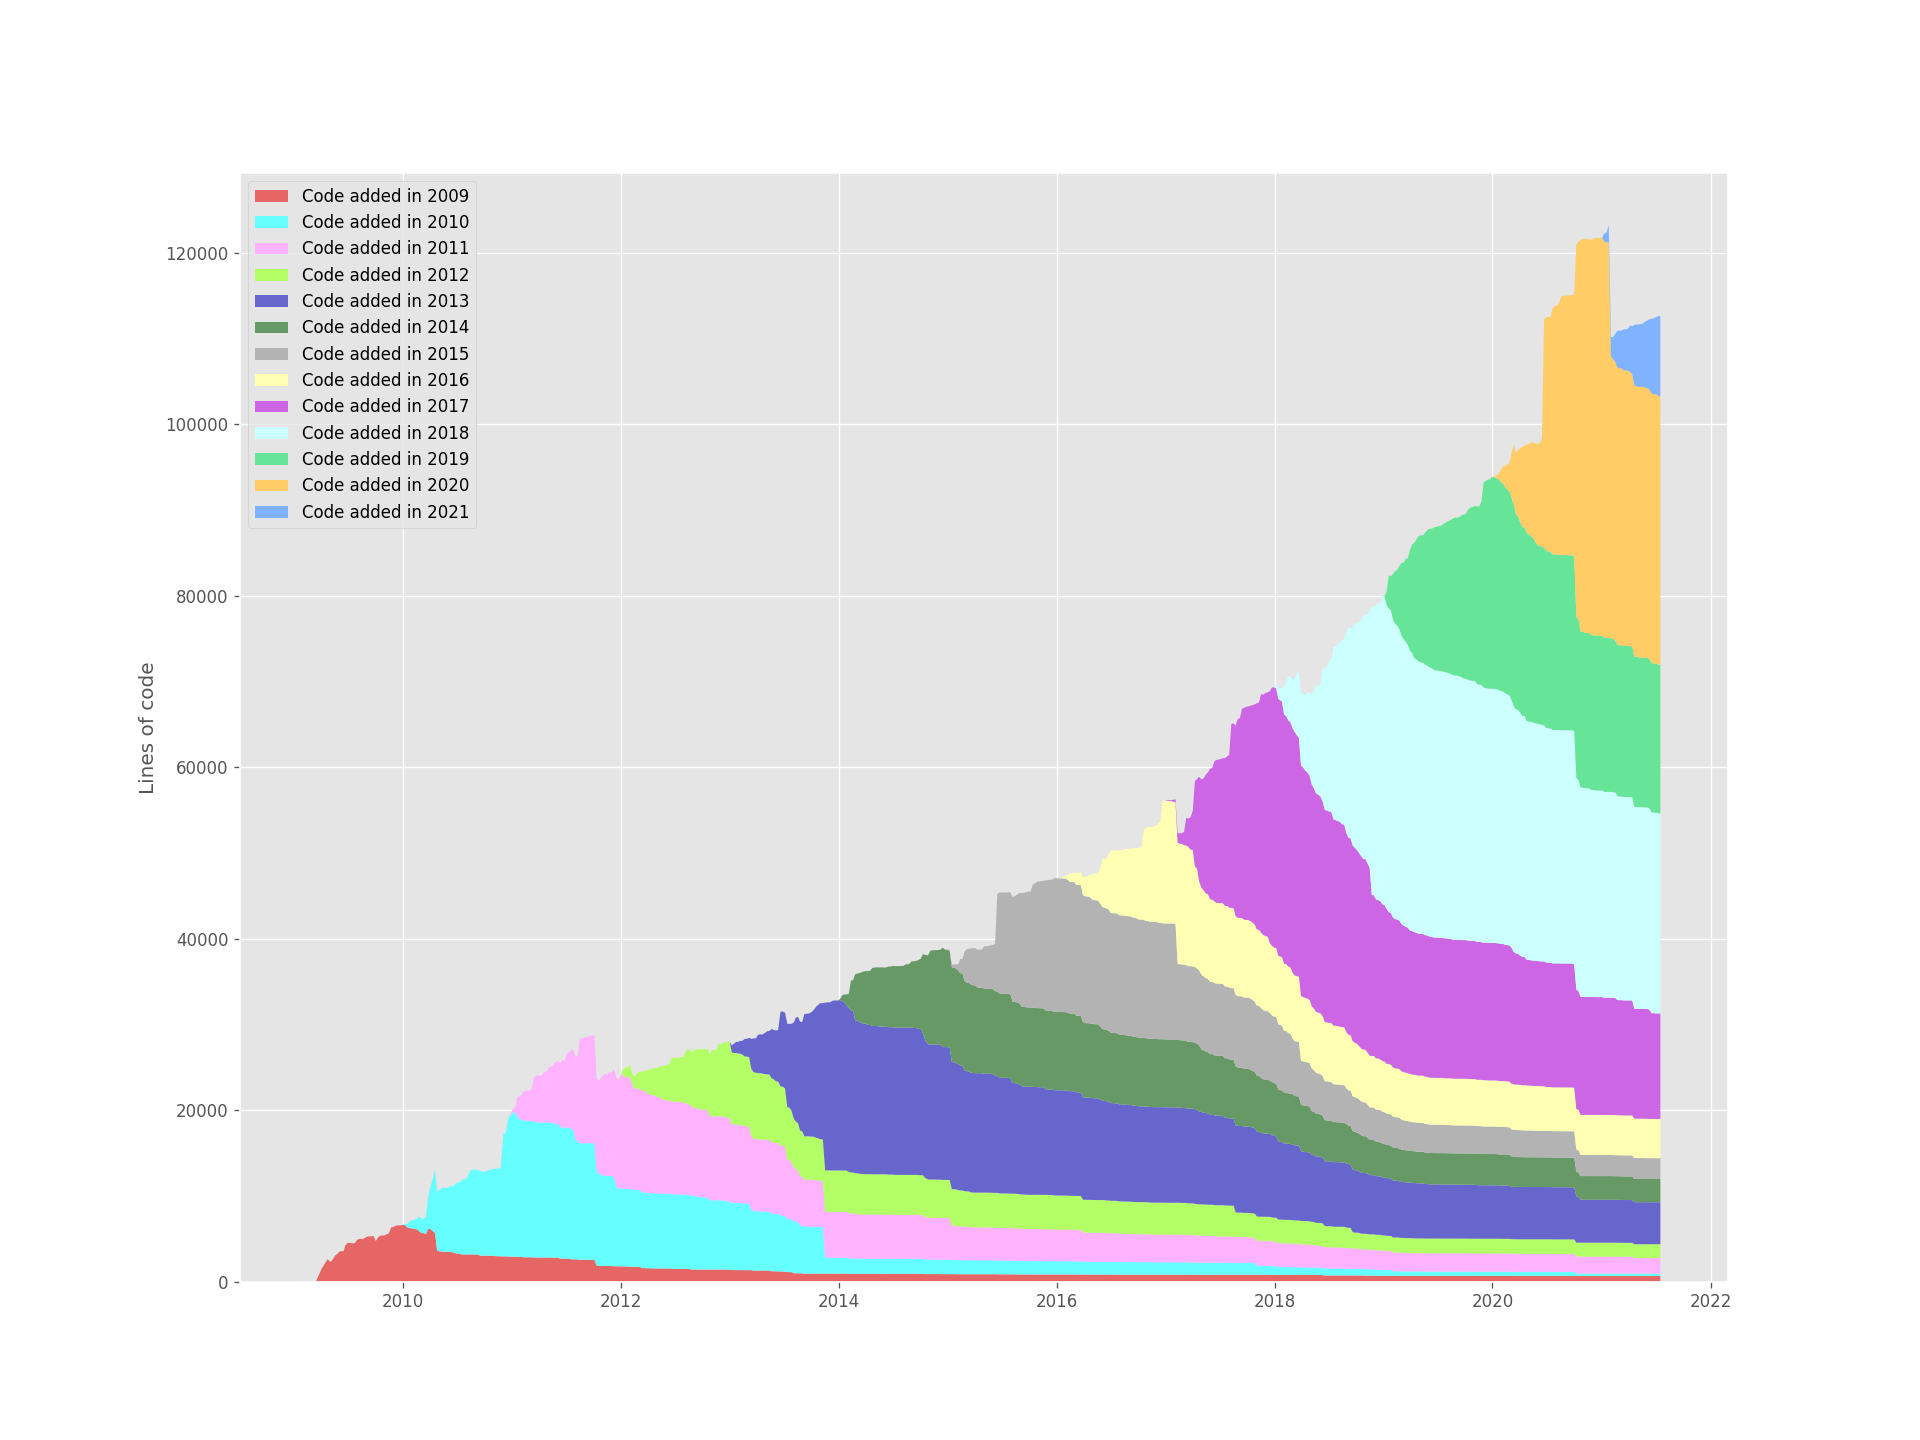
Linux – stack plot:
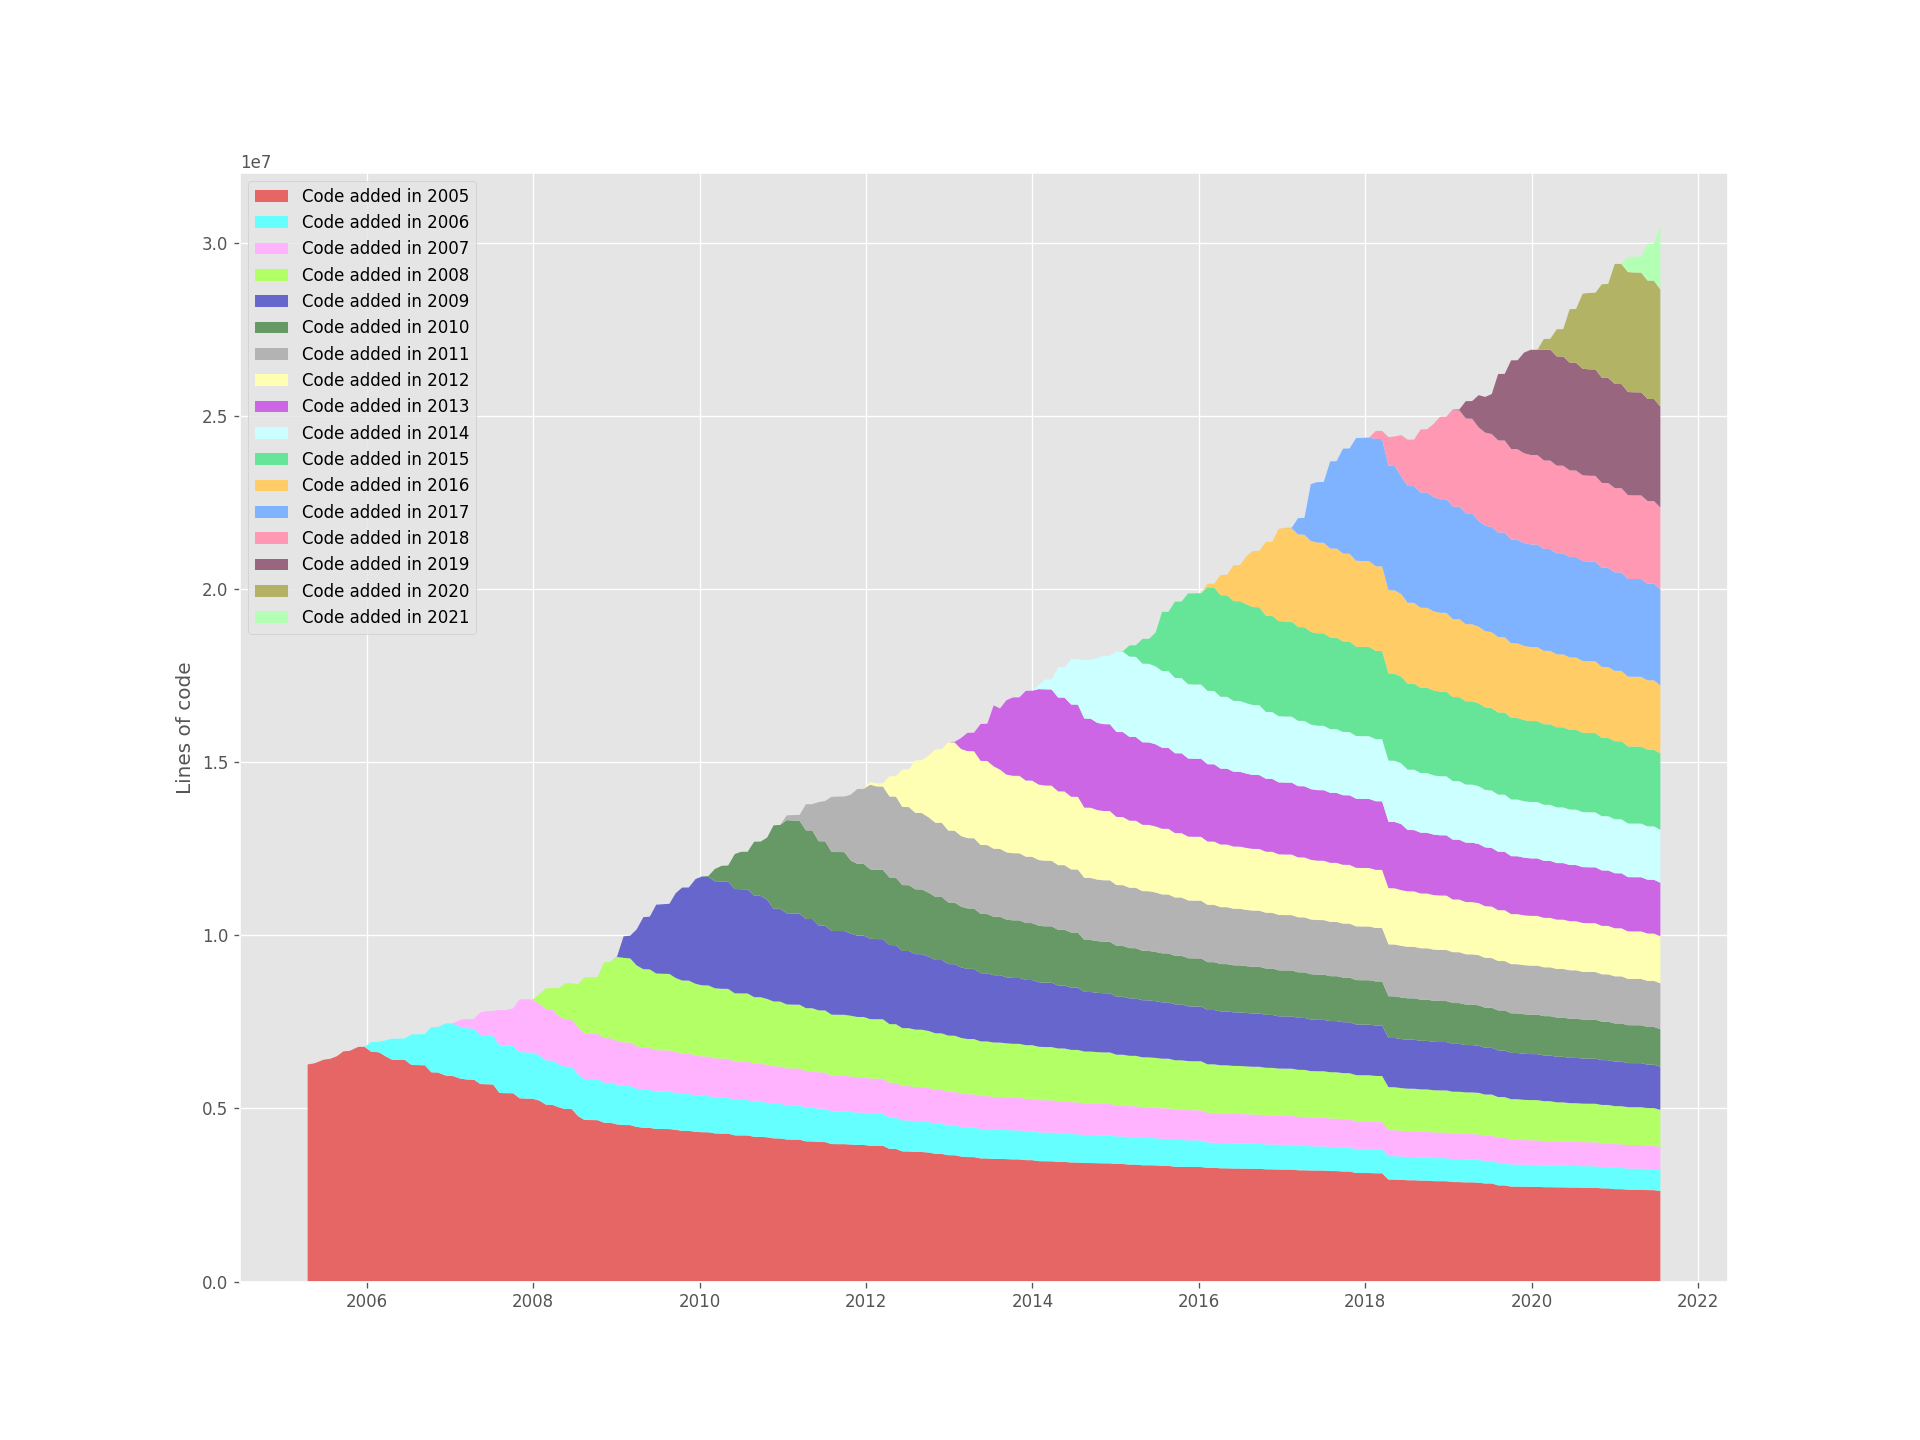
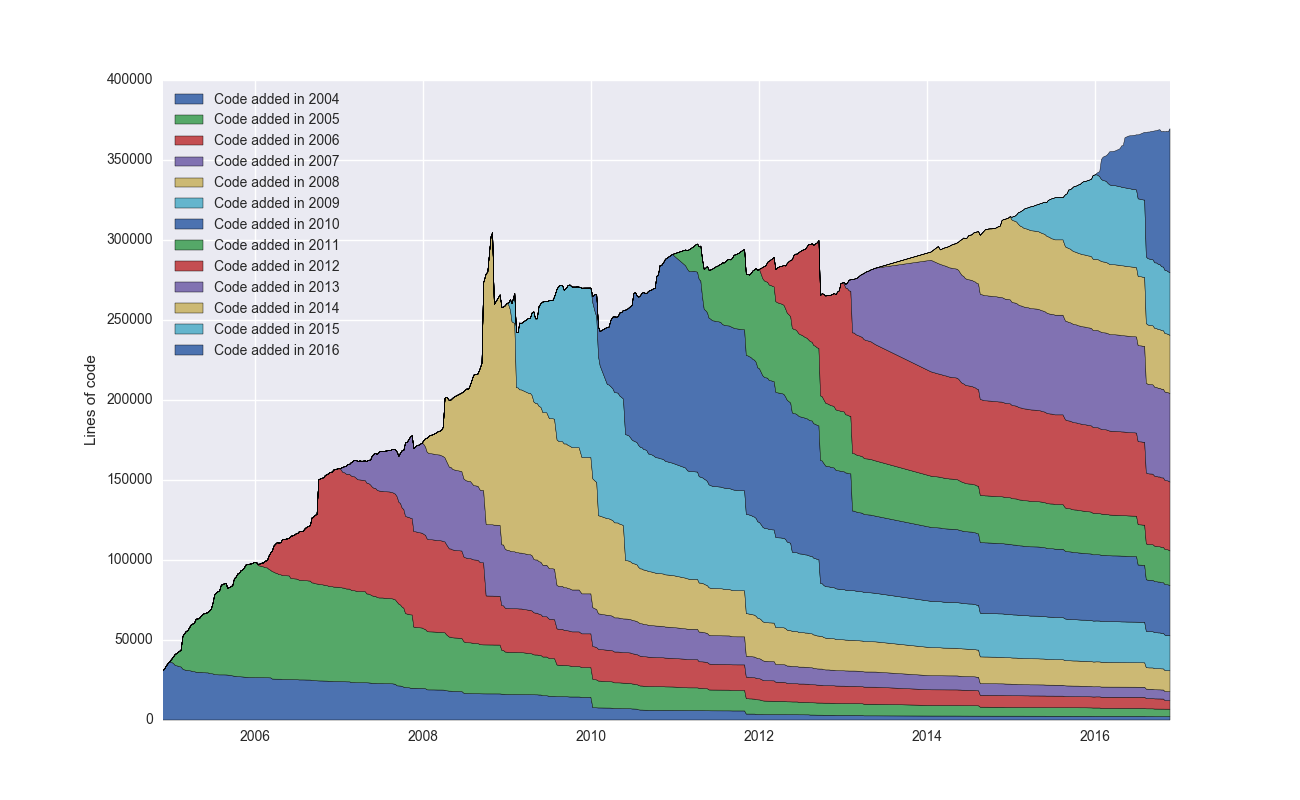
This curve is produced by the git-of-theseus-stack-plot script and shows the total number of lines in a repo broken down into cohorts by the year the code was added.
Node – stack plot:
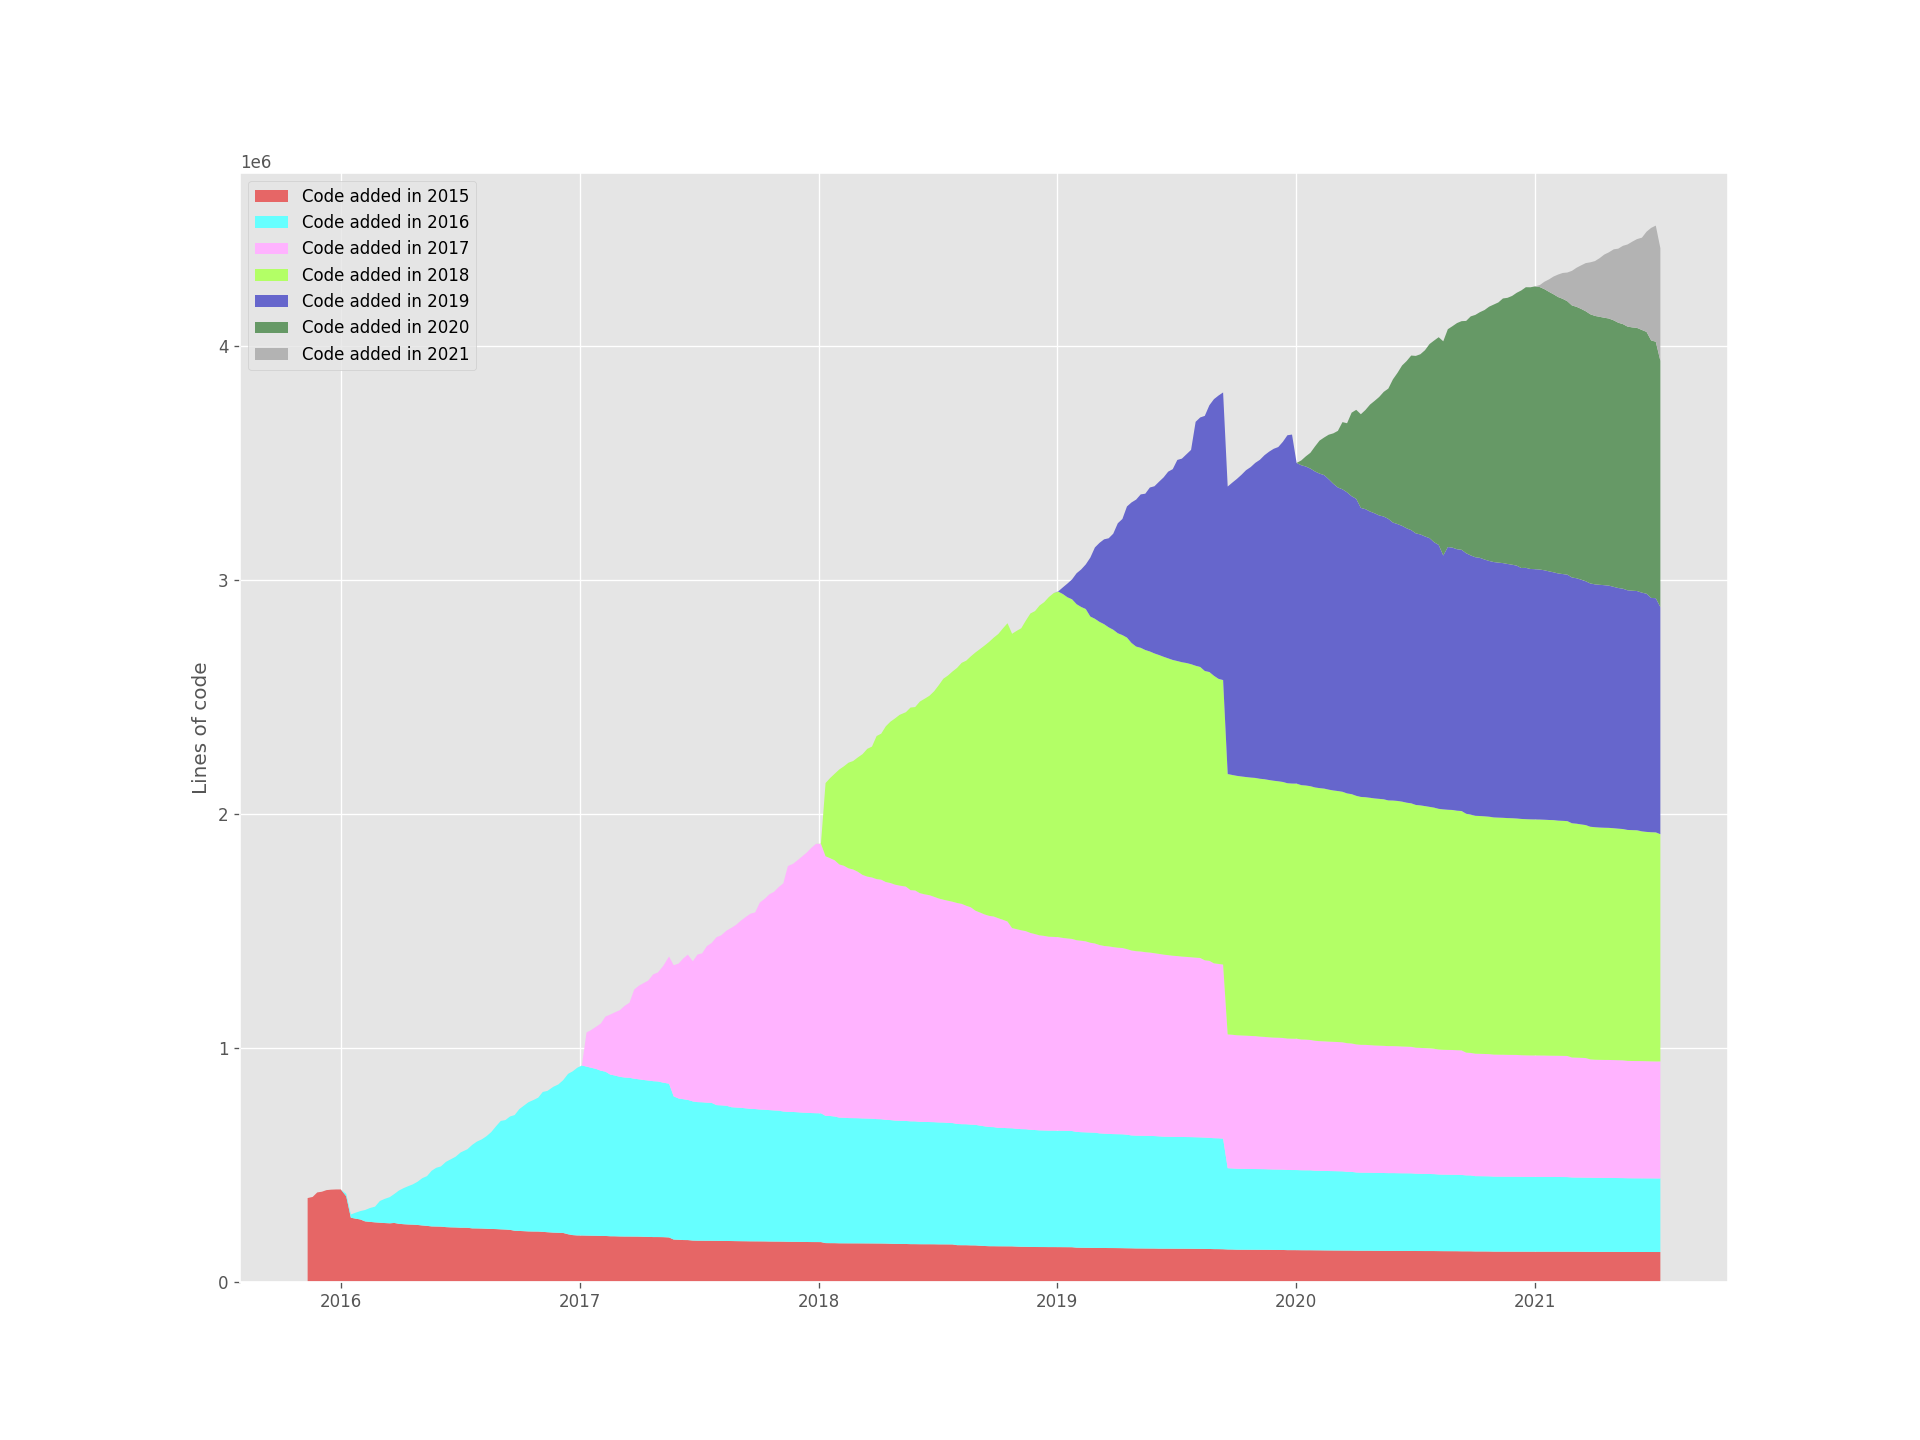
Rails – stack plot:
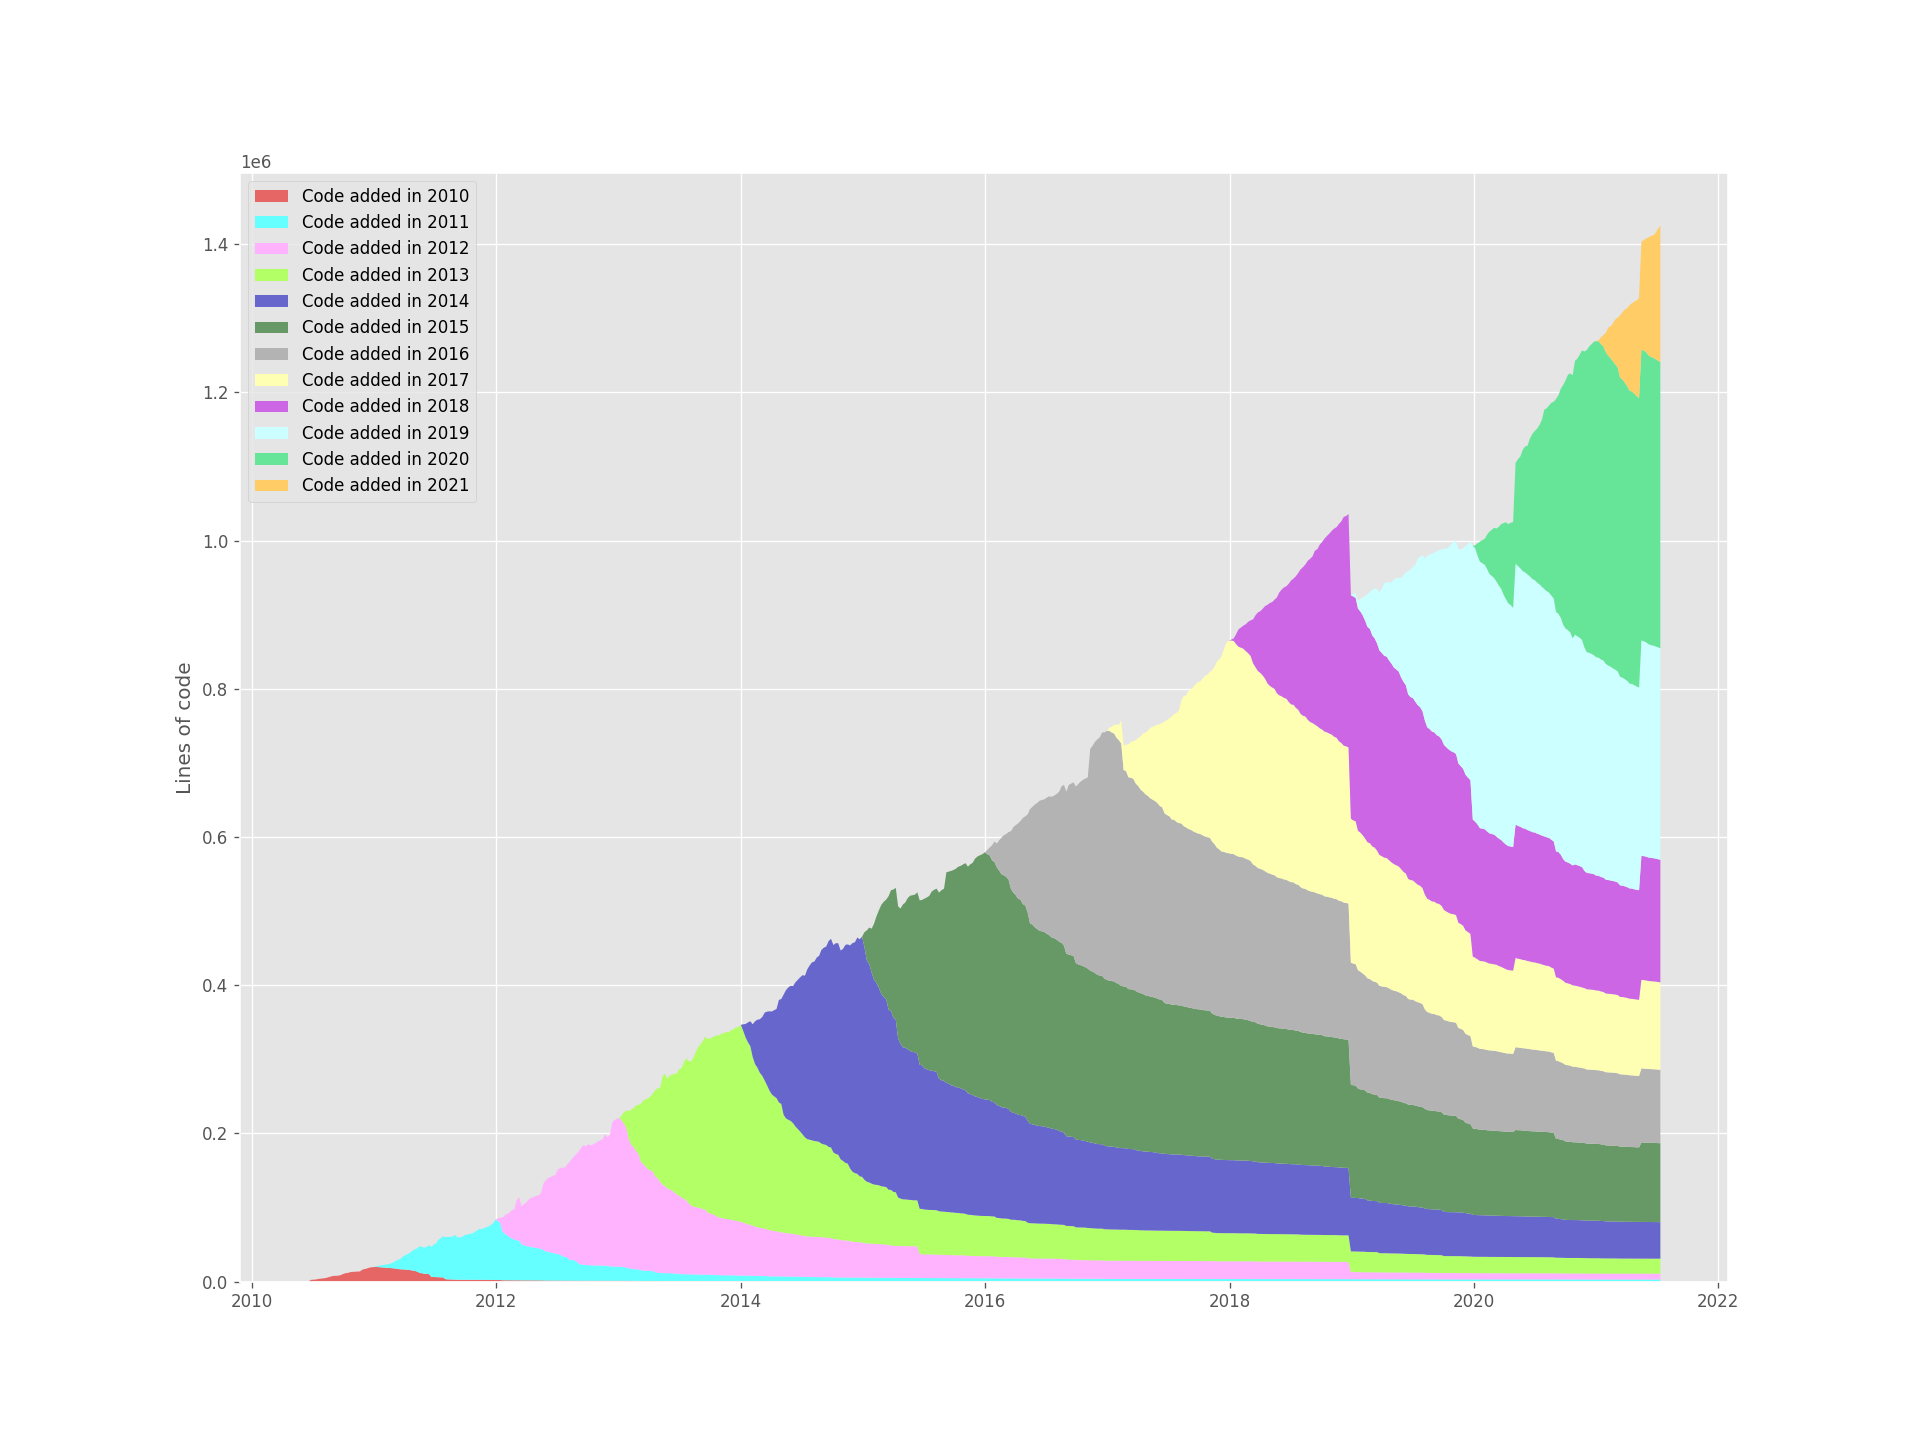
Tensorflow – stack plot:
Rust – stack plot:
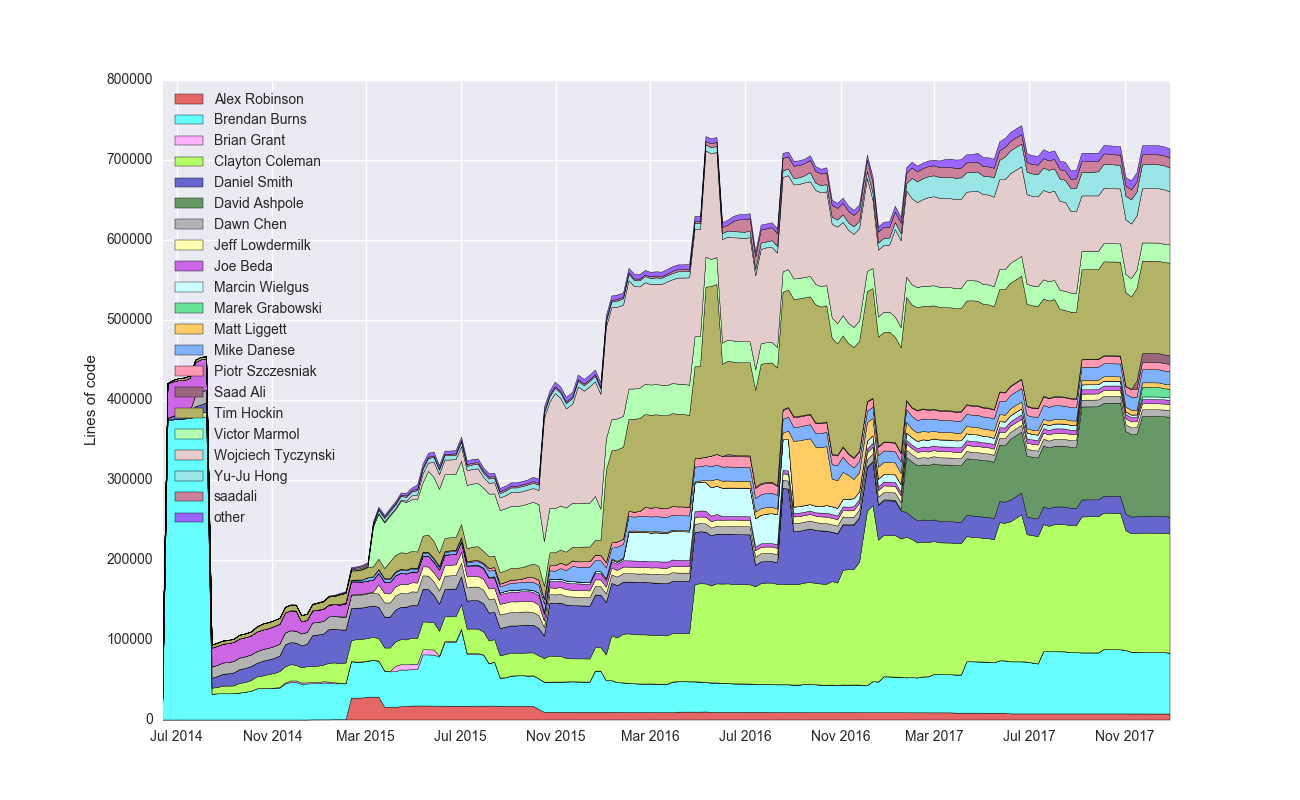
git-of-theseus-analyze will write exts.json, cohorts.json and authors.json. You can run git-of-theseus-stack-plot authors.json to plot author statistics as well, or git-of-theseus-stack-plot exts.json to plot file extension statistics. For author statistics, you might want to create a .mailmap file in the root directory of the repository to deduplicate authors. If you need to create a .mailmap file the following command can list the distinct author-email combinations in a repository:
Mac / Linux
git log --pretty=format:"%an %ae" | sort | uniqWindows Powershell
git log --pretty=format:"%an %ae" | Sort-Object | Select-Object -UniqueFor instance, here's the author statistics for Kubernetes:
You can also normalize it to 100%. Here's author statistics for Git:
Markovtsev Vadim implemented a very similar analysis that claims to be 20%-6x faster than Git of Theseus. It's named Hercules and there's a great blog post about all the complexity going into the analysis of Git history.


