Giter VIP home page Giter VIP logo

metrics.net.flotvisualization's Introduction

Metrics.NET.FlotVisualization

Build status Build Status NPM dependencies NPM devDependencies

JavaScript visualization app for Metrics.NET based on the excelent charting capabilities of FlotCharts

###What is it FlotVisualization is a web based, client side javascript application. It provides charts based on the data exposed by the Metrics.NET library.

This javascript application is embedded in the Metrics.NET core library as a html page in which external resources (css,js) have been embedded.

The app is built on top of angularjs and uses FlotCharts to render charts.

###How to build

FlotVisualization is developed with grunt & bower.

Steps to get started (after cloning the repo, and CDing in the root folder):

    npm install -g grunt-cli bower
    npm install
    bower install
    grunt serve
    grunt build

You also need to edit app\index.html to specify the path to the metrics endpoint:

    <script>window.metricsEndpoint = 'http://localhost:1234/json';</script>

###Sample

Sample Visualization

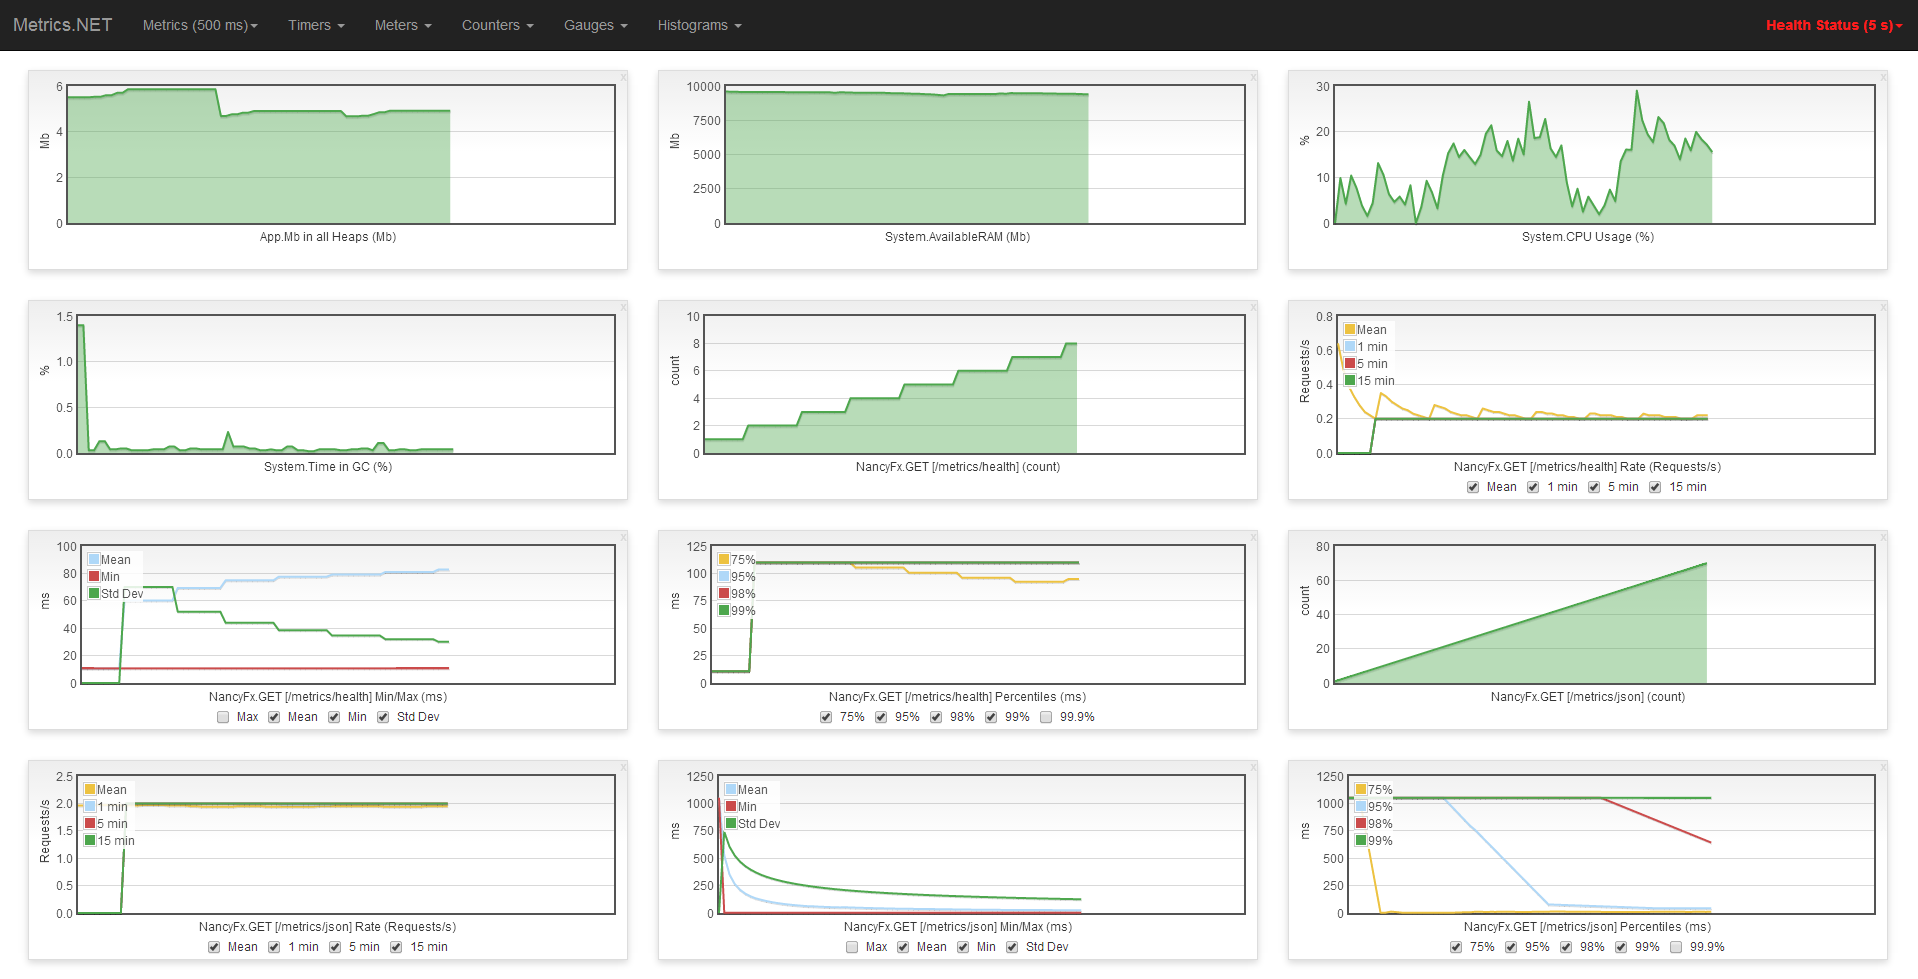
###License This application is released under Apache 2.0 License ( see LICENSE ) Copyright (c) 2014 Iulian Margarintescu

metrics.net.flotvisualization's People

Contributors

etishor avatar

Stargazers

 avatar  avatar  avatar Debashish Pal avatar Lukasz Wiechec avatar Timian avatar  avatar JL avatar P. L. Cancelleri avatar Taha İPEK avatar . avatar keeeepit avatar Lorenz Lo Sauer avatar Kris Johnson avatar eran avatar  avatar fengzhbo avatar Sergey Vlasov avatar  avatar Mehdi Khosravi avatar  avatar Ahamed Minhaj avatar  avatar Mehmet Can Kanpolat avatar Jack Liu Shurui avatar Antoine avatar Yevhenii Vitiuk avatar Thomas Stegemann avatar Victor Tomaili avatar  avatar gaurav patel avatar Chris McKee avatar Matias Ribichich avatar Chris Becker avatar Halid Cisse avatar John avatar Yuriy Gettya avatar Lars Outzen avatar Franz P. avatar Shi JIyong avatar catwen avatar  avatar Ganeshan Venkataraman avatar glj avatar Adriano Machado avatar Aleksandar Vidakovic avatar Mr. Hsu avatar Georg Kasper avatar Josh K avatar Graeme Wicksted avatar Rick Jones avatar  avatar MaxRiz avatar Arjen Smits avatar Yigang Zhang avatar Ronny Hanssen avatar  avatar Dejan Milicic avatar Andreas Niedermair avatar  avatar  avatar Rodrigo Muñoz avatar David Smith avatar  avatar Robert Ștefan Stănescu avatar aXen avatar  avatar Seemant Rajvanshi avatar Christian Krowiorsch avatar Kevin Tseng avatar Ron Richardson avatar send2vinnie avatar Matt Wagner avatar Thomas Freudenberg avatar Mark Liu avatar  avatar JIA LI avatar Neil Camilleri avatar Mathias Thierbach avatar Bobby Johnson avatar

Watchers

send2vinnie avatar oskark avatar  avatar James Cloos avatar

metrics.net.flotvisualization's Issues

Charts don't update in IE (10 and 11)

I experience a strange issue with IE 10 and 11.

When I open the visualization app in IE, the charts are loaded and displayed, but their values never update.

What's really strange is that as soon as I open F12 developer tools the charts get the current values from the Metrics.NET server. I also tested with Fiddler to see what requests are issued, and lo and behold, as long as F12 developer tools are closed, not a single request to the /json endpoint is issued after the initial requests to /, /json and /health during page load.

Could this be a caching issue?

Recommend Projects

  • React photo React

    A declarative, efficient, and flexible JavaScript library for building user interfaces.

  • Vue.js photo Vue.js

    🖖 Vue.js is a progressive, incrementally-adoptable JavaScript framework for building UI on the web.

  • Typescript photo Typescript

    TypeScript is a superset of JavaScript that compiles to clean JavaScript output.

  • TensorFlow photo TensorFlow

    An Open Source Machine Learning Framework for Everyone

  • Django photo Django

    The Web framework for perfectionists with deadlines.

  • D3 photo D3

    Bring data to life with SVG, Canvas and HTML. 📊📈🎉

Recommend Topics

  • javascript

    JavaScript (JS) is a lightweight interpreted programming language with first-class functions.

  • web

    Some thing interesting about web. New door for the world.

  • server

    A server is a program made to process requests and deliver data to clients.

  • Machine learning

    Machine learning is a way of modeling and interpreting data that allows a piece of software to respond intelligently.

  • Game

    Some thing interesting about game, make everyone happy.

Recommend Org

  • Facebook photo Facebook

    We are working to build community through open source technology. NB: members must have two-factor auth.

  • Microsoft photo Microsoft

    Open source projects and samples from Microsoft.

  • Google photo Google

    Google ❤️ Open Source for everyone.

  • D3 photo D3

    Data-Driven Documents codes.