Galaxy of Nuclides is an application for exploring the Elements, their Isotopes, and all known Nuclides interactively with d3. It is currently hosted at http://nuclides.org/.
Galaxy of Nuclides is designed to educate users about how atoms and the chemical elements work. Emphasis is on the atomic nucleus (protons and neutrons) and atomic decay (half-life).
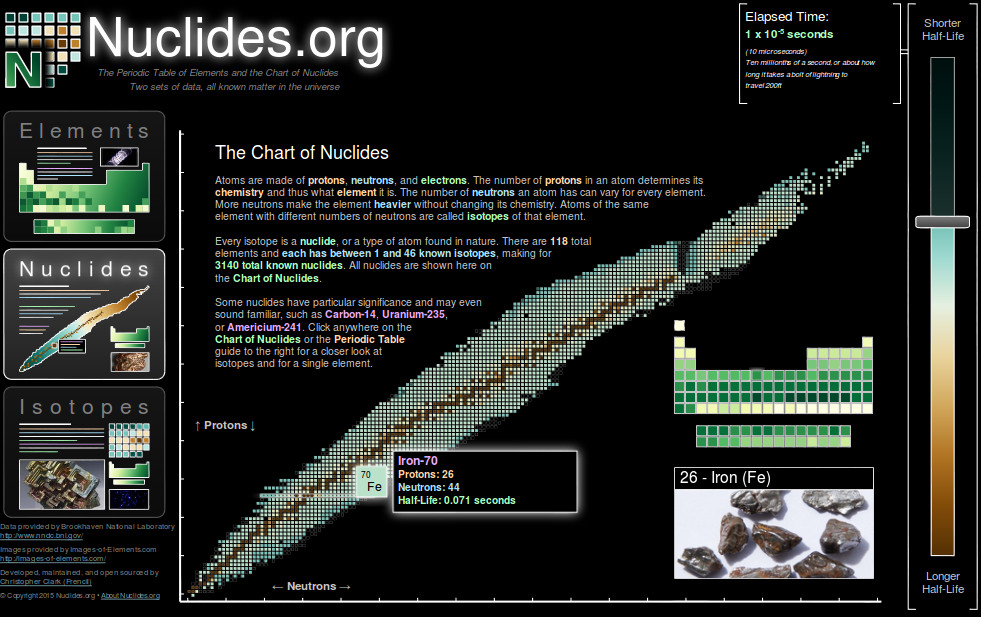
Animations and interactivity are used to illustrate the relationship between the Periodic Table of Elements and the Chart of Nuclides.
This application is not intended to be a comprehensive tool for researchers or industry. As an educational tool aimed at the broadest possible audience it should not explore advanced concepts of nuclear physics at the expense of simpler concepts.
For a more comprehensive tool more aimed at graduate-level students and researchers see the National Nuclear Data Center Chart of Nuclides.
Galaxy of Nuclides is an entirely client-side application (all JavaScript, HTML, and CSS). It has two notable third party dependencies: d3 and Modernizr. Both of these dependencies are hosted in this repository in assets/js/vendor.
The application is built using Gulp. Gulp and all necessary Gulp plug-ins can be installed for this project using npm and the following commands:
$ sudo npm install -g gulp
$ sudo npm install gulp gulp-util gulp-watch gulp-notify gulp-concat gulp-uglify --save-dev
Once complete run gulp or gulp js from the top of the application directory to build the two uglified javascript files: assets/js/vendor.min.js and assets/js/nuclides.min.js.
All documentation can be found in the docs drectory. Overview:
- Architecture - Overall composition of the application
- Contributing Info - Specifics on how to contribute info captions for elements that need them
Presently this is a solo project with more potential than resources. Please consider contributing!
The easiest way to materially contribute is to write an Element Info caption. These are the captions you see when looking at the isotopes for a single element. See Contributing Info for details on how to get started.
For other ways to contribute see Issues to either report bugs, propose enhancements, or take on an existing issue.
This project's origins are in the the 2011 tsunami that heavily damaged the Fukushima Daiichi nuclear plant in Japan. Reading about the cleanup effort I began to wonder: what is radioactive fallout? Like what elements, and what isotopes of those elements?
I knew what isotopes were from high school, and knew the names of some important ones like Carbon-14 and Uranium-238, but had never considered how many isotopes of all elements existed. I had no concept of what those workers in Japan were actually cleaning up. So I researched it, and learned about fissile materials. These are a plethora of various isotopes of relatively heavy elements that tend to be clustered in a couple regions on the Chart of Nuclides.
And then I saw the Chart of Nuclides for the first time. After some amazement at how huge it is relative the Periodic Table, I became a bit disappointed that I had never been exposed to it. Maybe it was always considered "too advanced" outside of college-level nuclear physics courses. I certainly didn't agree so sought to build a visualization to show the relationship between the familiar Period Table and the unfamiliar Chart of Nuclides.
An early prototype was developed in Processing. This language was chosen for its supposed adeptness at building data visualizations. Development with this technology culminated in 2013. Ultimately the application clearly needed to be web based and ultimately Processing was not a web-based language. The project stalled.
The original project in Processing is archived on the processing_archive branch.
Clearly the proper language for a web-based data visualization application, by this point, was JavaScript. But the framework remained an open question with many possible solutions. At one point a proof-of-concept was built in pure JavaScript/Canvas but easily capturing mouse events became a severely limiting factor. The project stalled again.
In late 2014, with fresh inspiration and some recent experience with the framework, d3 became the new potential solution. A proof of concept to load and format the data coalesced quickly, and the composition of the application being inspectable elements promised easy interactivity. Animations were straightforward.
The application finally had the right technology in place to flourish.
Please file bugs or propose new features on the Issues page.
General questions or feedback can directed to [email protected].
This repository is licensed under Creative Commons Attribution 4.0 International.
~