Giter VIP home page Giter VIP logo

mass_balance's People

Contributors

mankoff avatar

Stargazers

 avatar  avatar  avatar  avatar  avatar  avatar

Watchers

 avatar  avatar

Forkers

whigg davidripsen

mass_balance's Issues

Include peripheral glaciers

  • Need to update MMB to include peripherals
    • Need ice thickness - where from?
    • Have recent velocities (ITS_LIVE, not PROMICE Sentinel)
    • No historical velocities...
  • SMB from some of the RCMs
  • BMB ?

Treatment for peripheral glaciers (SMB & D)

The "D" product(s) (Mankoff, King, Mouginot) each have different coverage that may or may not include peripheral ice caps.

The SMB product does include peripheral ice caps

Some ROIs do include peripheral ice caps (Mouginot), others do not (Zwally).

See also #7.

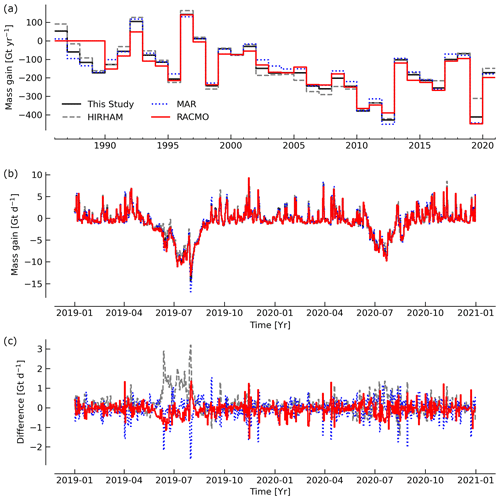
Multi-time-scale initial figure

Rather than two-panel all-time and 1-exemplar year, make the initial time series figure multi-scale:

  • Last month
  • Last year
  • Last decade
  • Everything prior to that

Lag term for negative SMB and BMB

Postive SMB (snowfall) is instantaneous.

Negative SMB and BMB should have a lag term.

lag = f(latitude, elevation, temperature, day of year, SMB history)

Greenland mass flow Sankey diagram

A future version of this paper should include a graphic like this. The numbers here are approximate and some are just guesses/placeholders. Ideally each number should have a reference. It is unlikely the equation will balance, and there should be losses (and gains?) to/from 'uncertainty'.

image

Code
import numpy as np
import pandas as pd
import plotly.graph_objects as go
import plotly.express as px

df = pd.DataFrame(columns=['value','source','target','meta'])
df.index.name = 'label'

df.loc['rain:freeze'] = [50/2, 'rain', 'GL', 'A2019']  # Alexander 2019
df.loc['snow:fall'] = [750, 'snow fall', 'GL', 'A2019'] # fudge from A2019
df.loc['DEFICIT'] = [160, 'DEFICIT', 'GL', '']
df.loc['condensation'] = [10, 'condensation', 'GL', 'guess']
df.loc['drifting_out'] = [100, 'GL', 'drift', 'guess']
df.loc['drifting_in'] = [100
                         , 'drift', 'GL', 'guess']

df.loc['rain:runoff'] = [50/2, 'rain', 'runoff', 'A2019']
df.loc['rain:runoff:liquid'] = [50/2, 'runoff', 'liquid', 'A2019']

df.loc['SMB (loss)'] = [400, 'GL', 'SMB (loss)', 'A2019']
df.loc['dynamics'] = [500, 'GL', 'dynamics', '']

df.loc['icebergs'] = [250, 'dynamics', 'icebergs', 'M2020 & E2014'] # Enderlin & Mankoff
df.loc['frontal melt'] = [250, 'dynamics', 'frontal melt', 'E2014']

df.loc['runoff'] = [400, 'SMB (loss)','runoff', '']
df.loc['refreeze'] = [250, 'GL','refreeze', '']
df.loc['refreeze1'] = [250, 'refreeze','GL', '']
# df.loc['runoff'] = [400, 'melt','runoff', '']

#df.loc['basal melt'] = [25, 'basal melt', 'liquid', 'K2020'] # Karlsson
df.loc['basal melt'] = [25, 'GL', 'basal melt', 'K2020'] # Karlsson
df.loc['basal melt1'] = [25, 'basal melt', 'runoff', 'K2020'] # Karlsson
df.loc['basal melt2'] = [25, 'runoff', 'liquid', 'K2020'] # Karlsson
# df.loc['basal melt2'] = [50, 'runoff', 'liquid', 'K2020']

df.loc['evaporation'] = [10, 'GL', 'evaporation', '']
df.loc['sublimation'] = [10, 'GL', 'sublimation', '']

# Sum all the liquid terms to a liquid budget (solid is just 'iceberg')
for i,v in enumerate(['runoff','frontal melt']):
    df.loc[f'liquid_{v}'] = [df.loc[v]['value'], v, 'liquid', '']

    
# QC Check
for s in df['source'].unique():
    if s in df['target'].unique():
        sv = df[df['source'] == s]['value'].sum()
        tv = df[df['target'] == s]['value'].sum()
        if( sv != tv ):
            print(f"Error: {s} inputs != outputs [{sv} != {tv}]")

            
# # Add numeric values in parentheses
for t in np.unique(df['source'].values.astype(str)):
    v = (df[df["source"] == t]["value"].sum()).round().astype(int).astype(str)
    df = df.replace(to_replace=t, value=f'{t} ({v})')

for t in np.unique(df['target'].values.astype(str)):
    if t[-1] == ')': continue
    v = (df[df["target"] == t]["value"].sum()).round().astype(int).astype(str)
    df = df.replace(to_replace=t, value=f'{t} ({v})')

# print(df)

## Plotly
# uniqify columns: Convert strings to numbers. Sequential. Across columns
keys = np.unique(df[['source','target']].values.flatten().astype(str))
df = df.replace(to_replace=keys, value=np.arange(len(keys)))

fig = go.Figure(go.Sankey(
    arrangement = "snap",
    node = {
        "label": keys,
        'color': "#666666",
        'pad':10},  # 10 Pixels
    link = {
        "source": df['source'].values,
        "target": df['target'].values,
        # "color": "#DDDDDD",
        "value": df['value'].values}))

# fig.show()
fig.write_image("plotly.png")
# interactive HTML: drag to re-arrange and clean up, then screenshot.
fig.write_html("plotly.html")

See also LaTeX examples for more control: https://us.mirrors.cicku.me/ctan/graphics/pgf/contrib/sankey/sankey.pdf

Sectors & regions disagree when summed.

Exhibits in v90 (and earlier).

wget 'https://dataverse01.geus.dk/api/access/datafile/:persistentId?persistentId=doi:10.22008/FK2/OHI23Z/LOC1JC' -O ~/tmp/MB_region.nc
wget 'https://dataverse01.geus.dk/api/access/datafile/:persistentId?persistentId=doi:10.22008/FK2/OHI23Z/ZRDZLS' -O ~/tmp/MB_sector.nc
import xarray as xr
r = xr.open_dataset('~/tmp/MB_region.nc')
s = xr.open_dataset('~/tmp/MB_sector.nc')

# print('Scale of raw data: ', r.sum(dim='region').sum())

print('\n\nDiff:')
print((r.sum(dim='region') - s.sum(dim='sector')).sum())
Diff:
<xarray.Dataset>
Dimensions:      ()
Data variables:
    MB           float32 0.0
    MB_err       float32 0.0
    MB_ROI       float32 -41.11
    MB_ROI_err   float32 -85.06
    SMB          float32 0.0
    SMB_err      float32 0.0
    SMB_ROI      float32 -2.582e-05
    SMB_ROI_err  float32 -2.526e-06
    D            float32 0.0
    D_err        float32 0.0
    D_ROI        float32 0.000224
    D_ROI_err    float32 -2.205e-06
    BMB          float32 0.0
    BMB_err      float32 0.0
    BMB_ROI      float32 9.164e-07
    BMB_ROI_err  float32 -3.067
    MB_HIRHAM    float32 -223.3
    MB_MAR       float32 116.8
    MB_RACMO     float32 -6.387

SMB uncertainty is >> 9 % (Table 3)

This study SMB uncertainty is reported in Table 3 as "9 %: Average of 15 % SMB uncertainties above, assuming uncorrelated.". However, that 9 % was leftover from when SMB uncertainties were originally assumed to be 5 %, not 15 %.

import uncertainties
from uncertainties import unumpy
err = unumpy.uarray([1,1,1], [5,5,5])
print('{:.4f}'.format(err.sum()))
>  3.0000+/-8.6603

When using 15 % uncertainties, the average error increases to 26 %.

err = unumpy.uarray([1,1,1], [15,15,15])
print('{:.4f}'.format(err.sum()))
>  3.0000+/-25.9808

SMB uncertainty is not fixed at 9 %

SMB uncertainty is 9 % when taking the mean of three RCMs each with 15 % uncertainty.

unumpy.uarray([1,1,1], [15,15,15]).mean()
> 1.0+/-8.660254037844387

But when there are only two RCMs, uncertainty grows to 11 %:

unumpy.uarray([1,1], [15,15]).mean()
> 1.0+/-10.606601717798213

And the full 15 % when only using 1 RCM.

Near Realtime (NRT)

Realtime means:

  • HIRHAM SMB download each day
  • MAR SMB download each day
  • Run code to partition new SMB by ROI
  • Velocity (D input) update every 12 days
  • Run code to estimate D when velocity updates
  • Combine D and SMB to estimate NRT each day
  • Push daily update to Dataverse

Recommend Projects

  • React photo React

    A declarative, efficient, and flexible JavaScript library for building user interfaces.

  • Vue.js photo Vue.js

    ๐Ÿ–– Vue.js is a progressive, incrementally-adoptable JavaScript framework for building UI on the web.

  • Typescript photo Typescript

    TypeScript is a superset of JavaScript that compiles to clean JavaScript output.

  • TensorFlow photo TensorFlow

    An Open Source Machine Learning Framework for Everyone

  • Django photo Django

    The Web framework for perfectionists with deadlines.

  • D3 photo D3

    Bring data to life with SVG, Canvas and HTML. ๐Ÿ“Š๐Ÿ“ˆ๐ŸŽ‰

Recommend Topics

  • javascript

    JavaScript (JS) is a lightweight interpreted programming language with first-class functions.

  • web

    Some thing interesting about web. New door for the world.

  • server

    A server is a program made to process requests and deliver data to clients.

  • Machine learning

    Machine learning is a way of modeling and interpreting data that allows a piece of software to respond intelligently.

  • Game

    Some thing interesting about game, make everyone happy.

Recommend Org

  • Facebook photo Facebook

    We are working to build community through open source technology. NB: members must have two-factor auth.

  • Microsoft photo Microsoft

    Open source projects and samples from Microsoft.

  • Google photo Google

    Google โค๏ธ Open Source for everyone.

  • D3 photo D3

    Data-Driven Documents codes.