This chart library renders various kinds of charts using svg / canvas / webgl.
This library only uses a library called glmatrix, for fast matrix calculation.
You can copy the bundle.js in the dist folder to your own repository. Here are some samples of how to use the library.
A live demo can be found here: https://githubsheng.github.io/WSChart/Chart.html
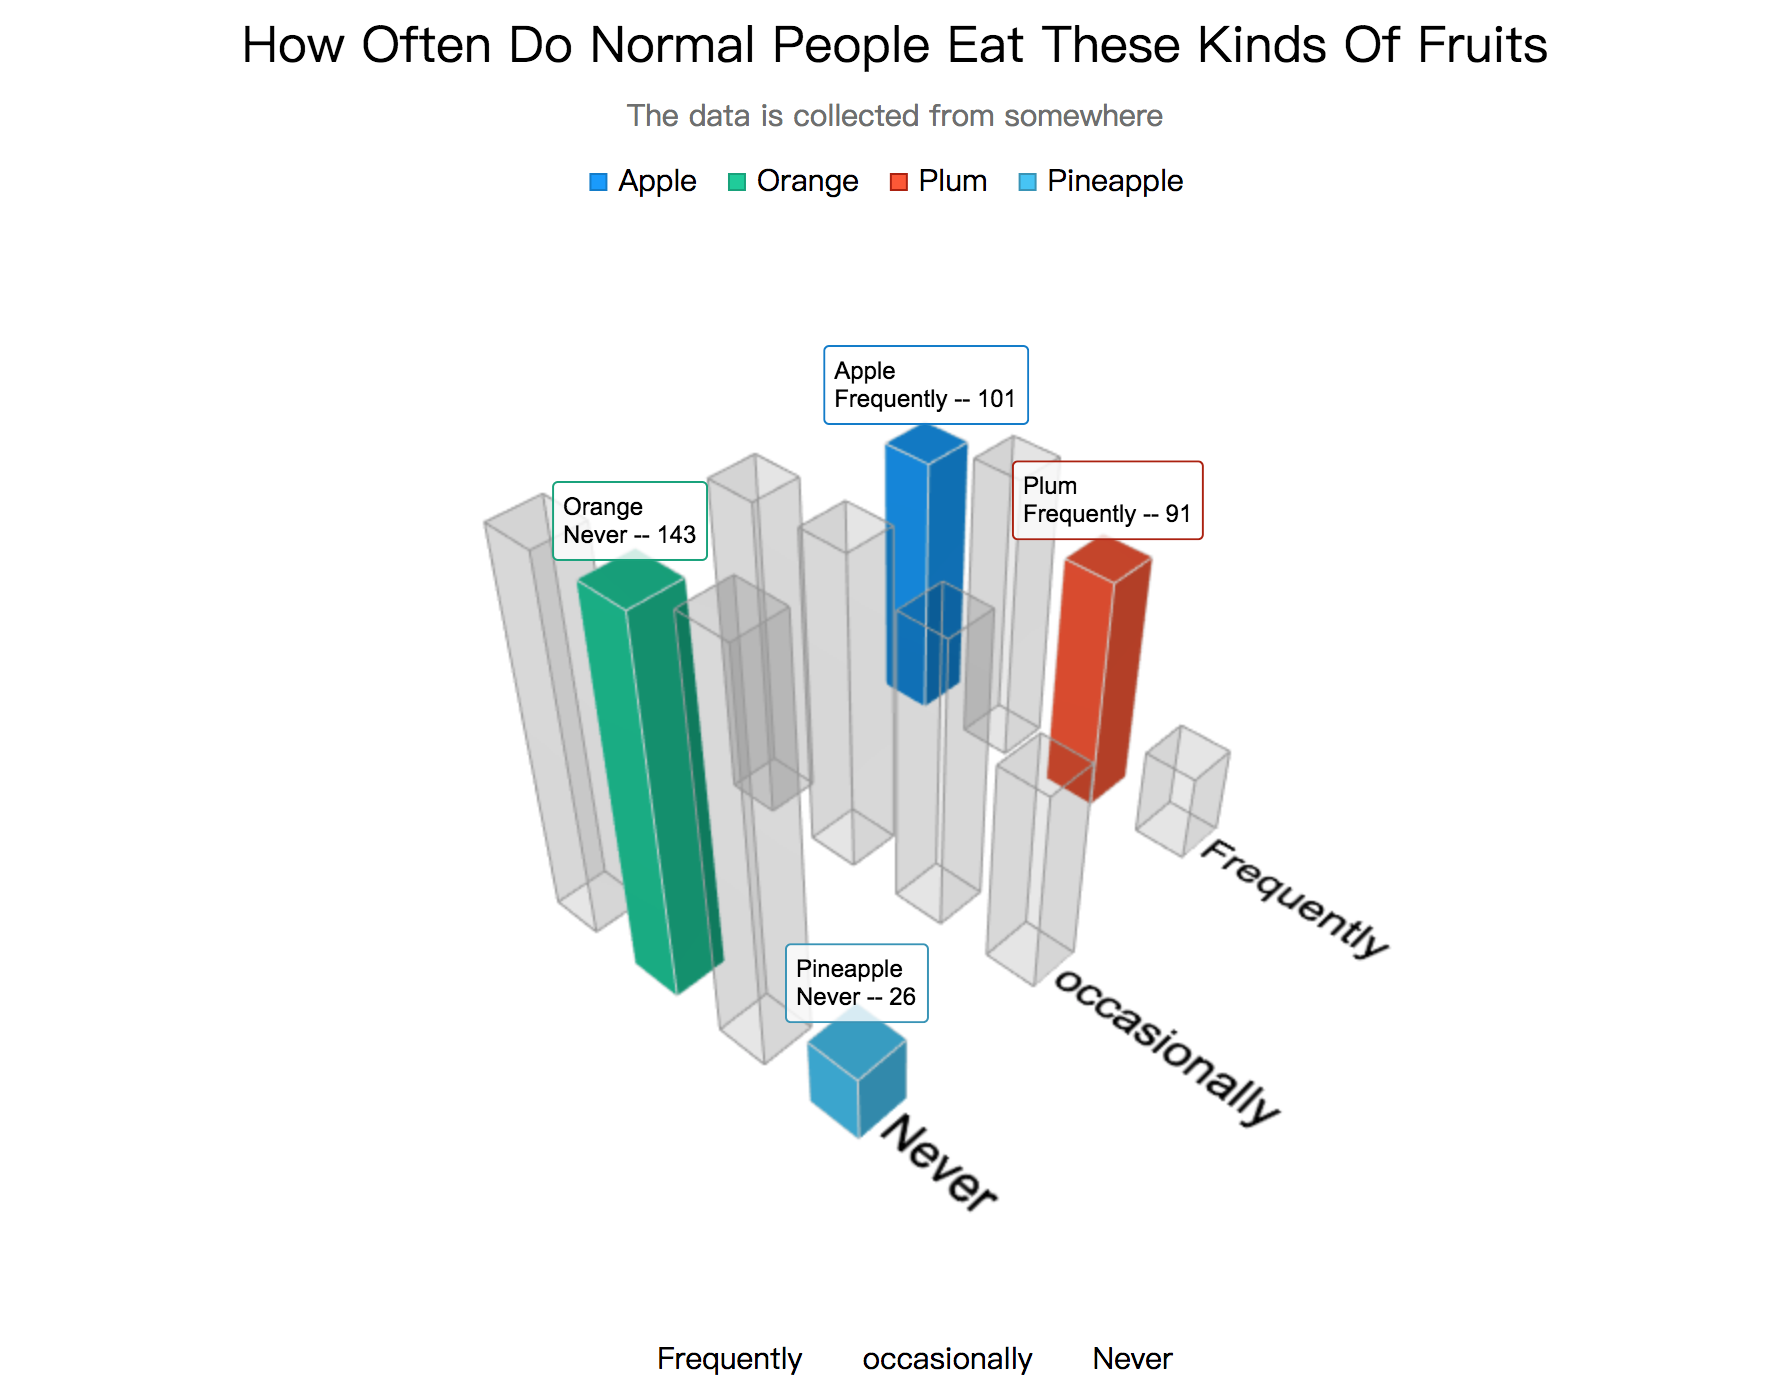
let input = {
    series : {
        rows : [ "Apple", "Orange", "Plum", "Pineapple"],
        columns : [ "Frequently", "occasionally", "Never" ],
        data : [[101, 122, 143], [111, 122, 143], [91, 112, 153], [34, 78, 26]],
        focus: [[0, 0], [2, 0], [3, 2], [1, 2]]
    },
    rowLegend: "top",
    columnLegend: "bottom",
    mainTitle: "How Often Do Normal People Eat These Kinds Of Fruits",
    subTitle: "The data is collected from somewhere",
    startAngle : -0.6283185307179586
};

weaver.weave("3dGrid", input, document.getElementById("container"));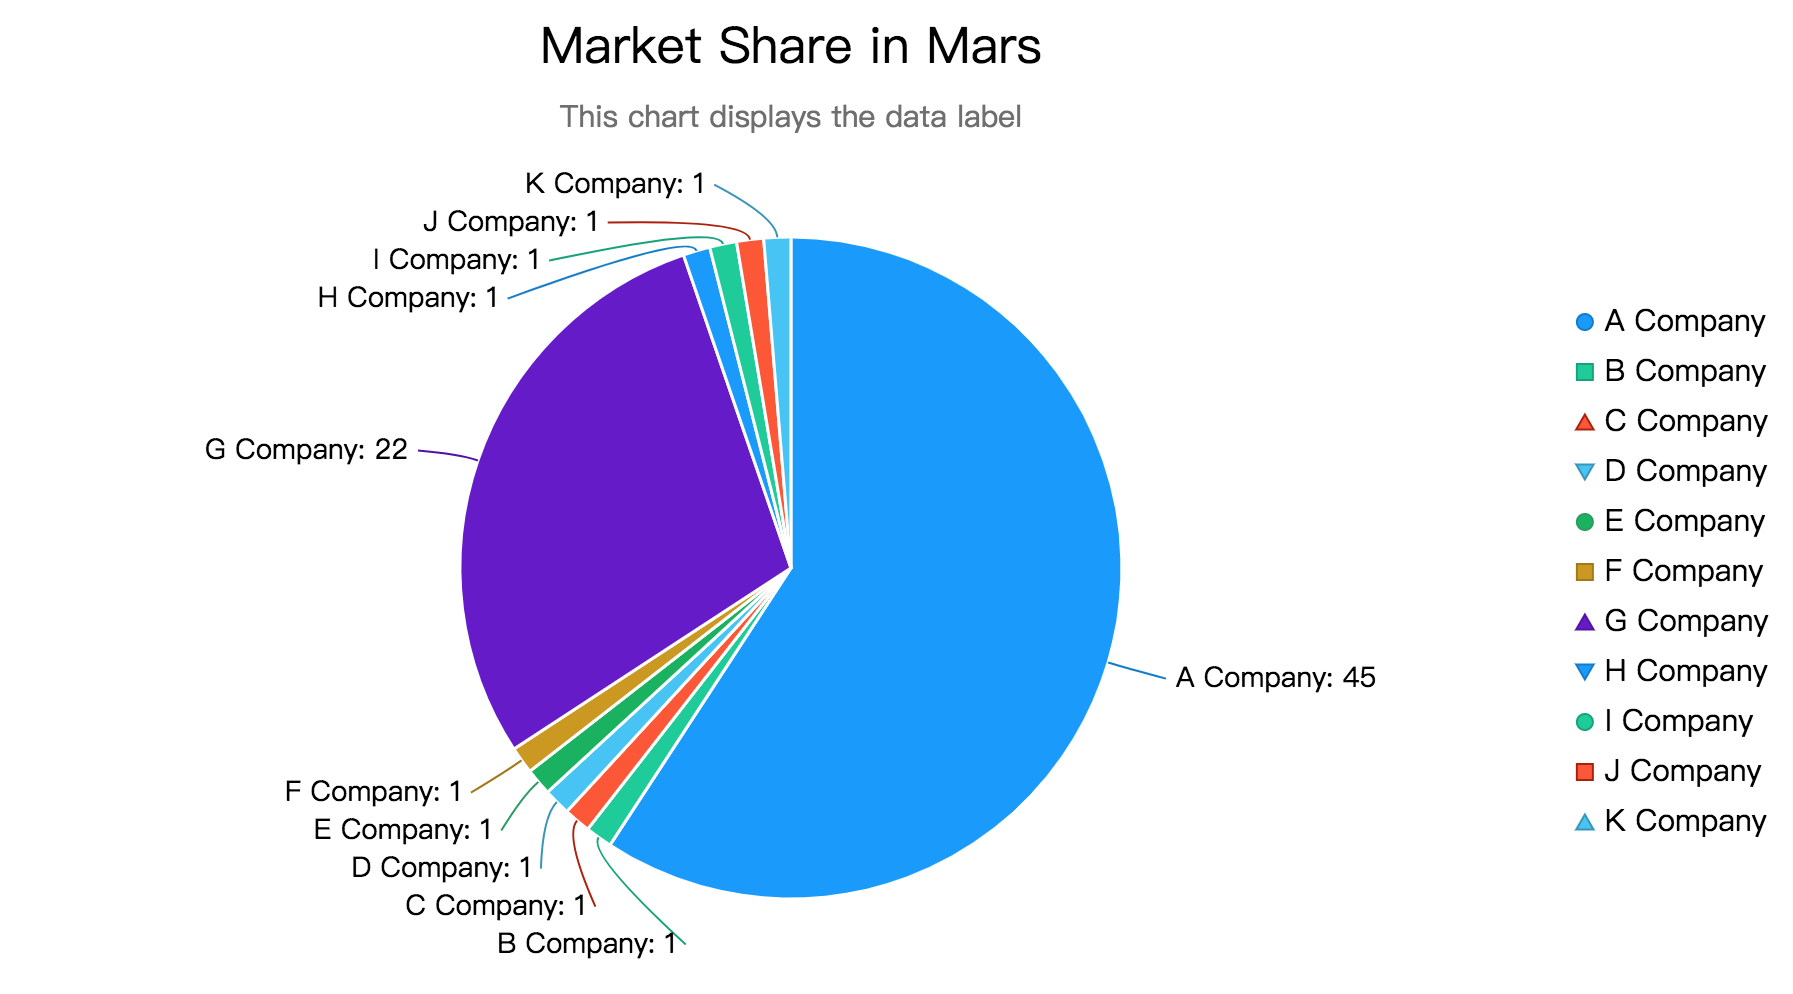
let input = {
    mainTitle: "Market Share in Mars",
    subTitle: "This chart displays the data label",
    series: [
        ["A Company", 45],
        ["B Company", 1],
        ["C Company", 1],
        ["D Company", 1],
        ["E Company", 1],
        ["F Company", 1],
        ["G Company", 22],
        ["H Company", 1],
        ["I Company", 1],
        ["J Company", 1],
        ["K Company", 1]],
    legend: "right",
    noDataLabel: false
};

weaver.weave("basicPieChart", input, document.getElementById("container"));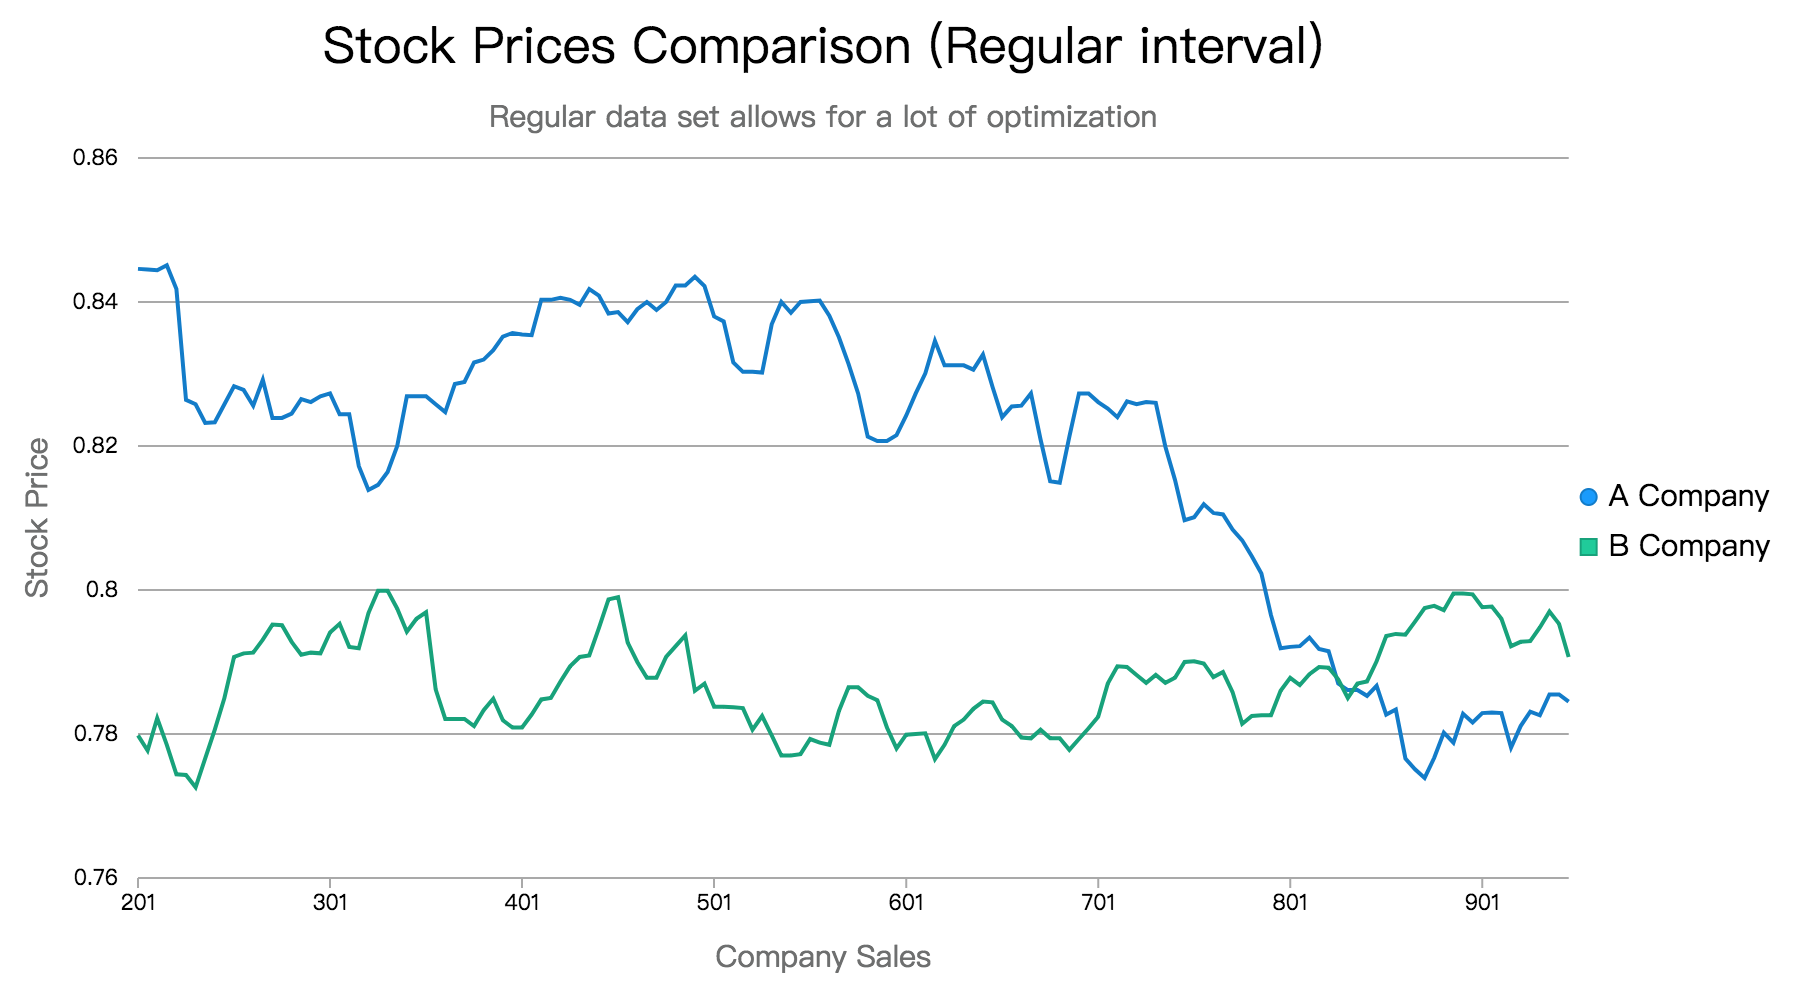
let input = {
    mainTitle: "Sales of our company in 2019 (Irregular intervals)",
    subTitle: "The quantity of the data set is large and displayed as stream",
    yAxisTitle: "number of items sold",
    xAxisTitle: "now I can't find a title for this axis",
    series: [
        ["Pencil sales", [[0, 19], [2,22] /* rest of data omitted */],
        ["Pen sales", [0, 23], [2, 14] /* rest of data omitted */]
    ],
    legend: "top"
};
weaver.weave("basicLineIrregular", input, document.getElementById("container"));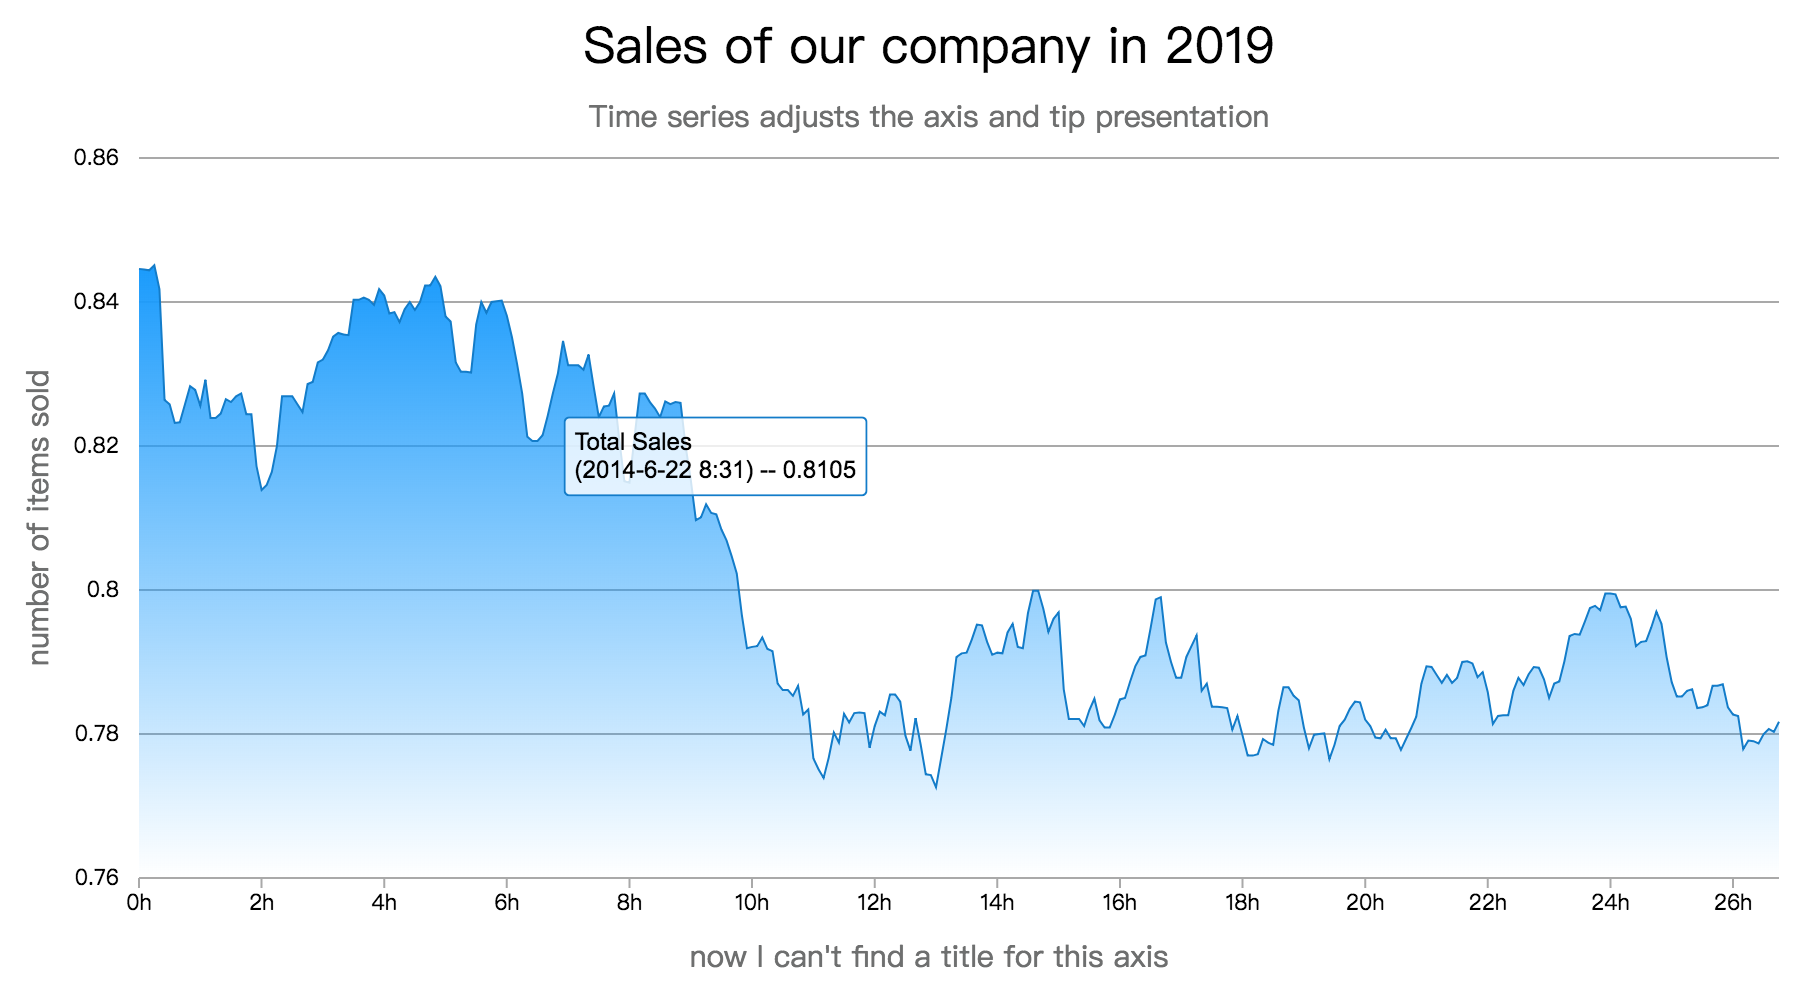
let input = {
    mainTitle: "Sales of our company in 2019",
    subTitle: "Time series adjusts the axis and tip presentation",
    yAxisTitle: "number of items sold",
    xAxisTitle: "now I can't find a title for this axis",
    startTime: Date.UTC(2014, 5, 21, 13, 5),
    interval: 5,
    unit: "m",
    series: [["Total Sales", [0.8446, 0.8445, 0.8444, 0.8451 /* rest of data omitted */]]],
    legend: "none"
};

weaver.weave("singleTime", input, document.getElementById("container")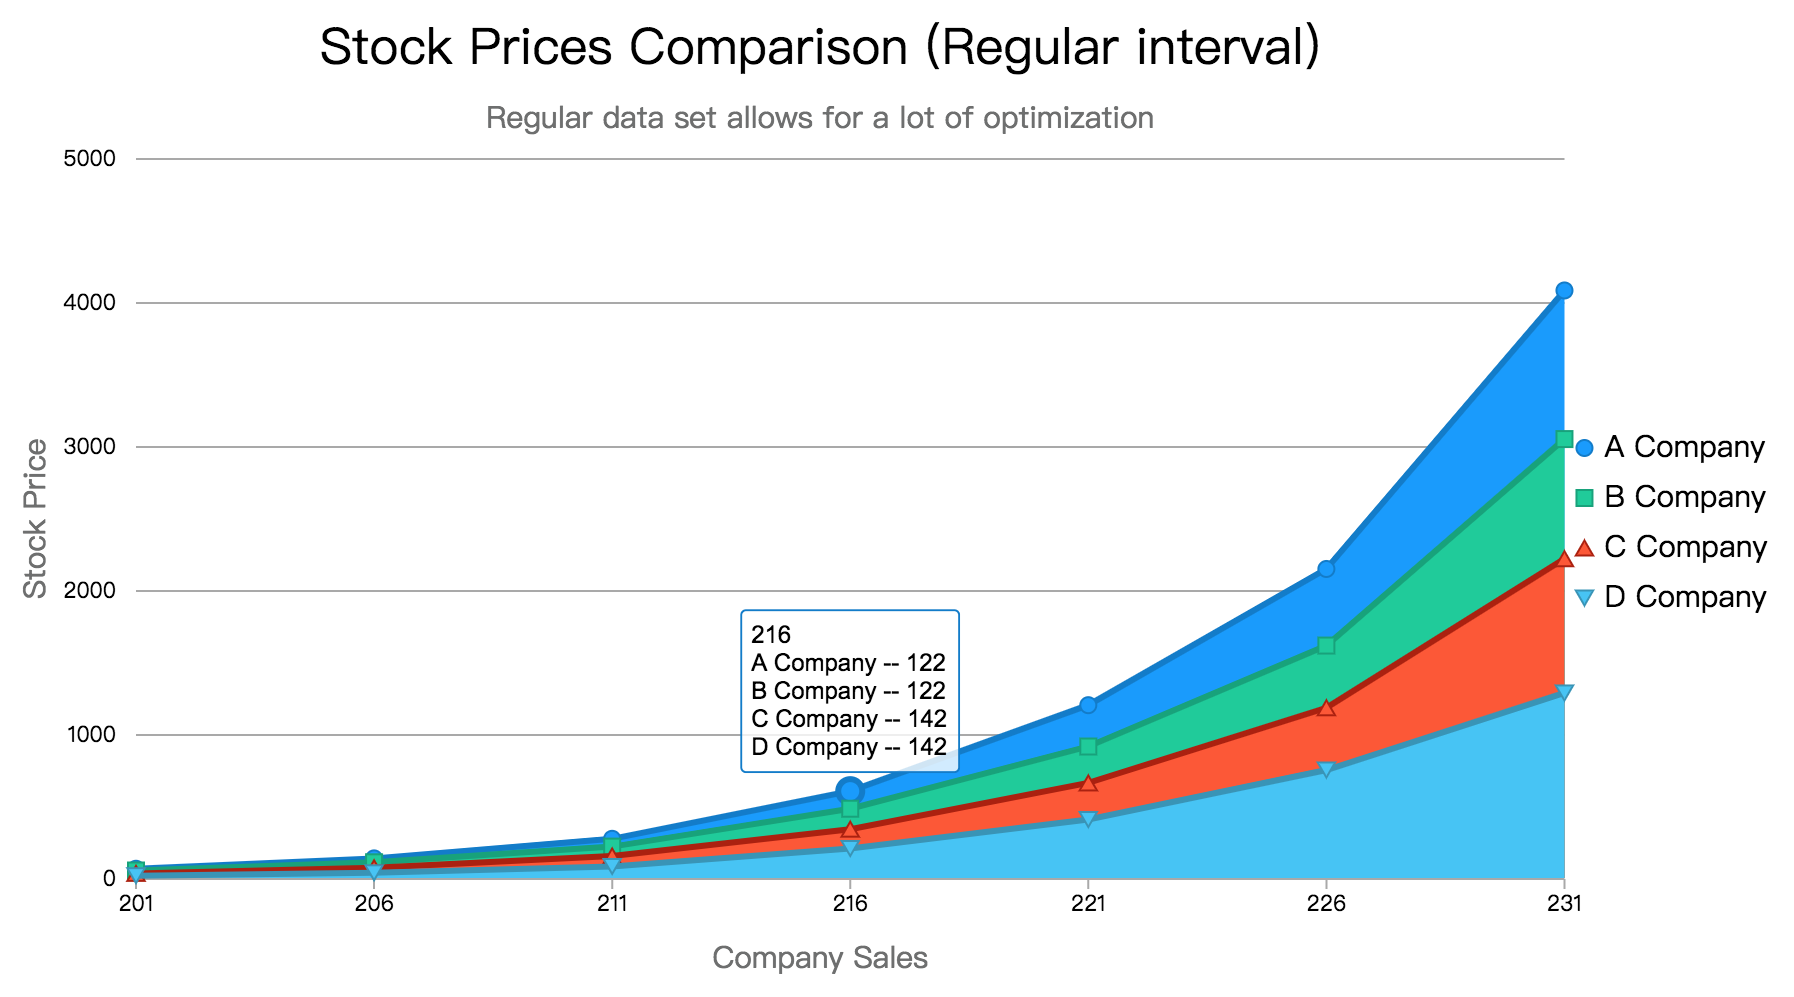
let input = {
    mainTitle: "Stock Prices Comparison (Regular interval)",
    subTitle: "Regular data set allows for a lot of optimization",
    yAxisTitle: "Stock Price",
    xAxisTitle: "Company Sales",
    start: 201,
    interval: 5,
    series: [
        ["A Company", [23, 43, 87, 212, 413, 757, 1292]],
        ["B Company", [16, 35, 73, 134, 254, 432, 932]],
        ["C Company", [20, 38, 65, 142, 253, 432, 831]],
        ["D Company", [12, 27, 54, 122, 287, 532, 1032]]
    ],
    legend: "right"
};

weaver.weave("basicStackRegular", input, document.getElementById("container"));
For a complete list of possible charts, please refer to the live demo
You would need webpack to further develop this library
There are a few things I would want to do:
- replace the underlying SVG draw methods with canvas methods
- add apis to realtime update the charts
- add some animation, when data changes


