See the demo here!
Contour graphing is an excellent way to visualise 2-input, 2-output functions.
What are 2-input, 2-output functions, you ask? Here are some examples:
- 2x2 matrices transform 2D vectors to 2D vectors. (Lorentz Boost)
- This is how graphics programming works.
- Lorentz Boost shows, according to special relativity, the spacetime warp an observer experiences when his velocity changes.
- Map projections transform lat-long coordinates to a point in 2D space. (Mercator Warp, Mercator to Mollweide)
- In Mercator (the most popular world map projection) to Mollweide (an equal-area projection), we see graphically how land area is distorted on world maps.
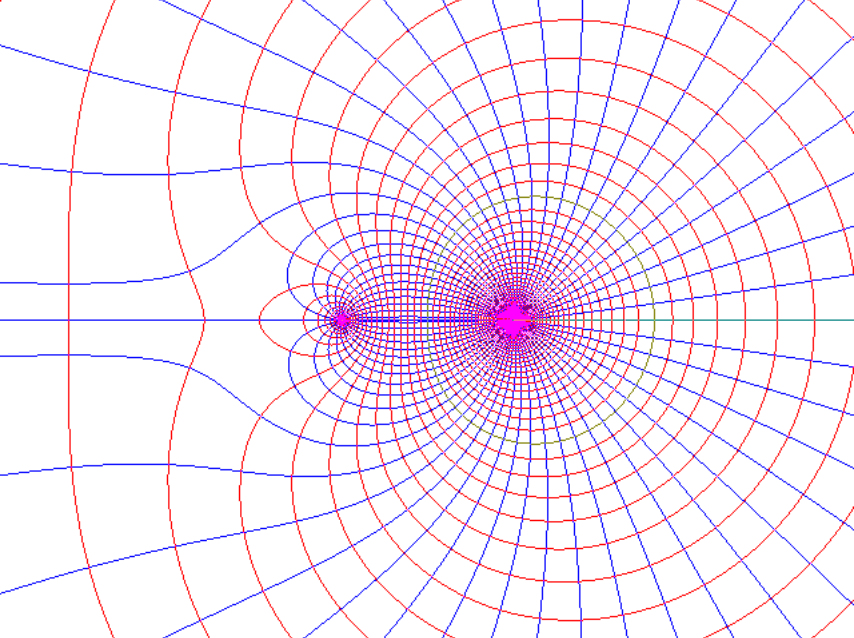
- 2D electric fields assign a 2D field vector to every point in 2D space. (Dipole Formation, Attraction to Repulsion)
- The demo shows electric field lines in blue and equipotential lines in red.
- This is made possible by the equivalence between the multipole expansion and the Laurent series. Read Visual Complex Analysis by Tristan Needham to learn more.
- Neural networks with 2 input neurons and 2 output neurons map 2 real numbers to 2 real numbers. (Neural Network)
- This is inspired by colah's post on neural networks and manifolds.
- 2D classical physics maps the initial position of a particle in 2D space to its final position in said space. (Galaxy Warp)
- Galaxy Warp is inspired by the old theory of differential rotation in galaxies, which is not how galaxy arms are formed.
- Procedural terrain generation may assign a small 2D deformation to each point in 2D space for more interesting terrain. (Simplex Warp)
- Using simplex noise (PDF) (a better version of Perlin noise) to warp terrain is described in this GPUGems article (under Sampling Tips, section 1.3.3).
- Complex functions transform a point on the complex plane (a complex number) to another point on the complex plane. (Everything else)
- Observe that, for all complex function demos other than Complex Exponentiation, the mesh lines form square-like cells. This illustrates the conformal (angle-preserving) geometry of holomorphic (complex-differentiable) functions. Once again, read Visual Complex Analysis by Tristan Needham to learn more.
- For Complex Exponentiation, the plot is in polar coordinates rather than Cartesian coordinates to make the effect clearer. It shows how the plot of zn changes as n increases from 1 to 4. Intuitively, think of zn as rnei n phi.
2D Contour Grapher provides an easy way (well, provided you know GLSL) to plot any of these, and more!
Plotted something interesting that's not on the demo? Used my code in your own project? I'd love to see it!
Important Note: If you want to see how a transformation warps the 2D space (like in computer graphics, or map projections), you need to plot the inverse of the function you're considering (see the demo code).
Why? By assigning, to each point, the coordinate in the input space that gets mapped to it by your function, the contours would then correspond to lines where one coordinate is constant, i.e. the warped mesh. Do the math. Or just trust me on this.
Plotting is done with the OpenGL ES 1.0 shading language. It's a C-like language for the GPU with native vector support.
The input coordinate is "cPos" (for current position) and the output coordinate is "res" (for result). For animations, the variable "time" is a uniform (global variable) that goes from 0 to 1 for each cycle.
Note that OpenGL ES does not implicitly cast ints to floats. You will need to write numbers like "23" as "23.0" to avoid compile errors.
OpenGL ES doesn't natively support complex numbers. The complex function examples do, however, provide a small complex number utility library that treats vec2s as complex numbers. You can access it under "Library Functions' on the demo page.
If you don't want to learn OpenGL ES, you can use the following snippet to transform it to effectively C code:
float inX = cPos.x, inY = cPos.y, outX, outY;
// Your code here, eg:
// float r = sqrt(inX * inX + inY * inY);
// float phi = time * 20.0 * atan(inY, inX);
// outX = r;
// outY = phi;
res = vec2(outX, outY);You've probably heard of contour plots before, in the context of 2-input, 1-output functions like topographic maps. This is achieved by colouring in every point where the function takes on an integer value.
2D Contour Grapher does precisely that, except for 2-input, 2-output functions.
The graphing is GPU-accelerated with WebGL, using the floating point textures (OES_texture_float) extension. Heavy inspiration was taken from the WebGL GPGPU libraries gpu.js and WebCLGL, but ultimately I had to reimplement it to meet my specific needs.
The UI is implemented with Bootstrap, React and ACE editor.
Download the source, install build dependencies and start babel watch:
git clone https://github.com/krawthekrow/contourer/
cd contourer
npm install

# In another window
npm run babelWatch
Any modifications you make would immediately be seen in index-dev.html. Compile and minify the source to see changes in index.html:
gulp build
Uhh... sorry? Did you say something? Oh whoops, I'm late for an appointment. Bye!
2D Contour Grapher is released under the MIT license.
Drop me an email!
Chat me up on Discord!
Or if you really have to, mention me on Twitter...

