Giter VIP home page Giter VIP logo

go-echarts's Introduction

go-echarts

🎨 The adorable charts library for Golang.

Build Status Go Report Card Contributions welcome MIT License GoDoc echartsVersion handbook

If a language can be used to build web scrapers, it definitely needs to provide a graceful data visualization library. --- by dongdong.

In the Golang ecosystem, there are not many choices for data visualization libraries.
The development of go-echarts aims to provide a simple yet powerful data visualization library for Golang.
Apache ECharts is an awesome charting and visualization library, it supports adorable chart types and various interactive features. and there have many program languages interactive with Echarts, such as pyecharts, which go-echarts learns and has evolved a lot from.

中文 README

🔰 Installation

Classic way to get go-echarts

# this may be not a good choice to use v2 go-echarts without gomod(GO111MODULE=off), the 
# next generation version management system 
# Technically, you could use go-echarts in the way below, if you have a better workaround, please let us know....

$ go get -u github.com/go-echarts/go-echarts/...
$ cd $go-echarts-project
$ mkdir v2 && mv charts components datasets opts render templates types v2

Use gomod style

$ go get -u github.com/go-echarts/go-echarts/v2/...

OR

# go.mod

require github.com/go-echarts/go-echarts/v2

⏳ Version

The go-echarts project is being developed under v2 version and the active codebase is on the master branch.

v1 and v2 are incompatible which means that you cannot upgrade go-echarts from v1 to v2 smoothly. But I think it is worth trying that new version.

Especially, when there contains mino changes (usually in enhancement), we will release the rc version before a standard release. So, if you upgrade your projects cross the rc versions, maybe need little adjust, and I believe it is worthy to do.

✨ Features

  • Clean and comprehensive API.
  • Visualize your data in 25+ different ways.
  • Highly configurable chart options.
  • Detailed documentation and a rich collection of examples.
  • Visualize your geographical data with 400+ maps.

📝 Usage

It's easy to get started with go-echarts with the handbook, go-echarts/examples and GoDocs.

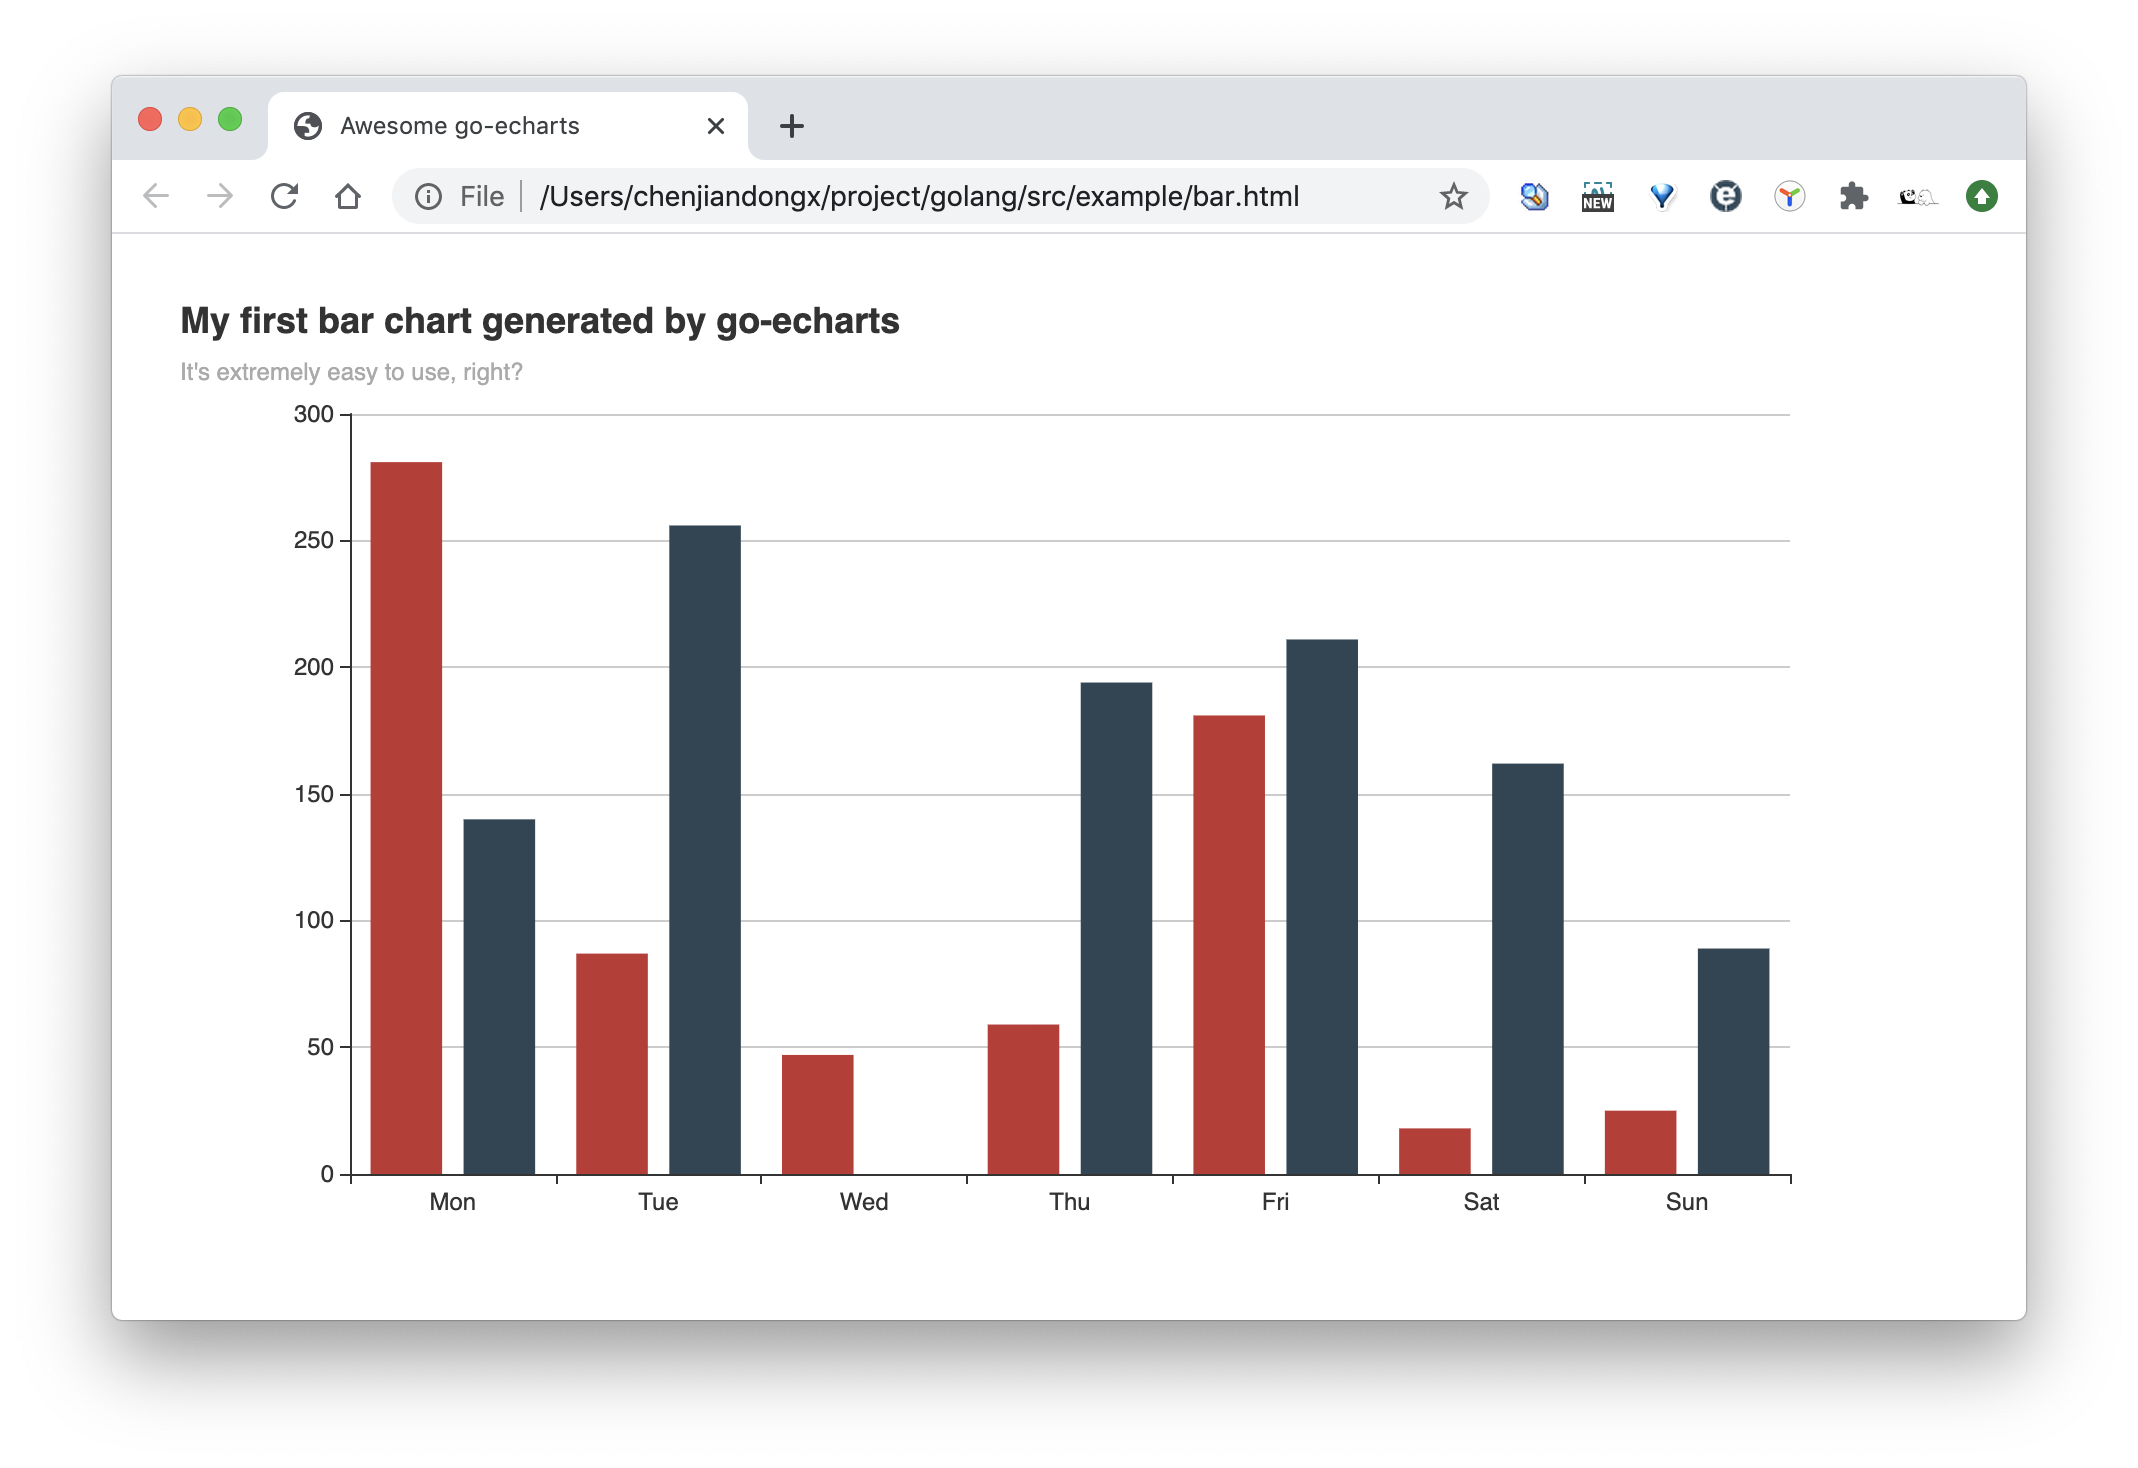
In this example, we create a simple bar chart with only a few lines of code.

package main

import (
	"math/rand"
	"os"

	"github.com/go-echarts/go-echarts/v2/charts"
	"github.com/go-echarts/go-echarts/v2/opts"
)

// generate random data for bar chart
func generateBarItems() []opts.BarData {
	items := make([]opts.BarData, 0)
	for i := 0; i < 7; i++ {
		items = append(items, opts.BarData{Value: rand.Intn(300)})
	}
	return items
}

func main() {
	// create a new bar instance
	bar := charts.NewBar()
	// set some global options like Title/Legend/ToolTip or anything else
	bar.SetGlobalOptions(charts.WithTitleOpts(opts.Title{
		Title:    "My first bar chart generated by go-echarts",
		Subtitle: "It's extremely easy to use, right?",
	}))

	// Put data into instance
	bar.SetXAxis([]string{"Mon", "Tue", "Wed", "Thu", "Fri", "Sat", "Sun"}).
		AddSeries("Category A", generateBarItems()).
		AddSeries("Category B", generateBarItems())
	// Where the magic happens
	f, _ := os.Create("bar.html")
	bar.Render(f)
}

And the generated bar.html is rendered as below. Isn't that cool!

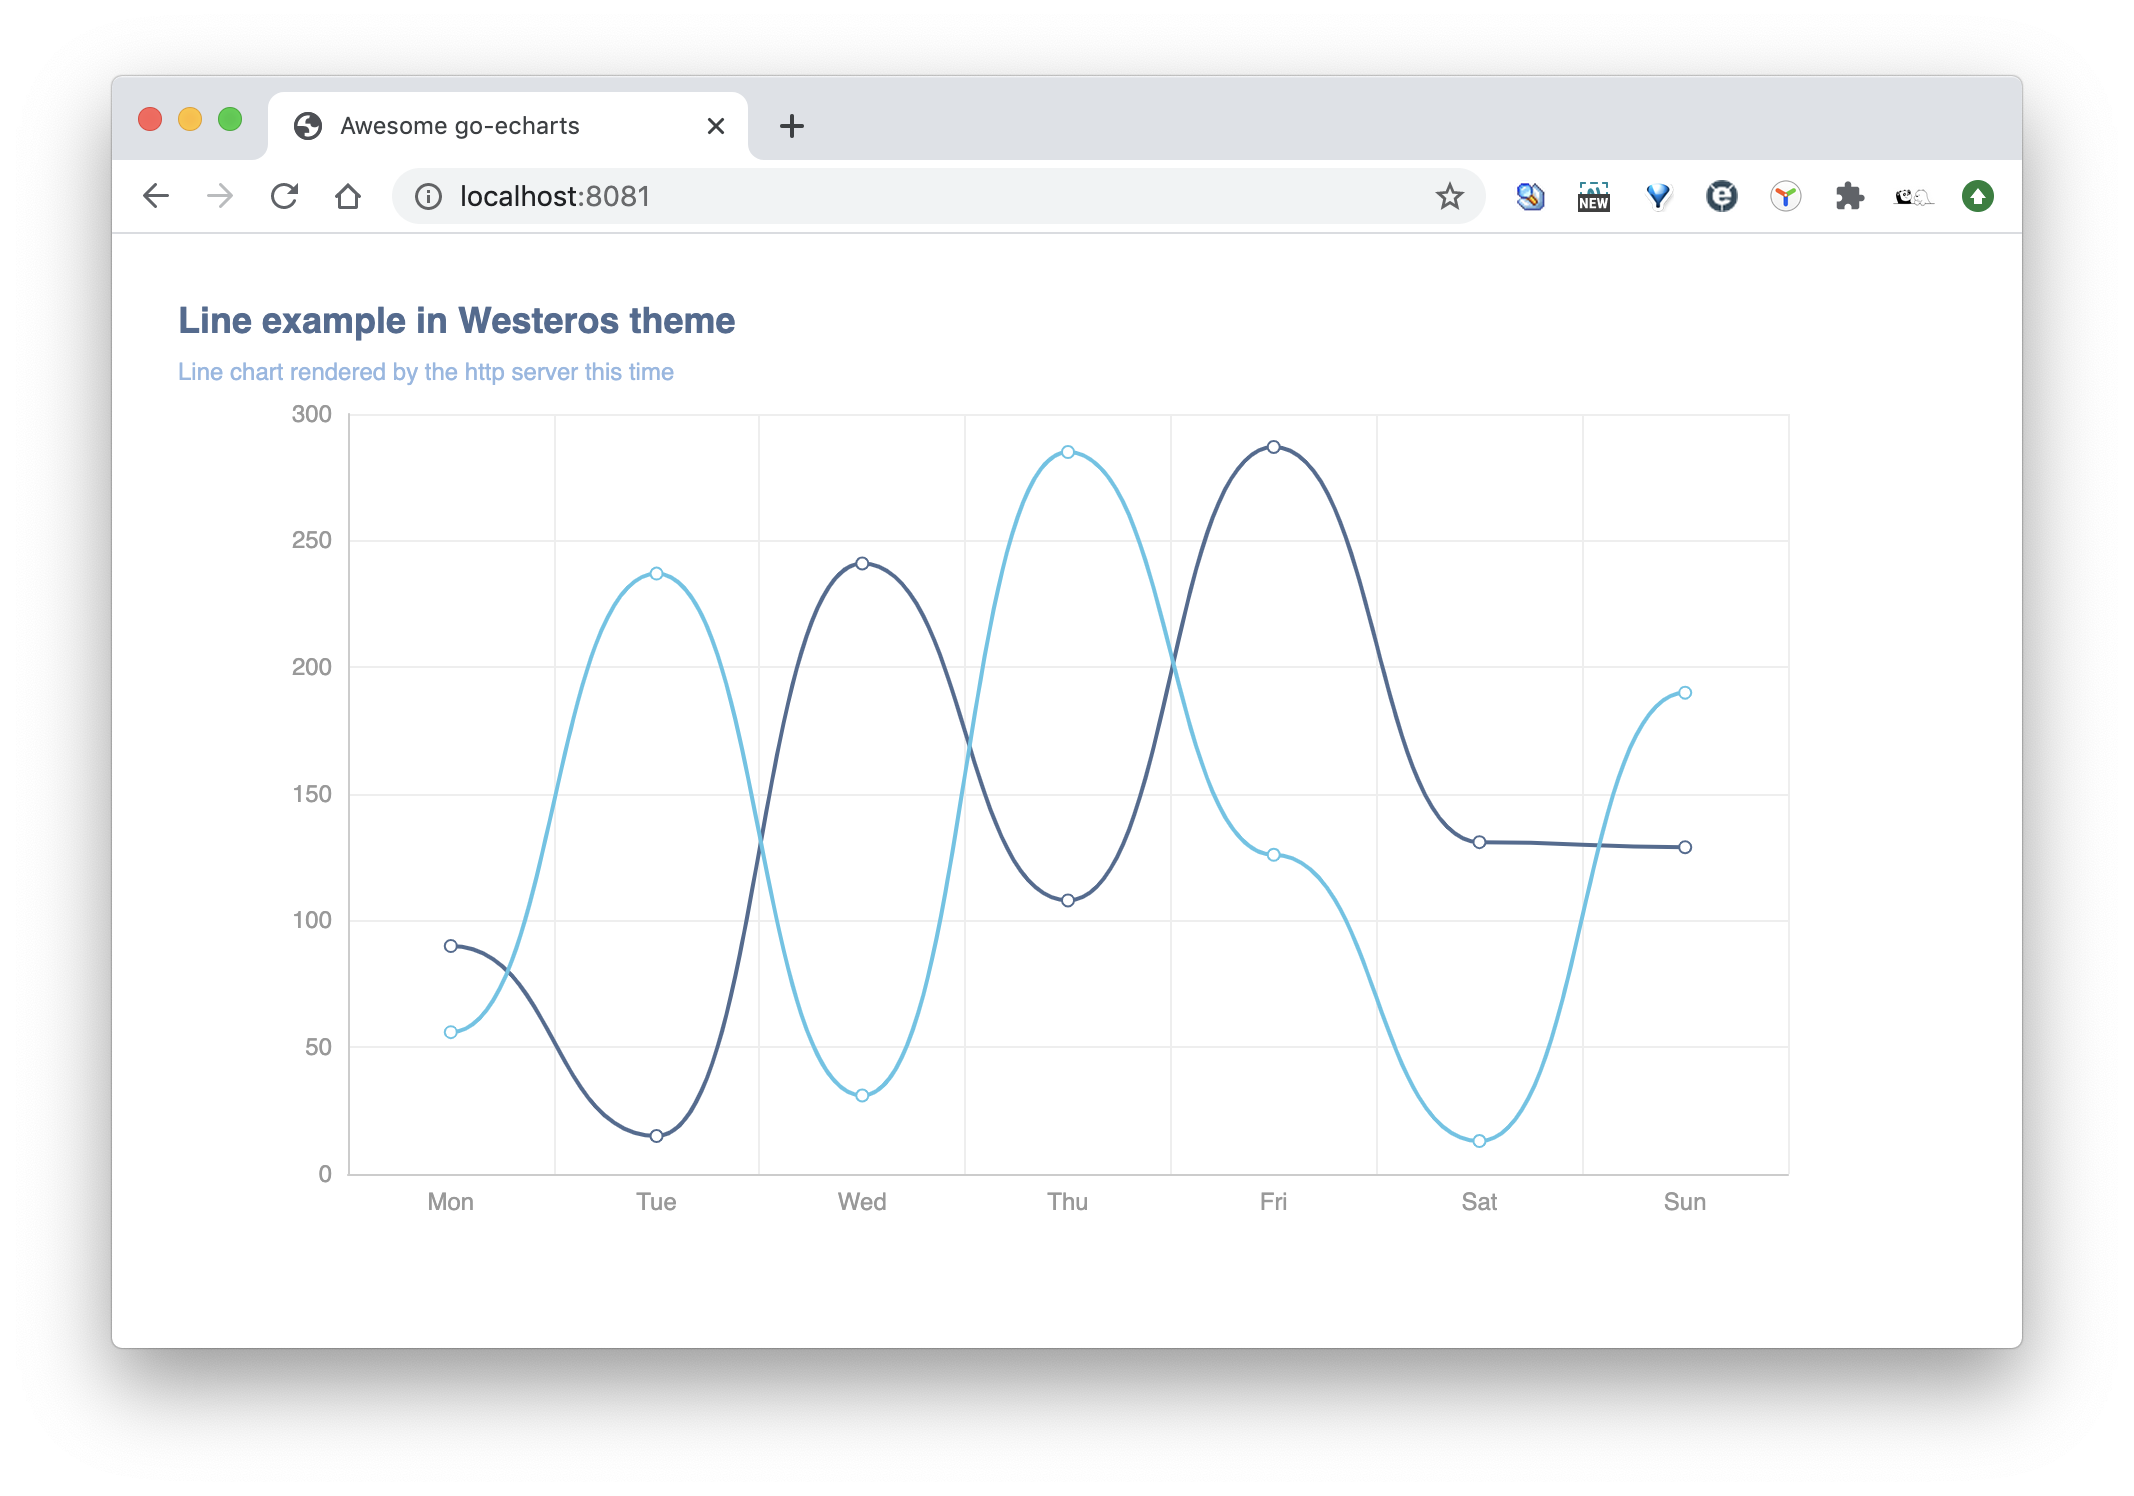
Of course we can also start a listening web server with net/http.

package main

import (
	"math/rand"
	"net/http"

	"github.com/go-echarts/go-echarts/v2/charts"
	"github.com/go-echarts/go-echarts/v2/opts"
	"github.com/go-echarts/go-echarts/v2/types"
)

// generate random data for line chart
func generateLineItems() []opts.LineData {
	items := make([]opts.LineData, 0)
	for i := 0; i < 7; i++ {
		items = append(items, opts.LineData{Value: rand.Intn(300)})
	}
	return items
}

func httpserver(w http.ResponseWriter, _ *http.Request) {
	// create a new line instance
	line := charts.NewLine()
	// set some global options like Title/Legend/ToolTip or anything else
	line.SetGlobalOptions(
		charts.WithInitializationOpts(opts.Initialization{Theme: types.ThemeWesteros}),
		charts.WithTitleOpts(opts.Title{
			Title:    "Line example in Westeros theme",
			Subtitle: "Line chart rendered by the http server this time",
		}))

	// Put data into instance
	line.SetXAxis([]string{"Mon", "Tue", "Wed", "Thu", "Fri", "Sat", "Sun"}).
		AddSeries("Category A", generateLineItems()).
		AddSeries("Category B", generateLineItems()).
		SetSeriesOptions(charts.WithLineChartOpts(opts.LineChart{Smooth: true}))
	line.Render(w)
}

func main() {
	http.HandleFunc("/", httpserver)
	http.ListenAndServe(":8081", nil)
}

image

🔖 Gallery

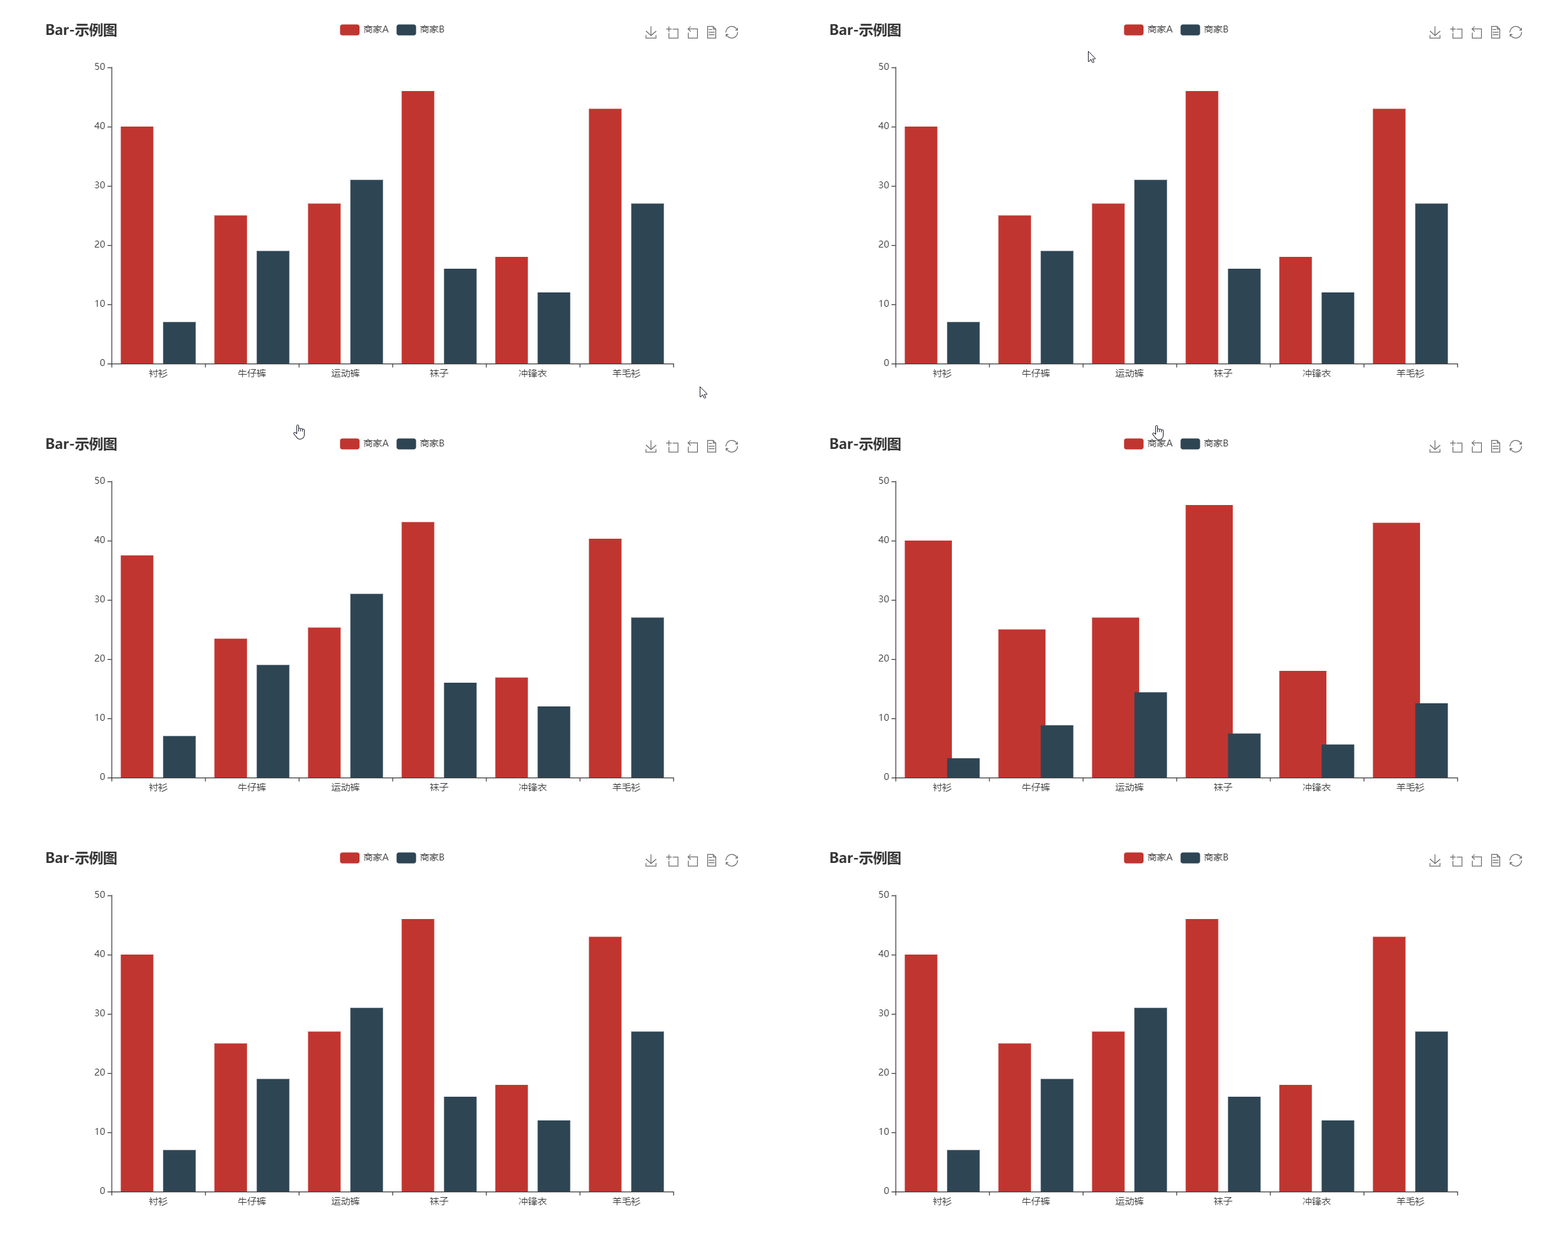
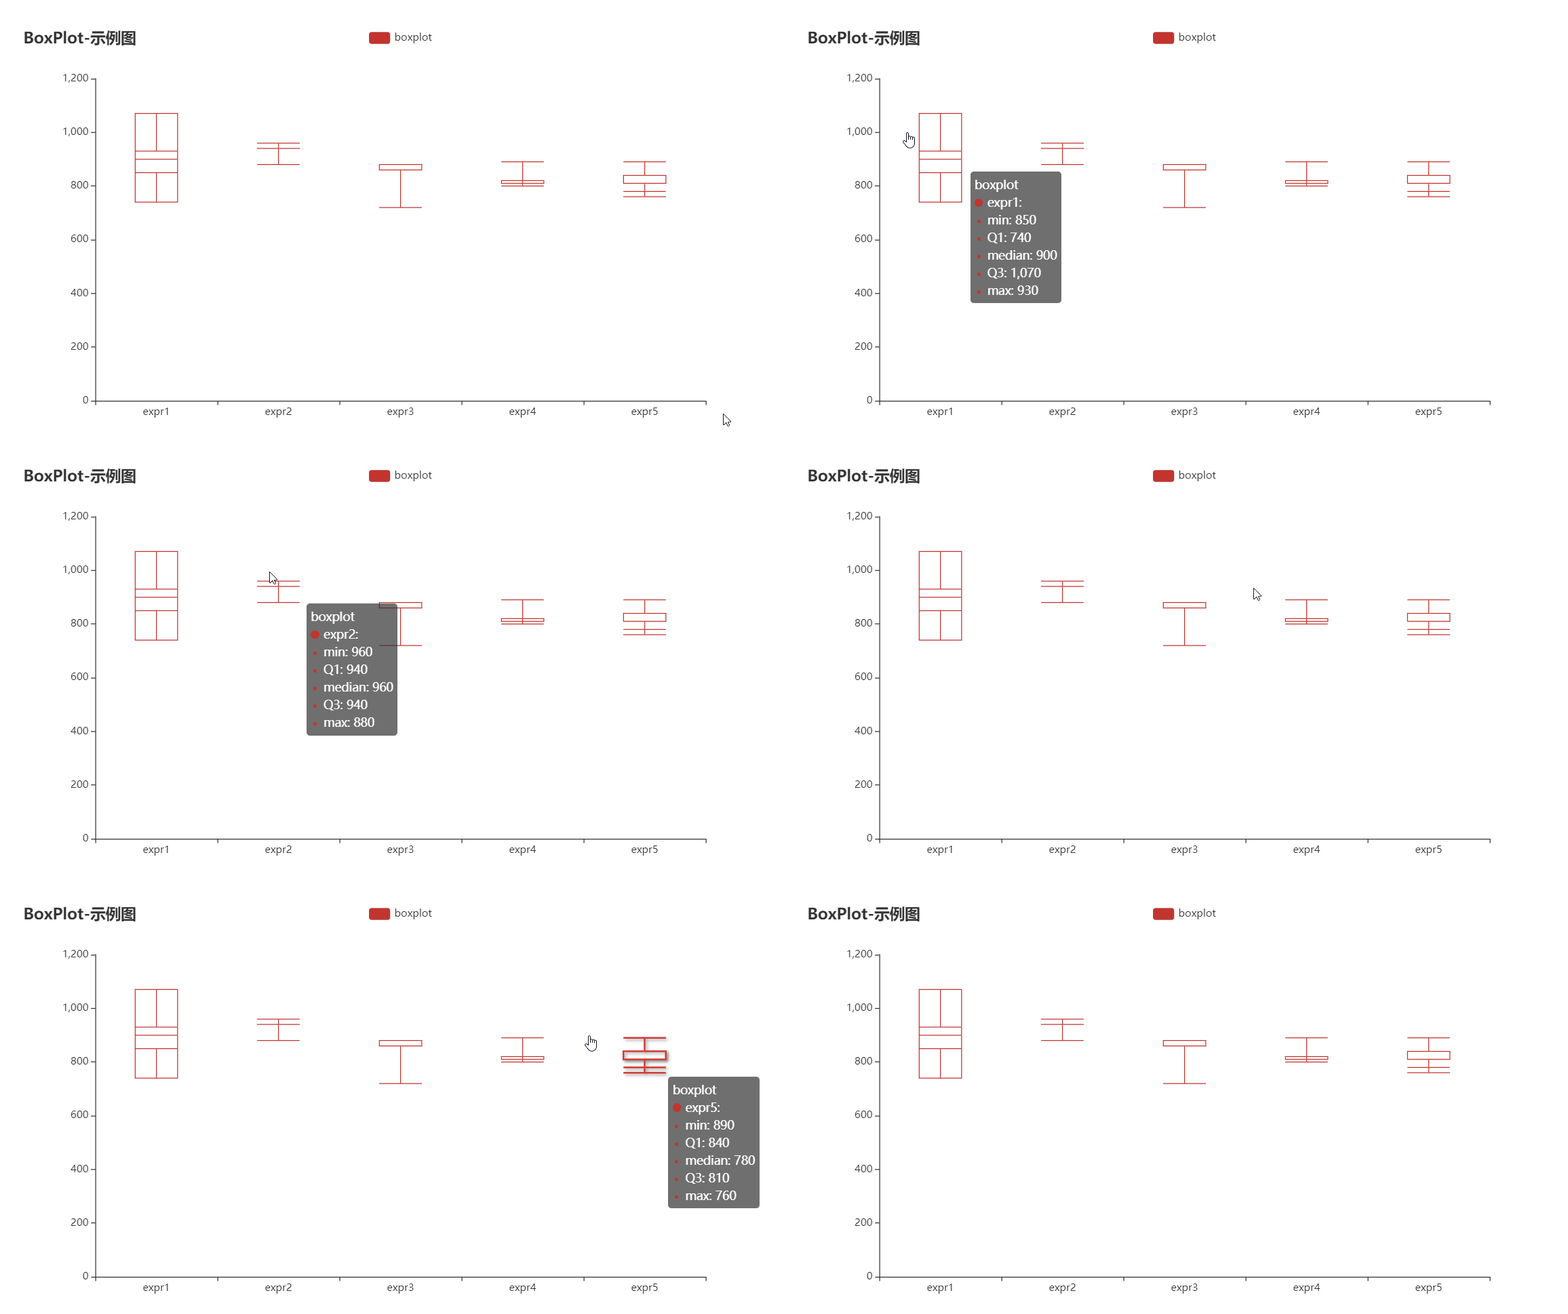
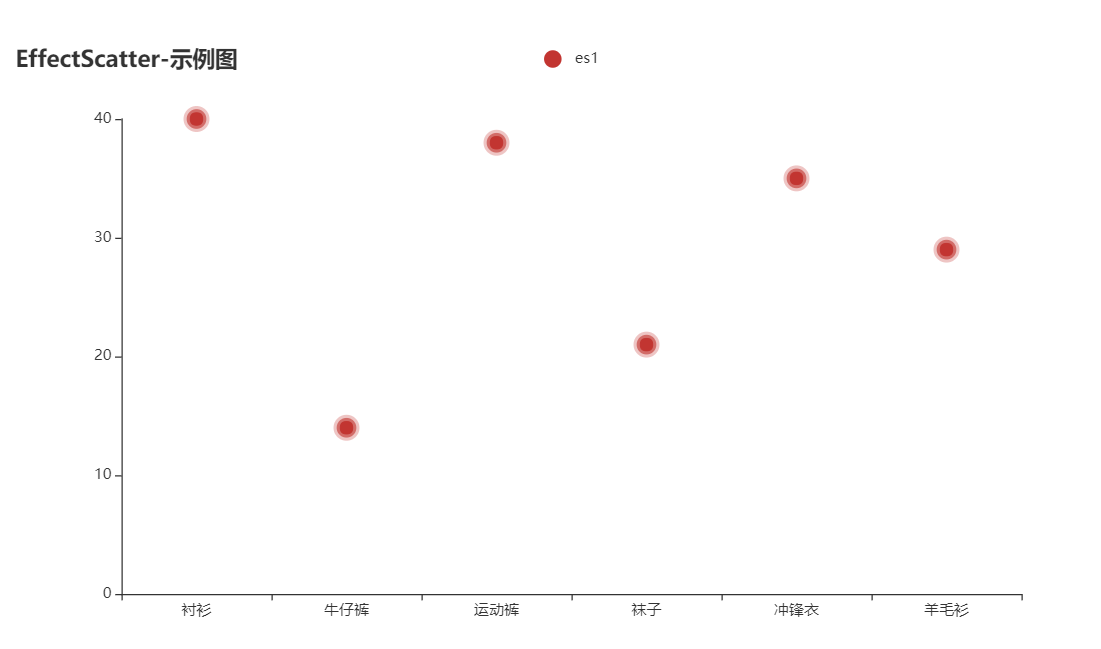
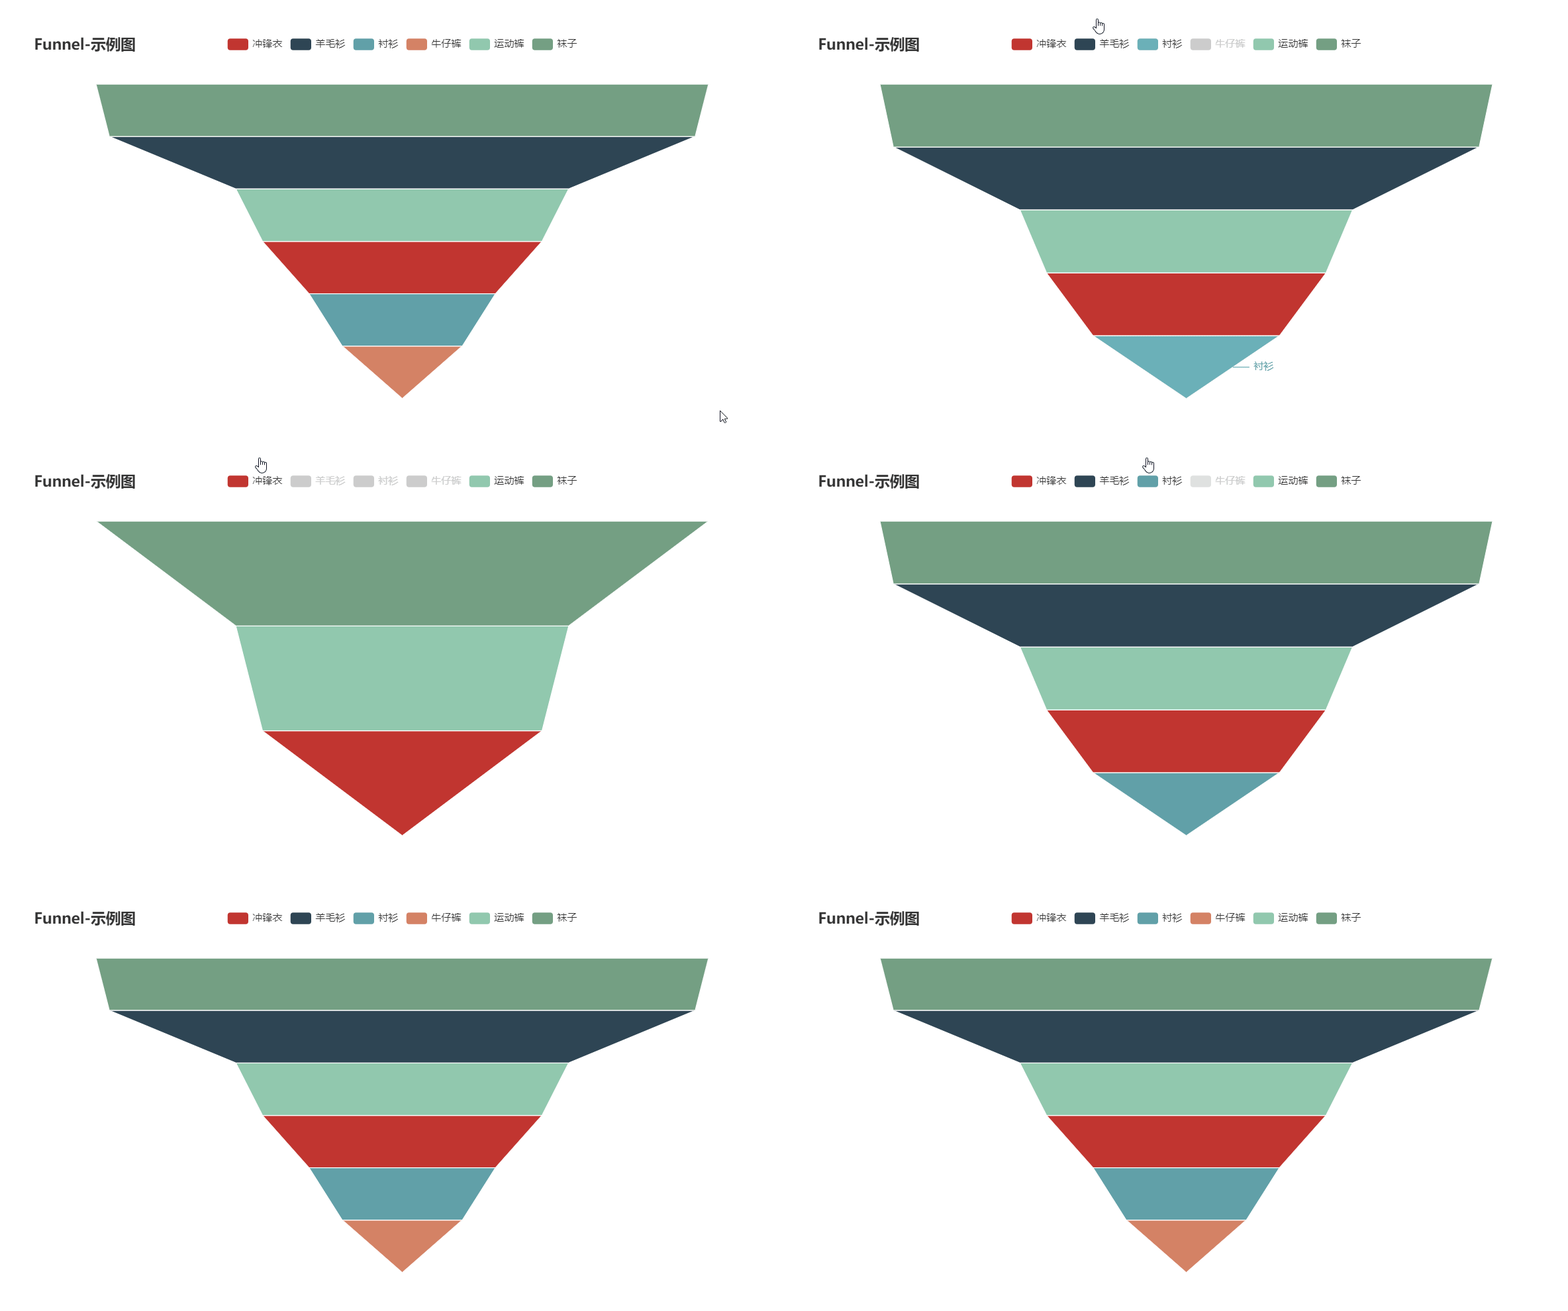
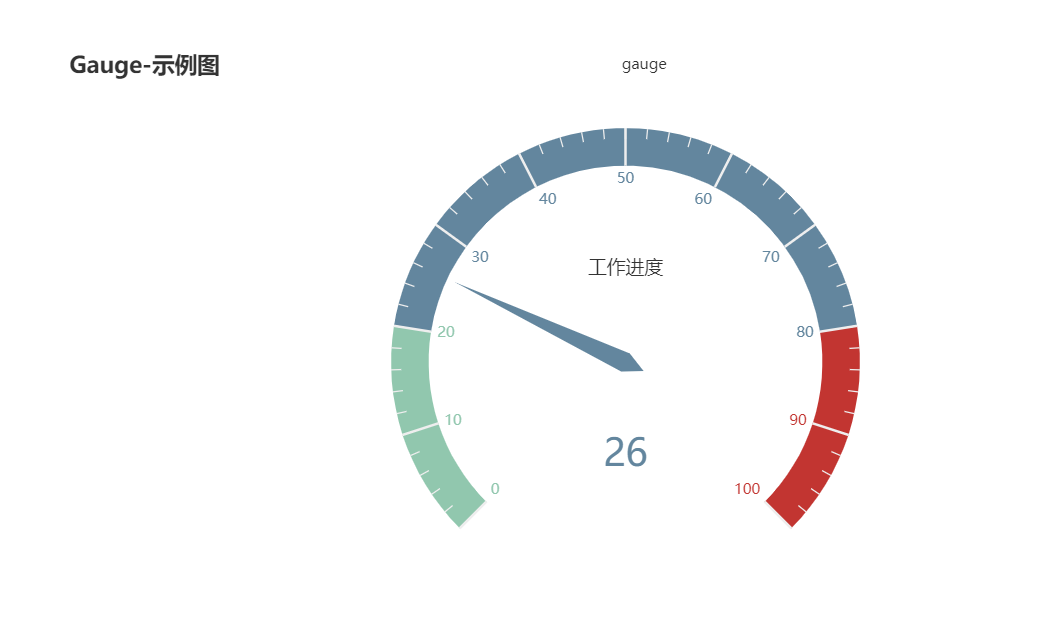
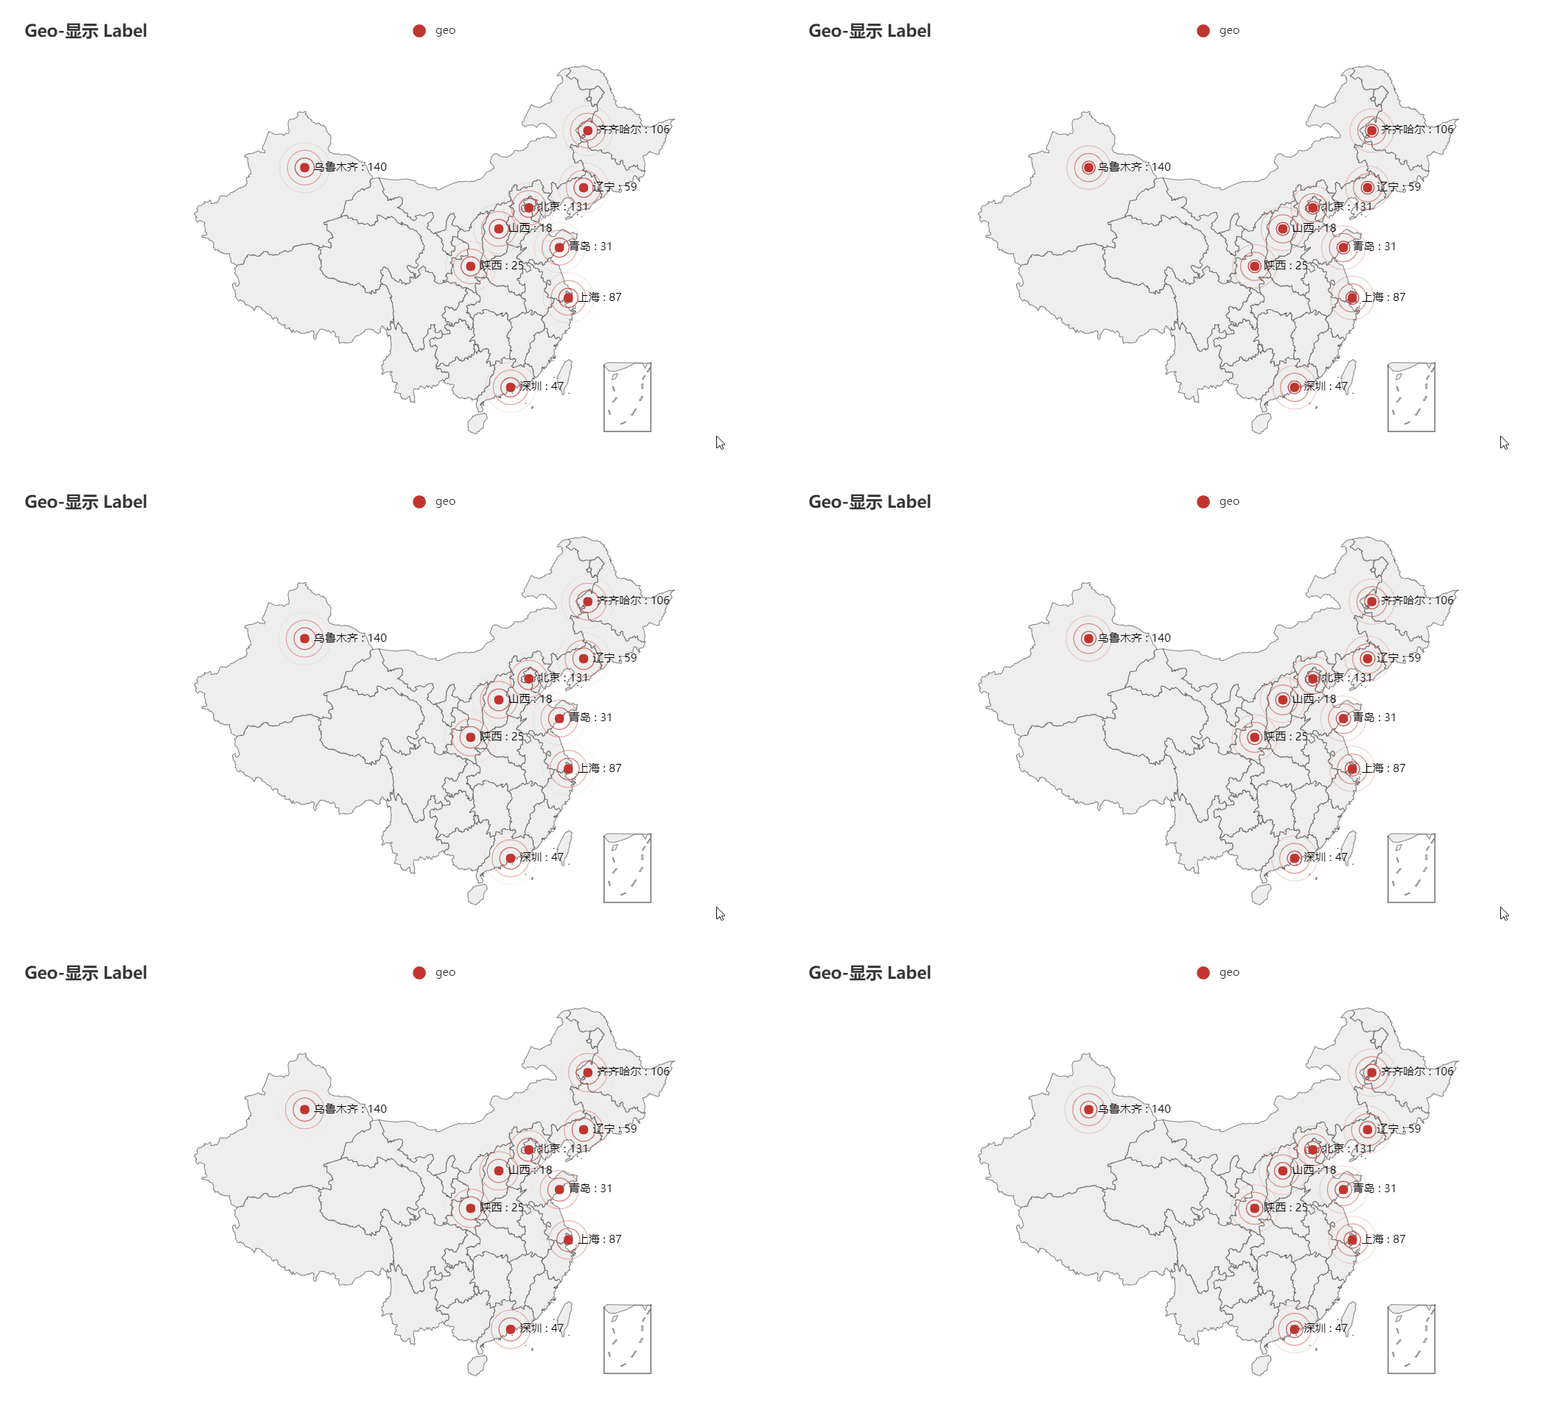
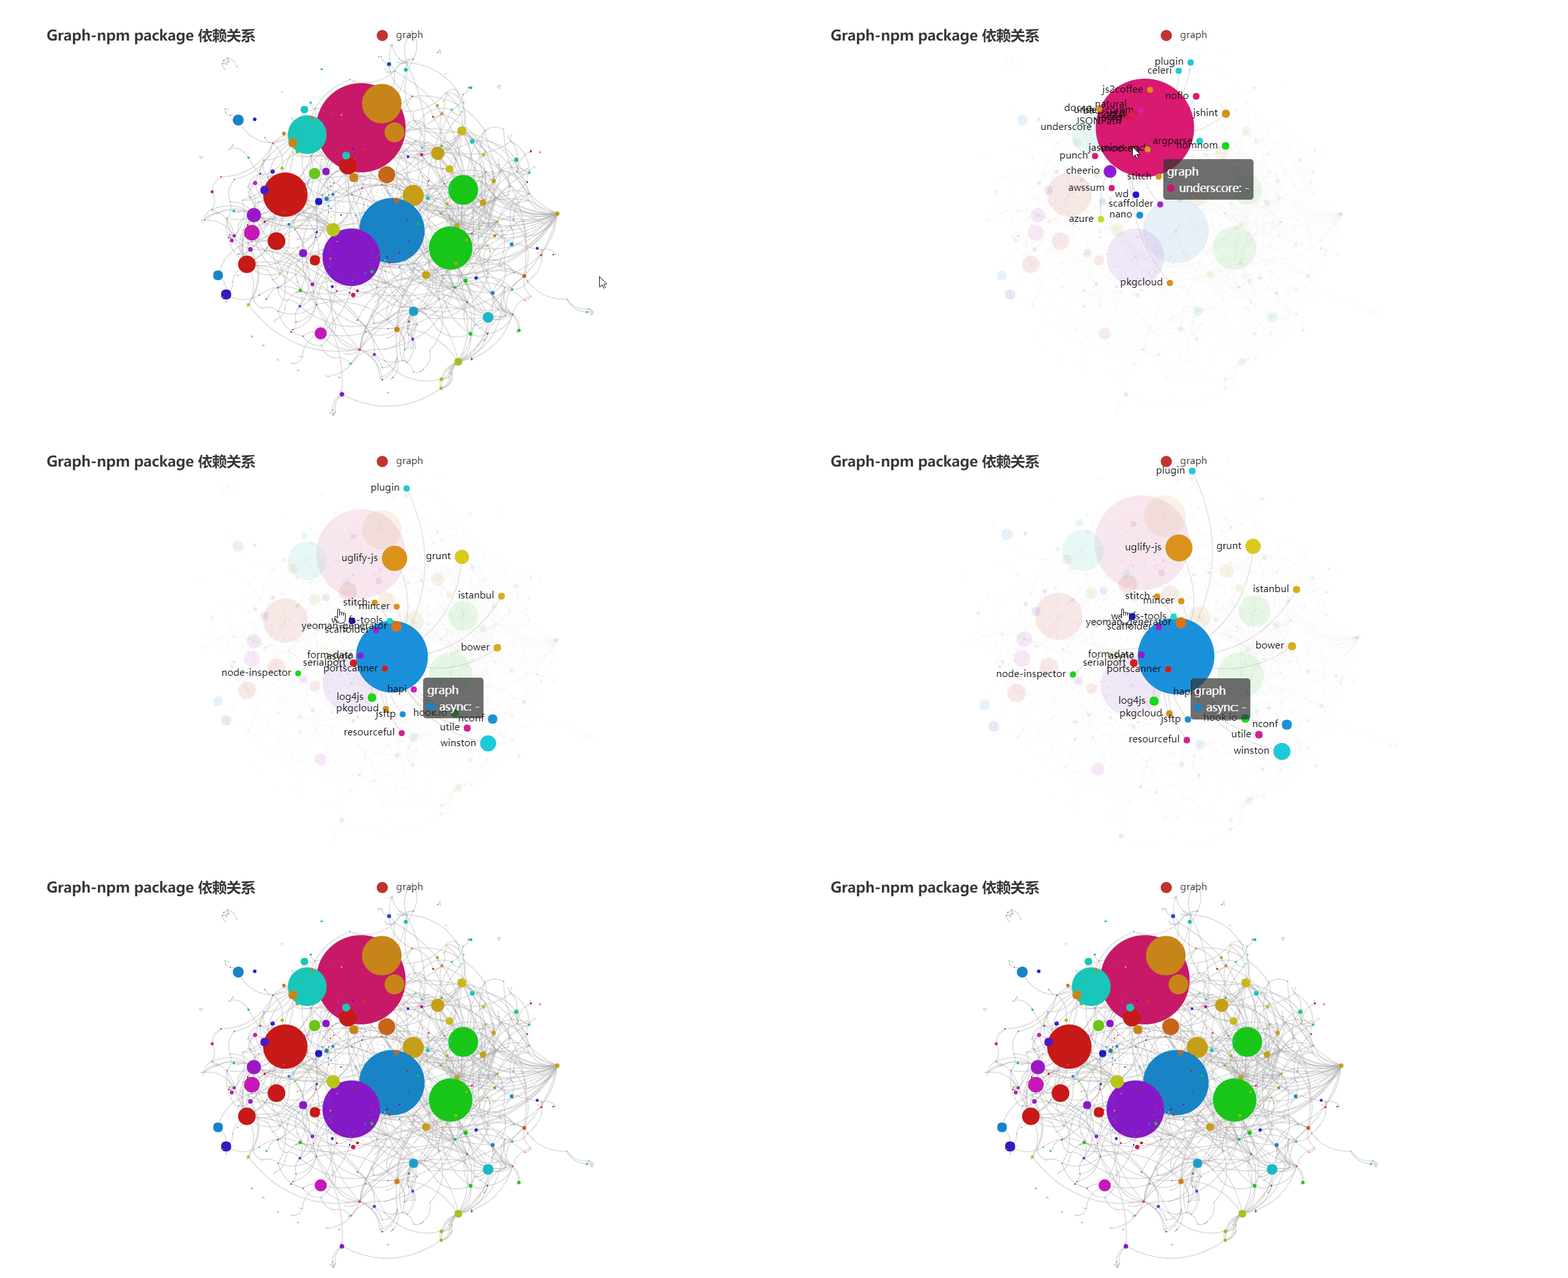
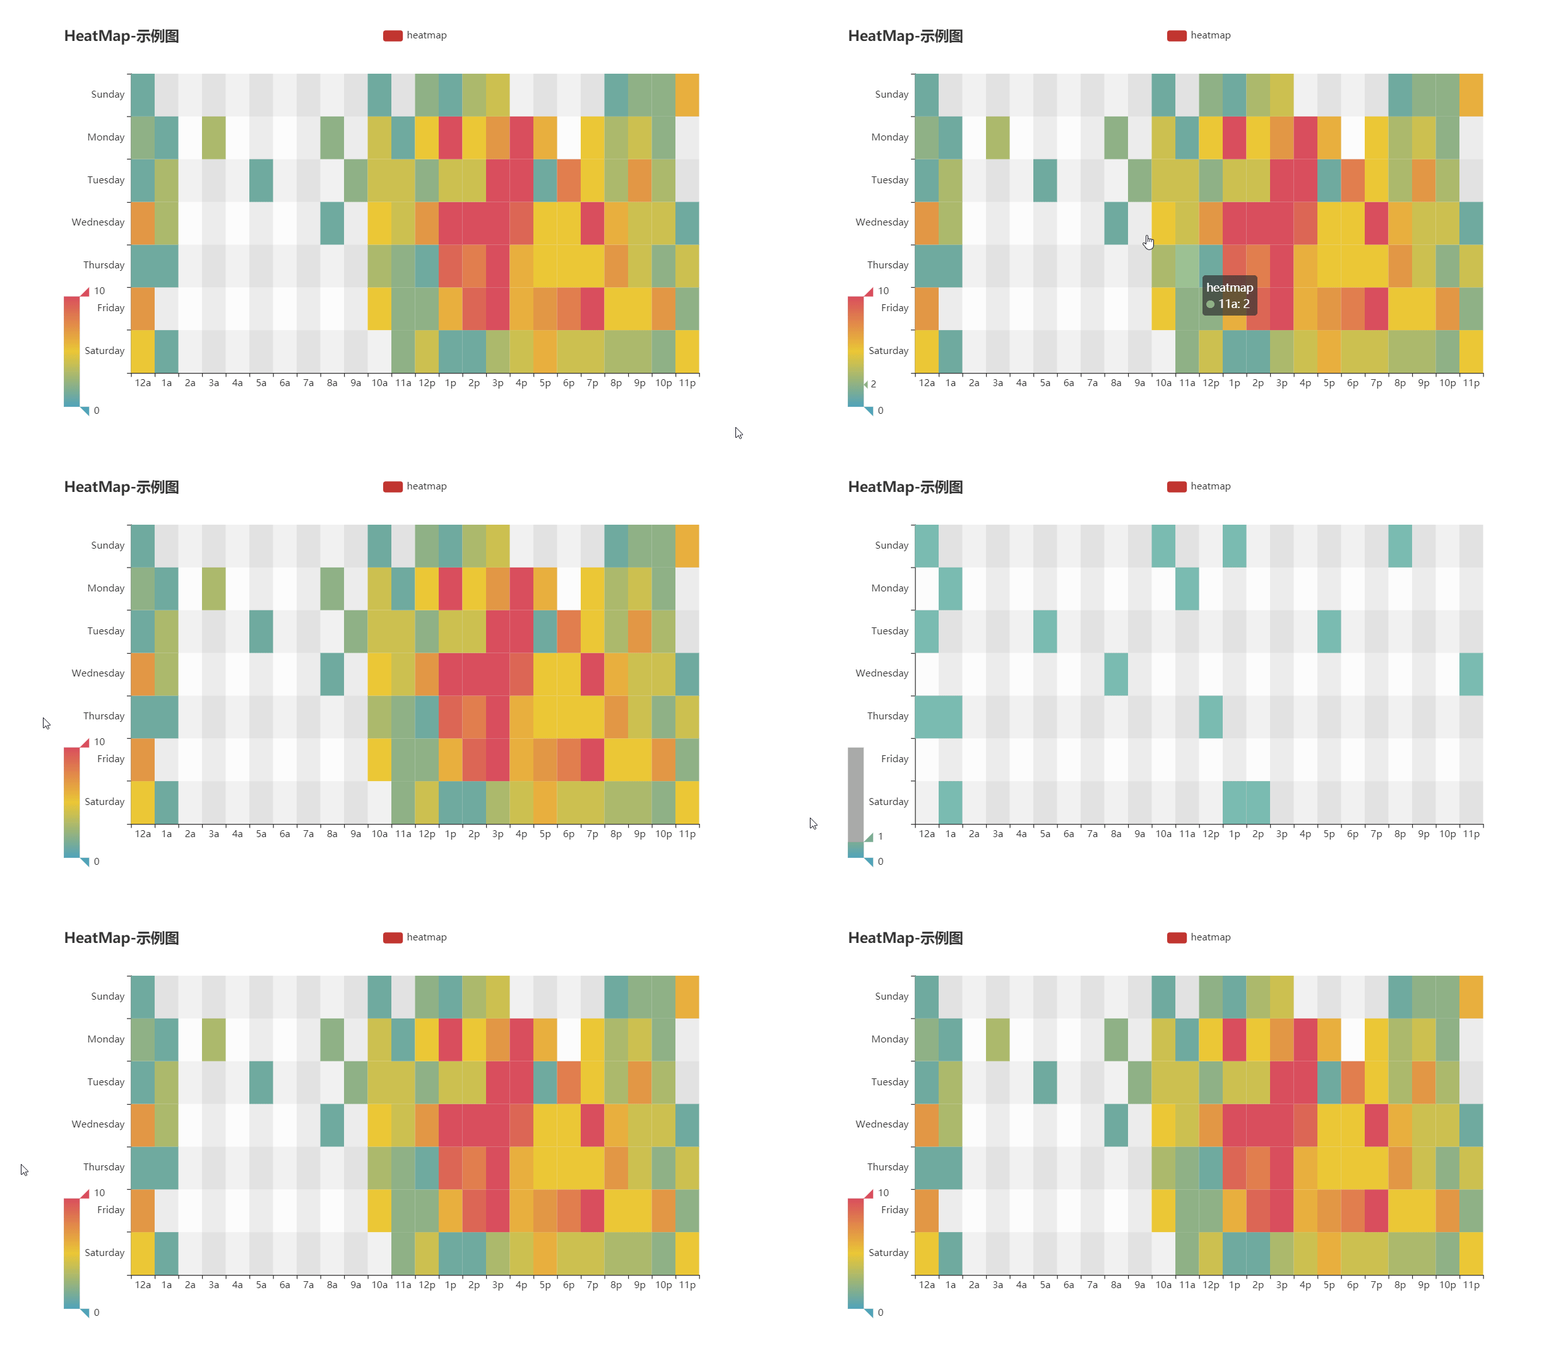
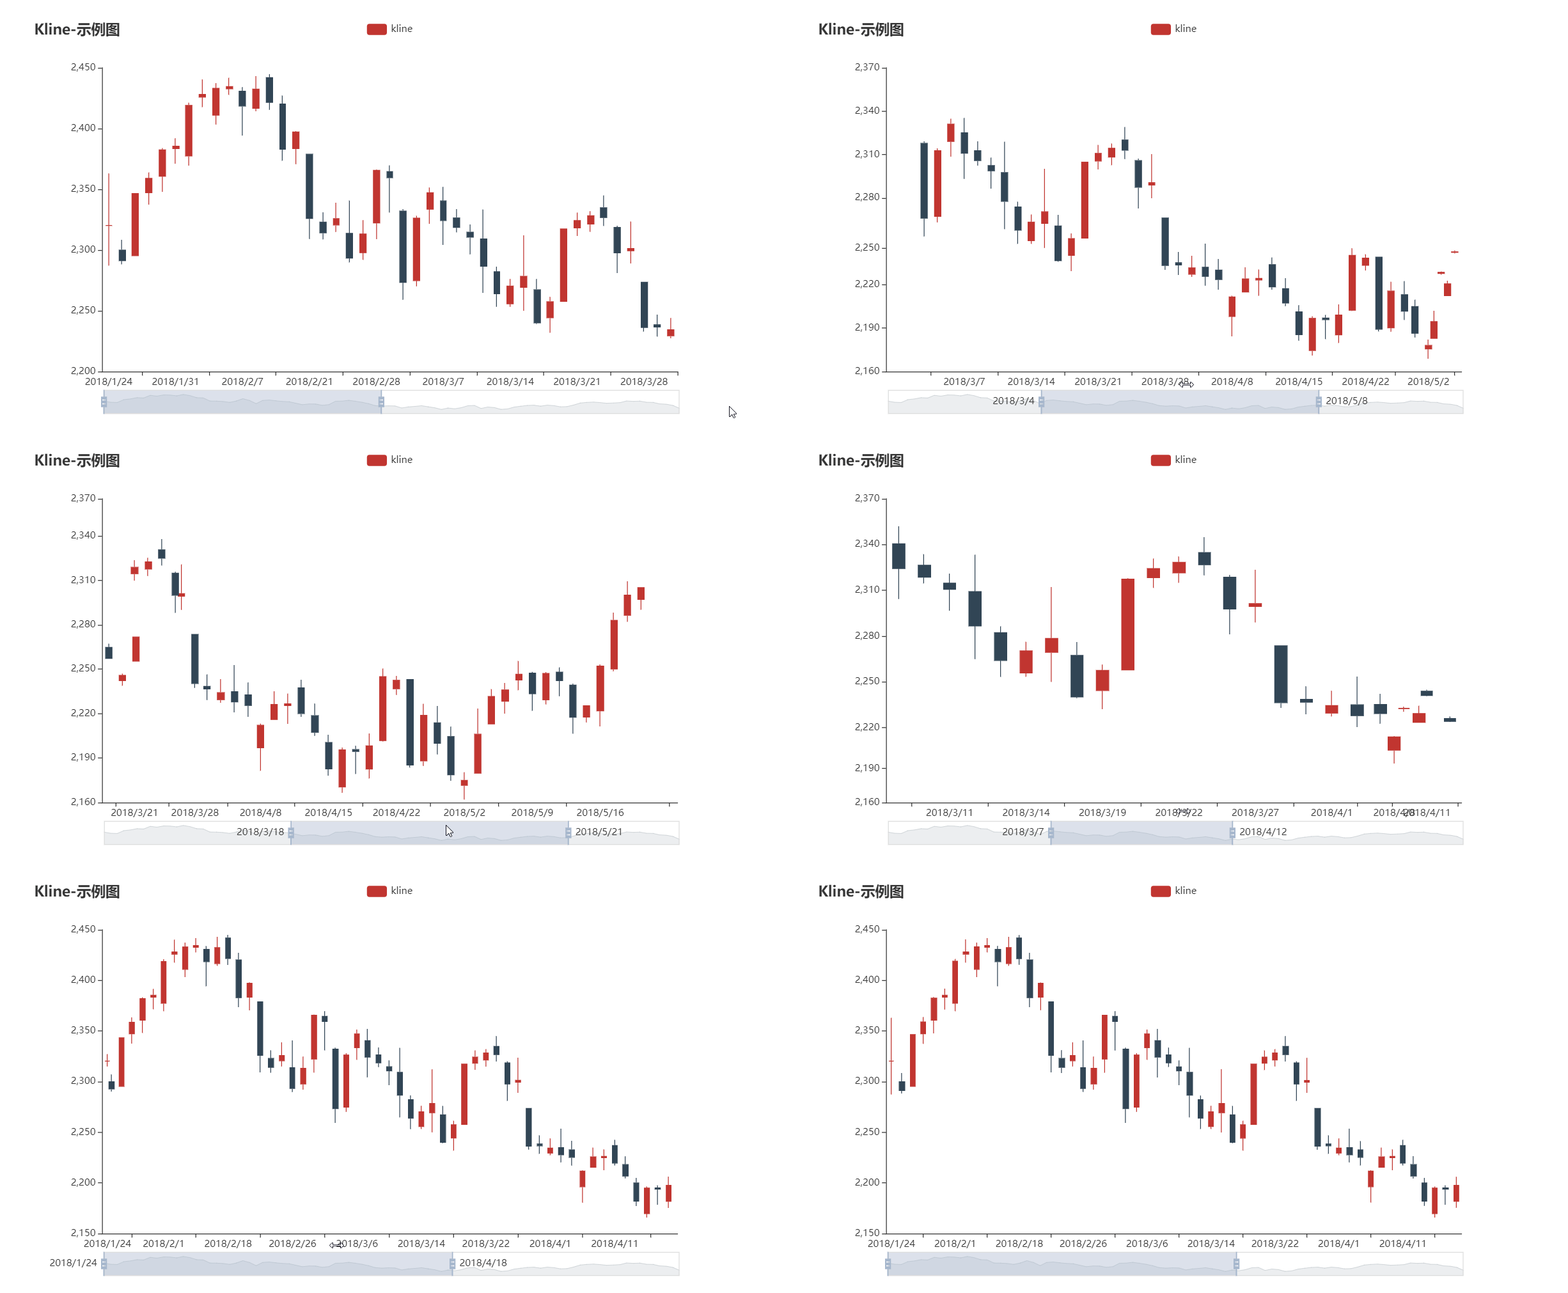
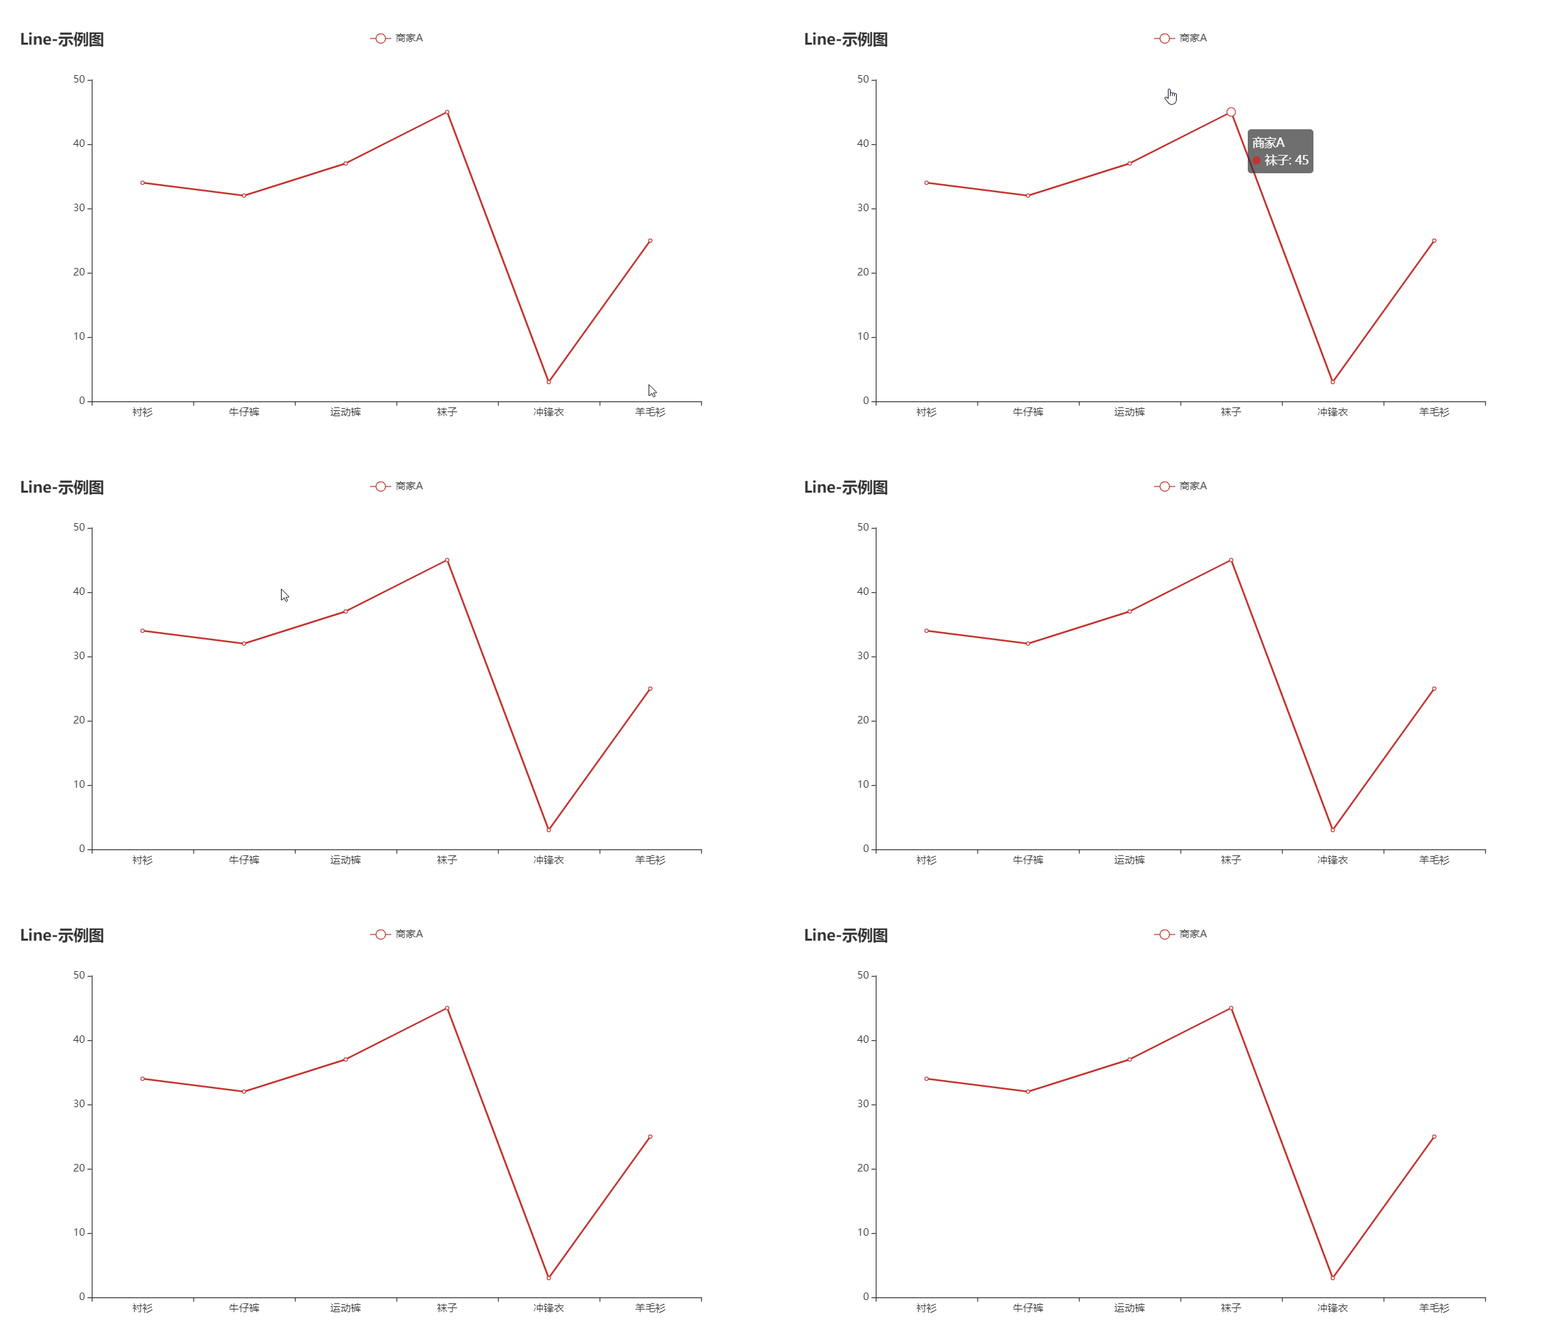
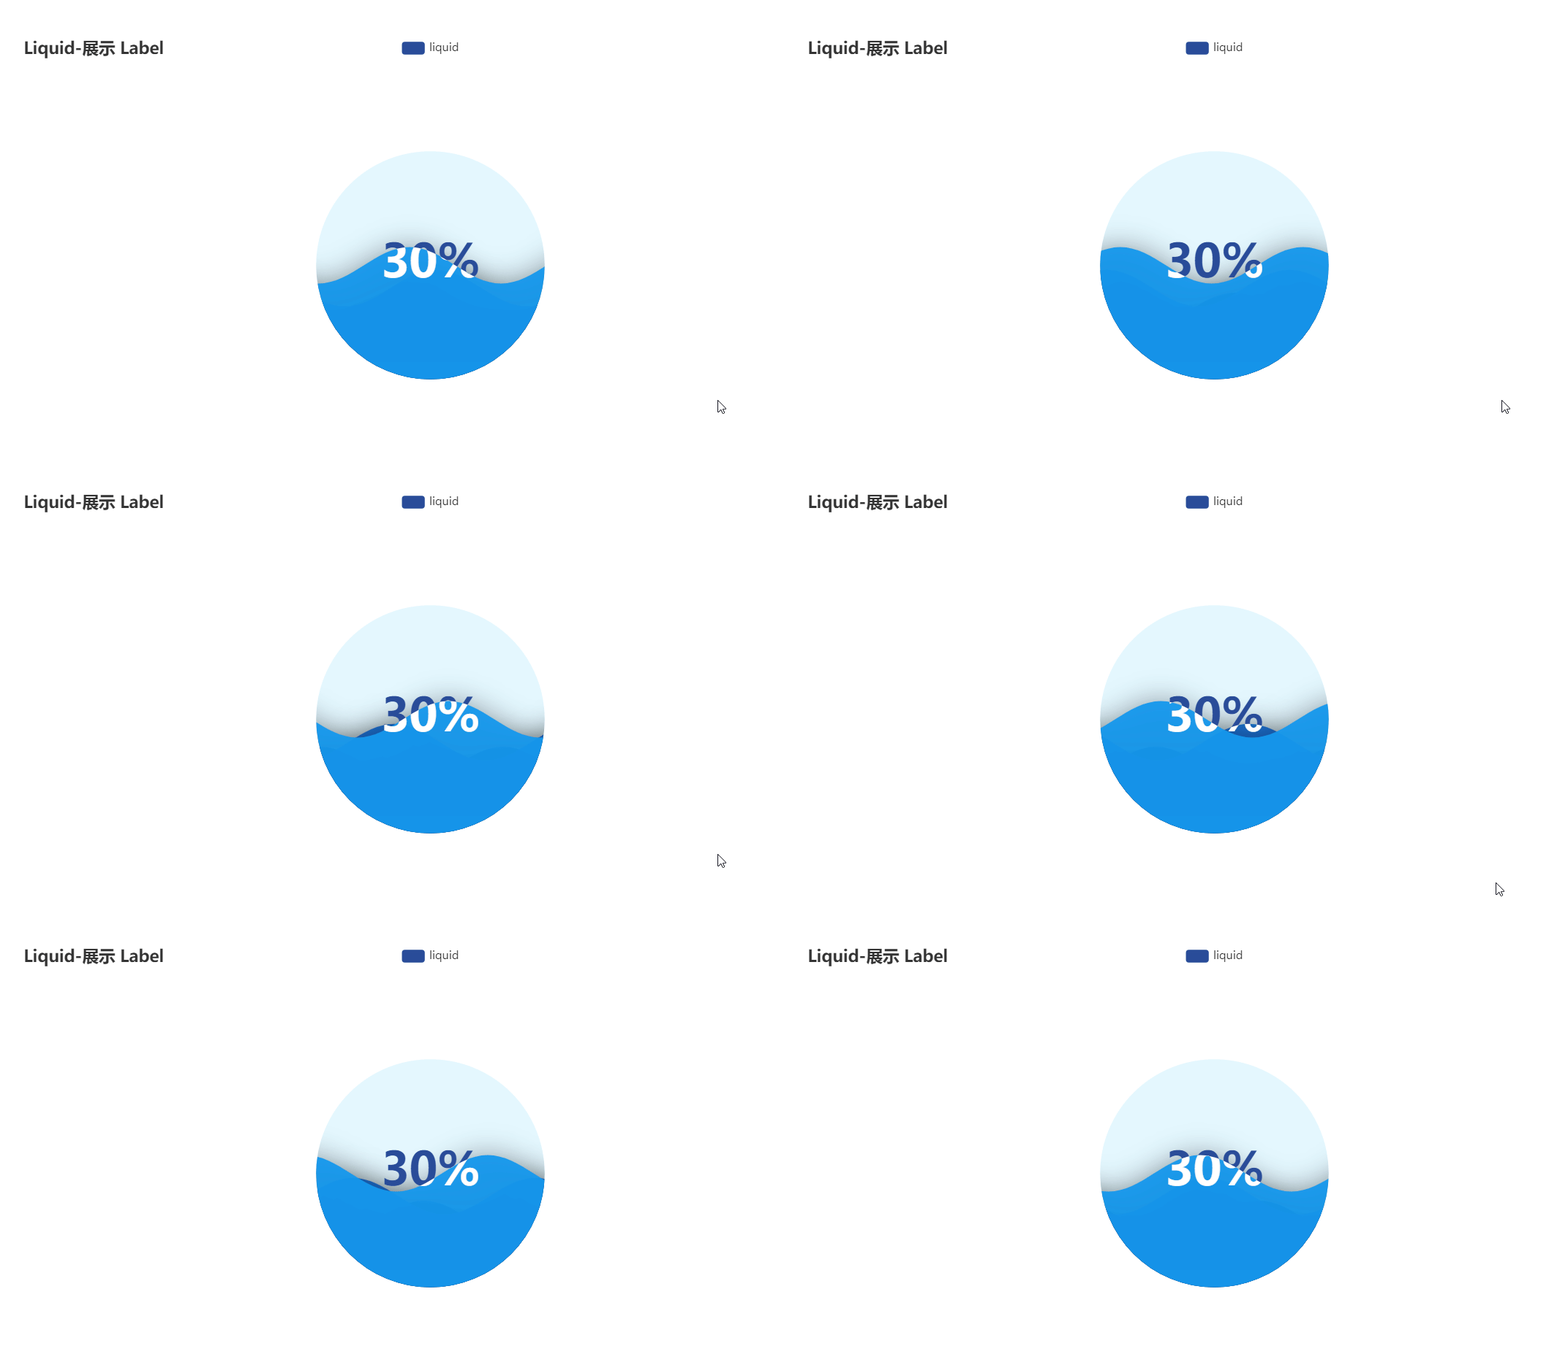
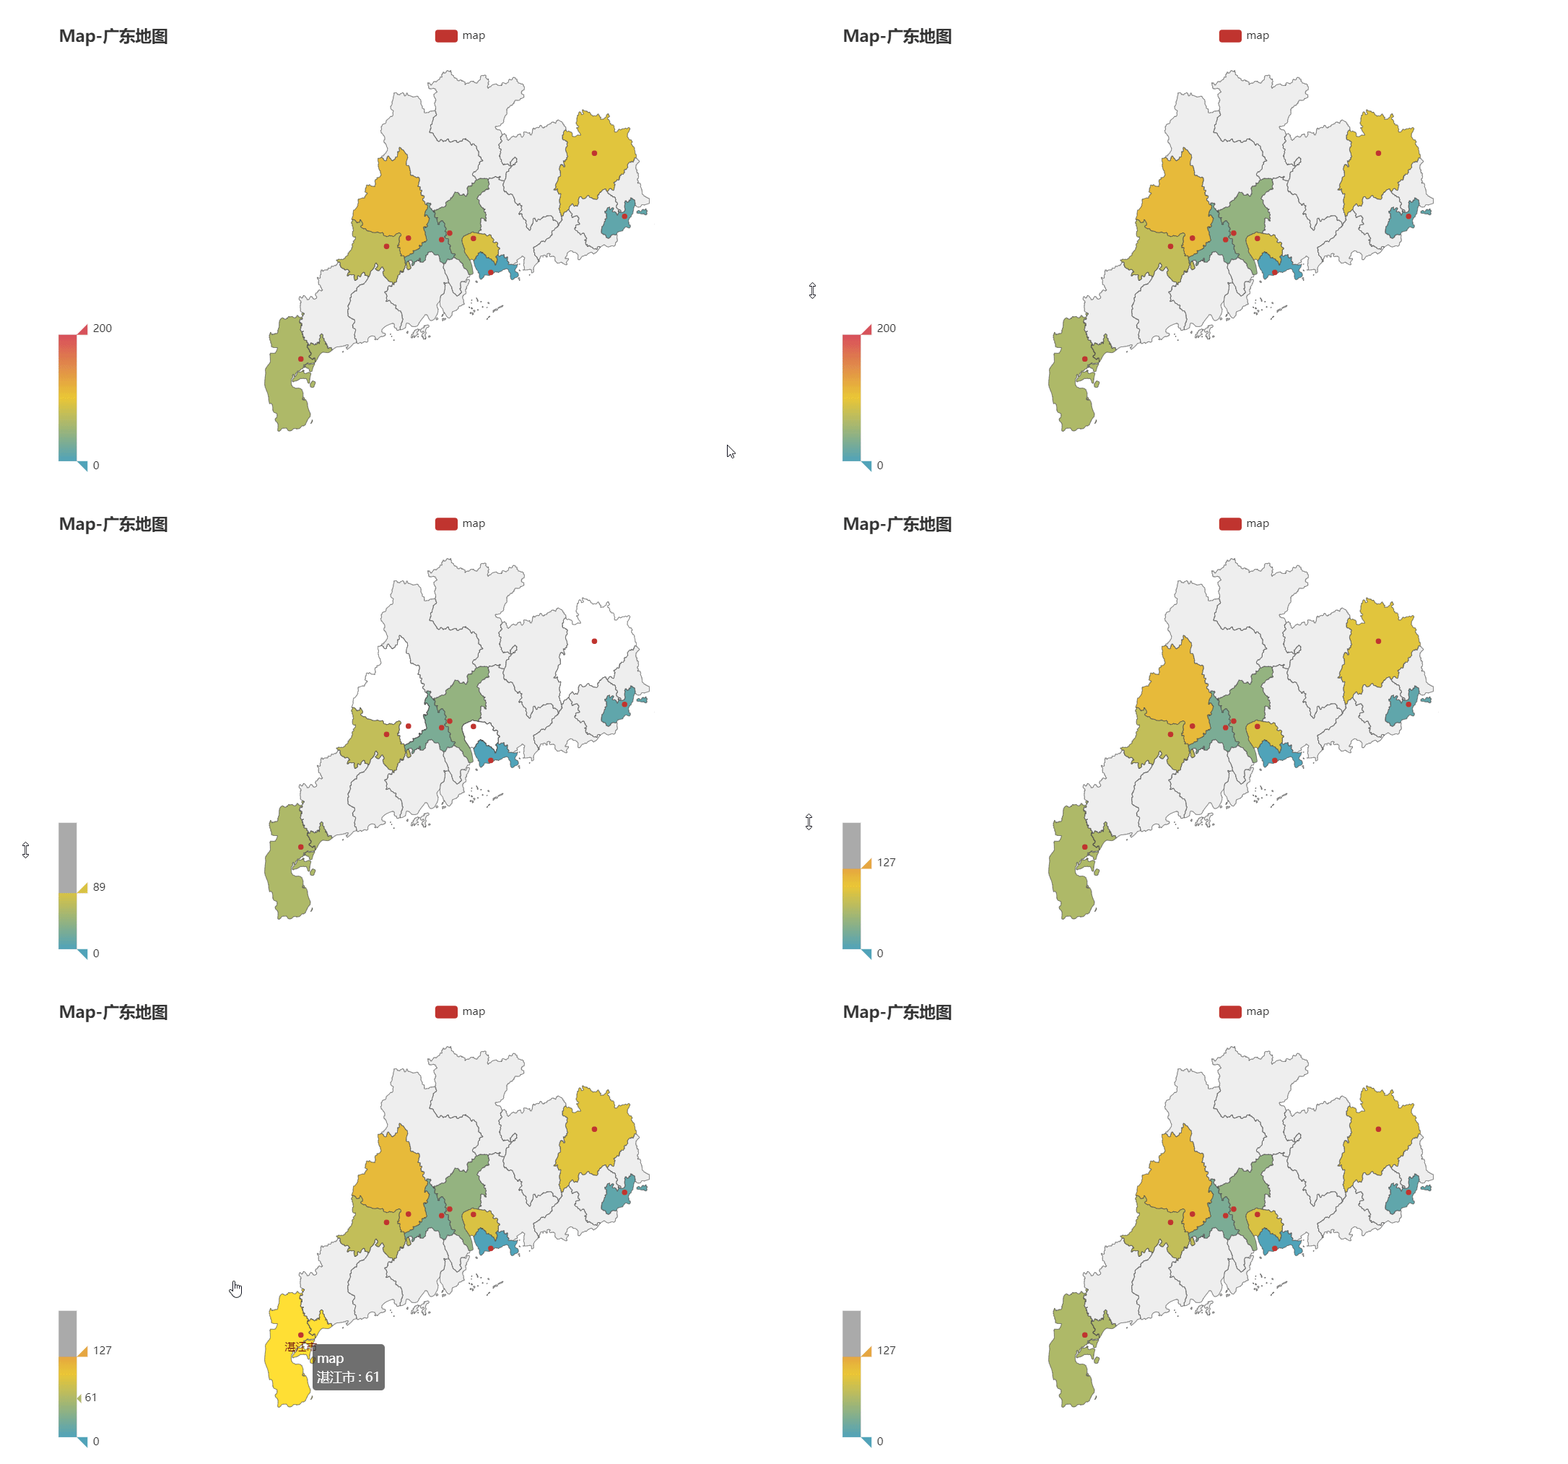
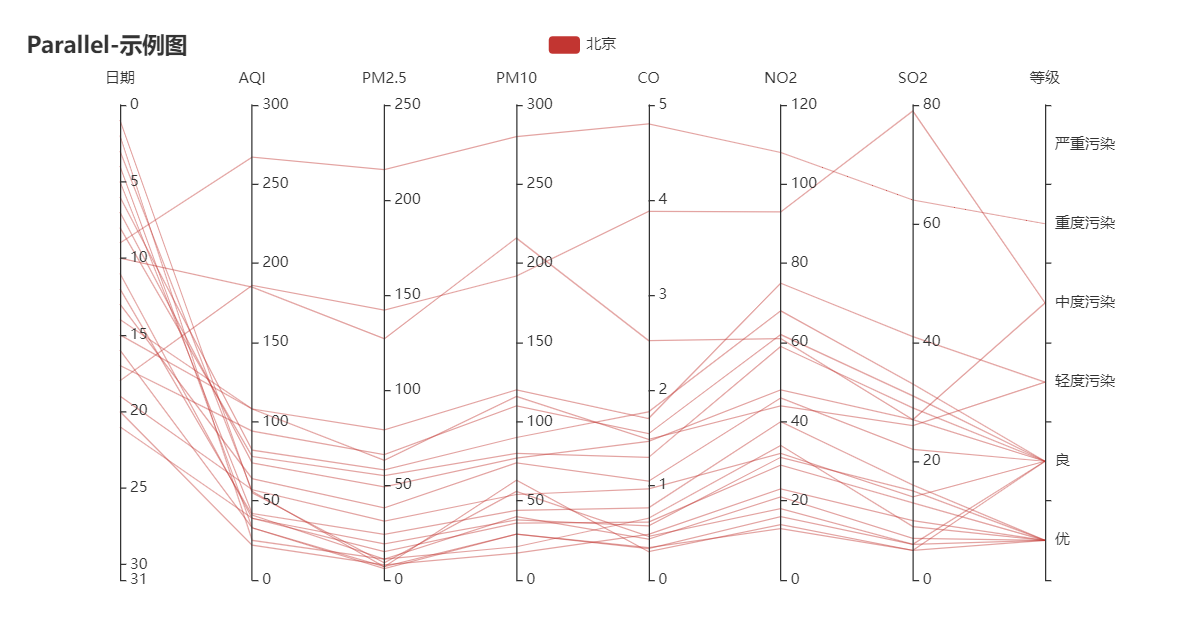
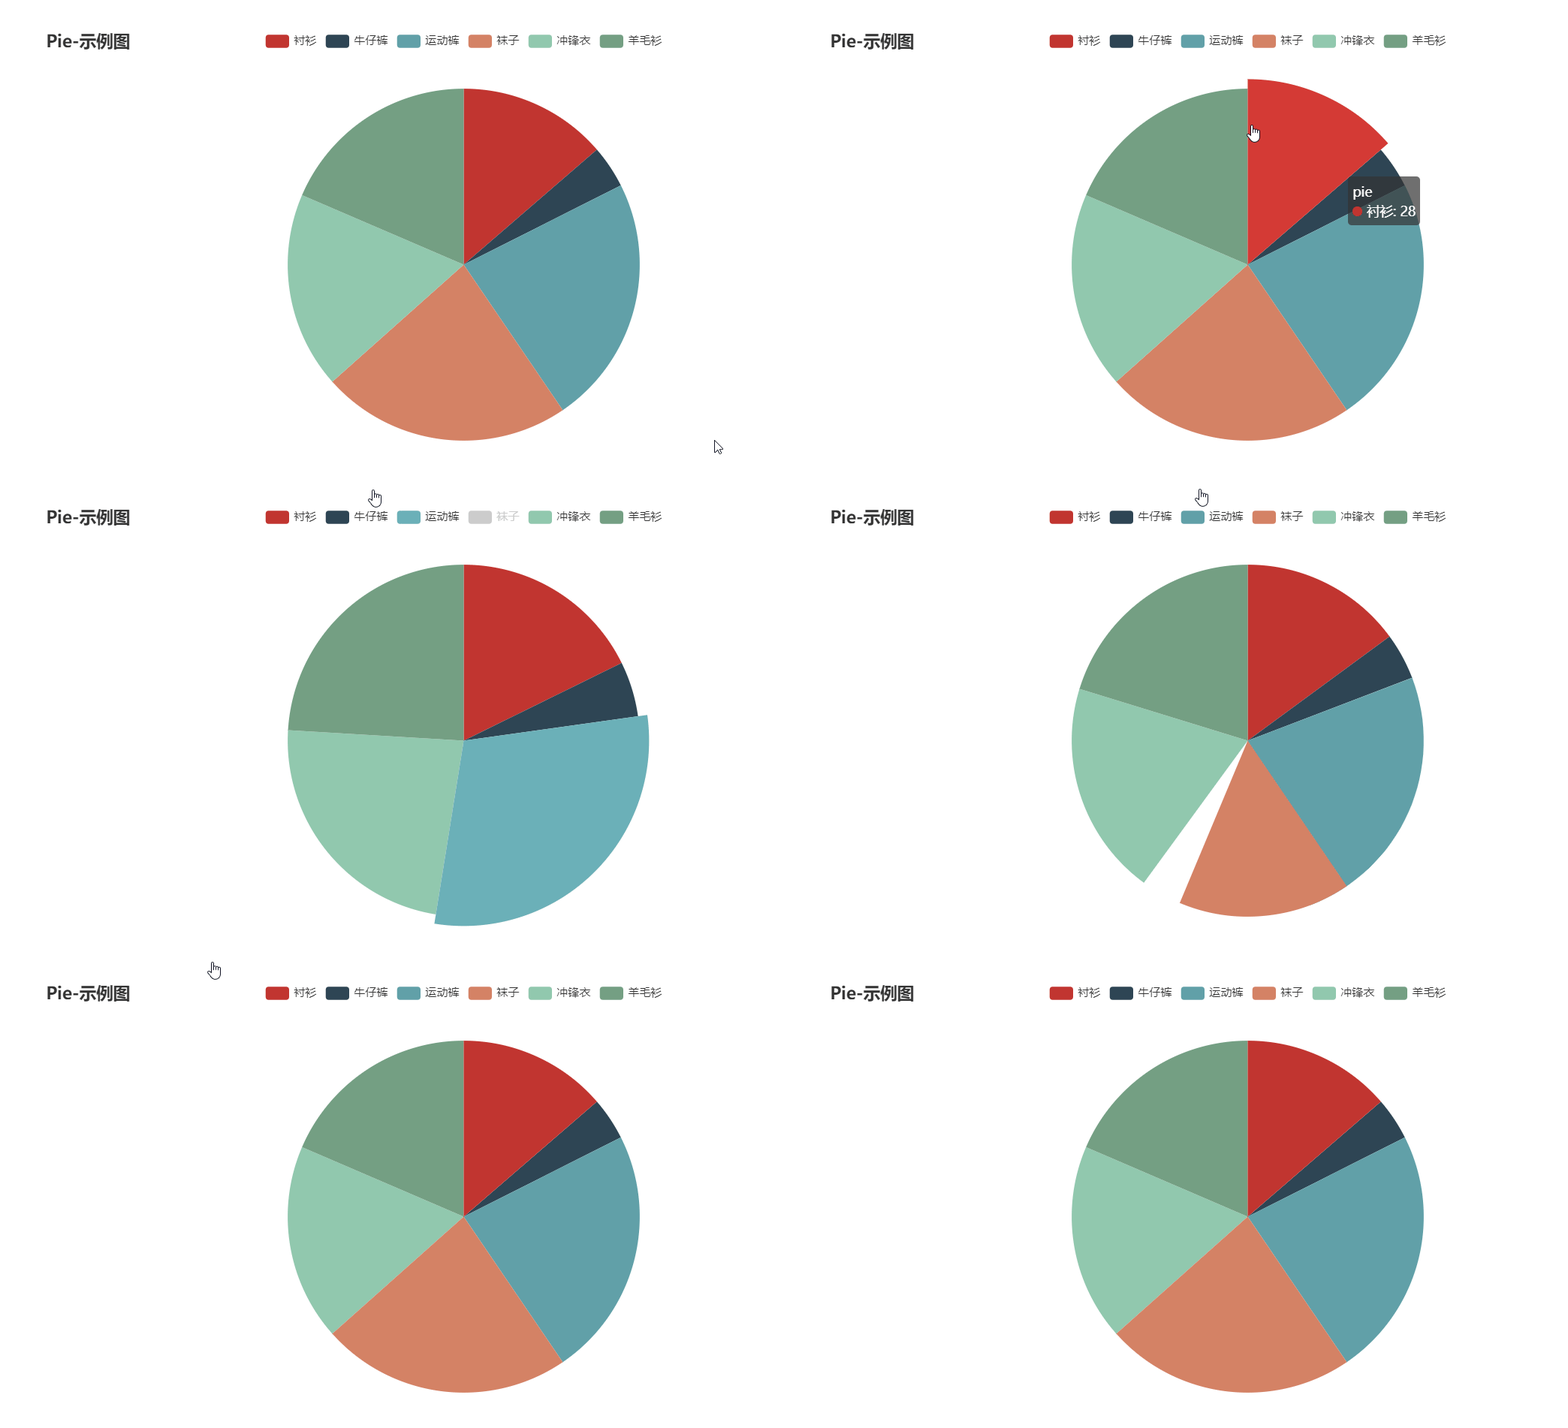
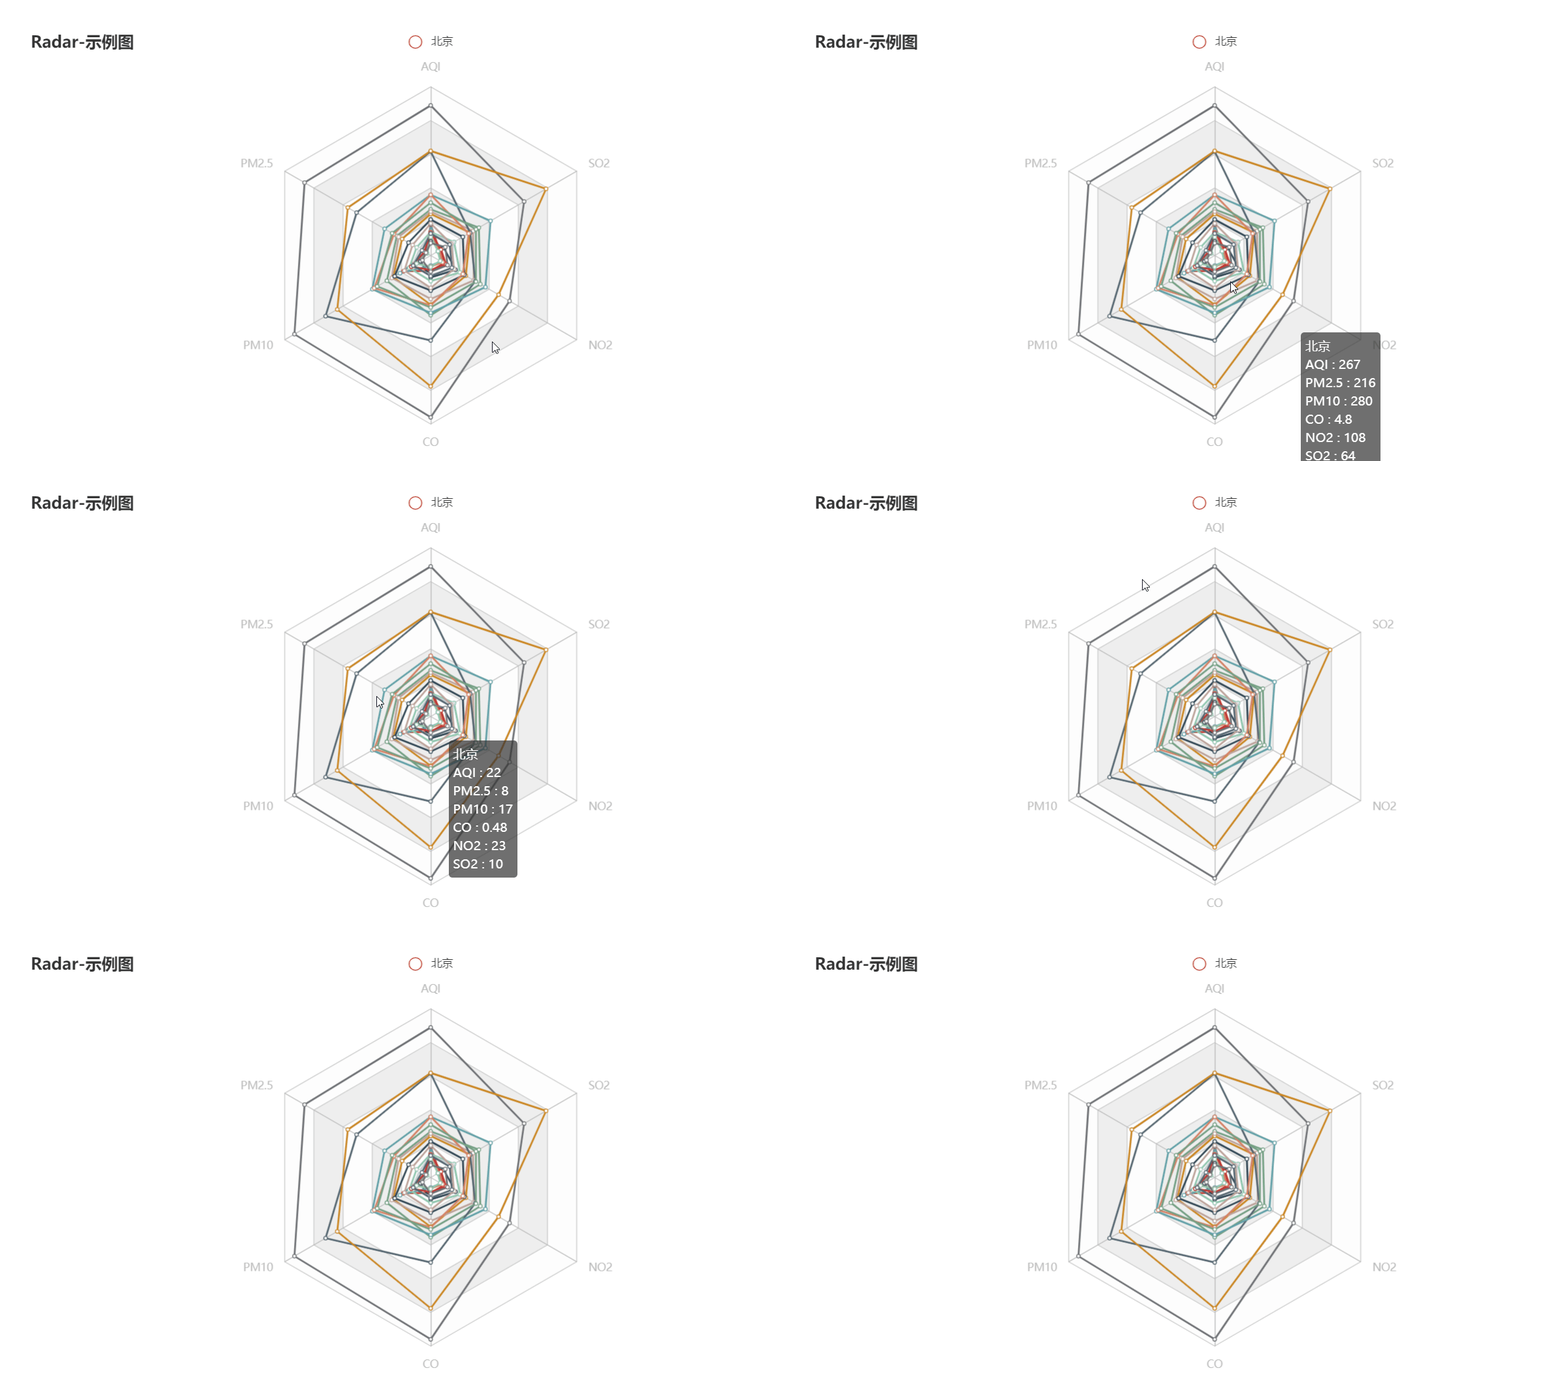
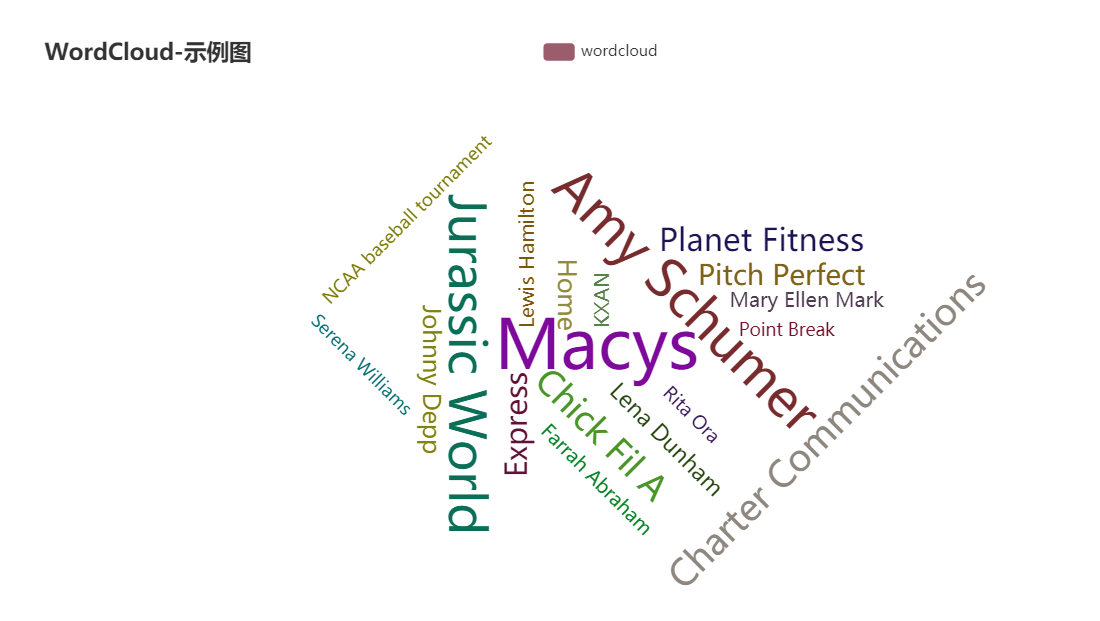
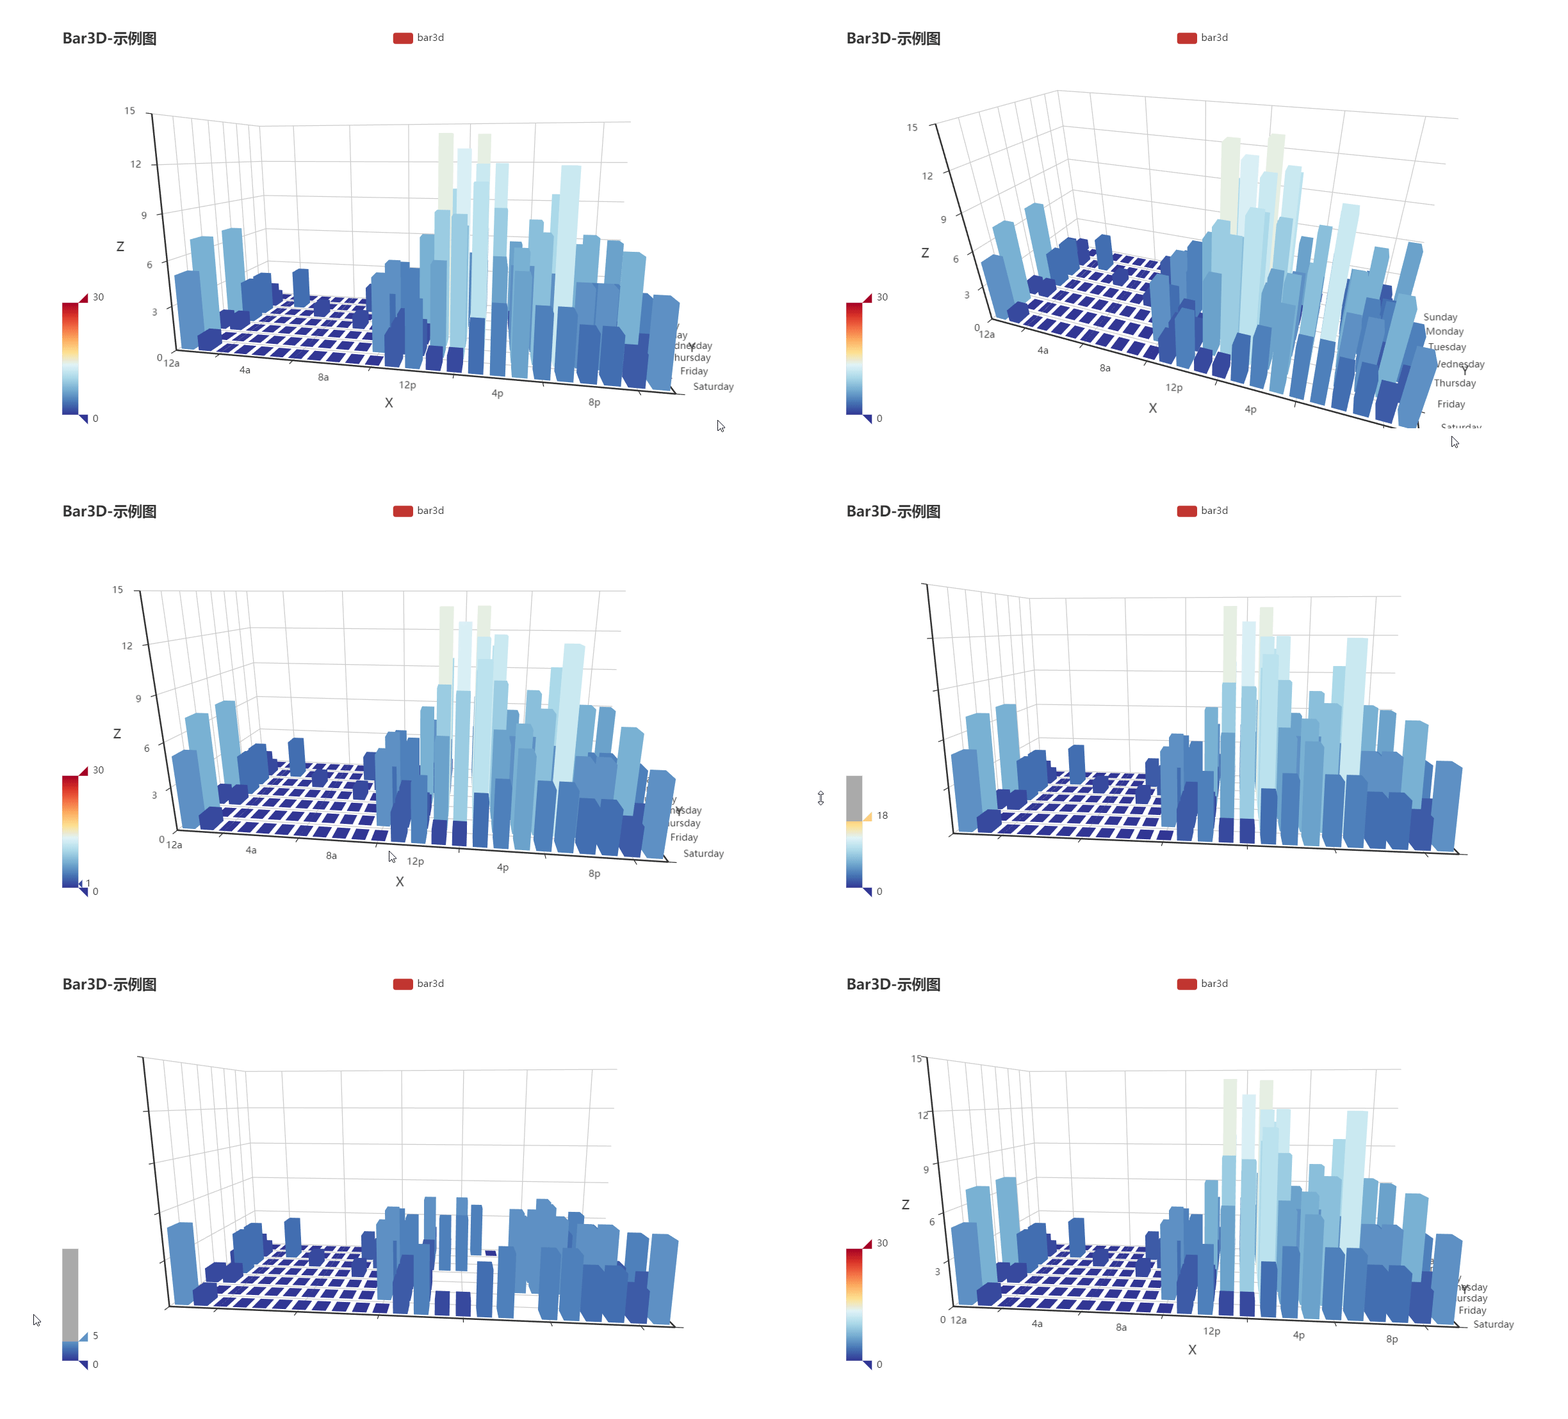
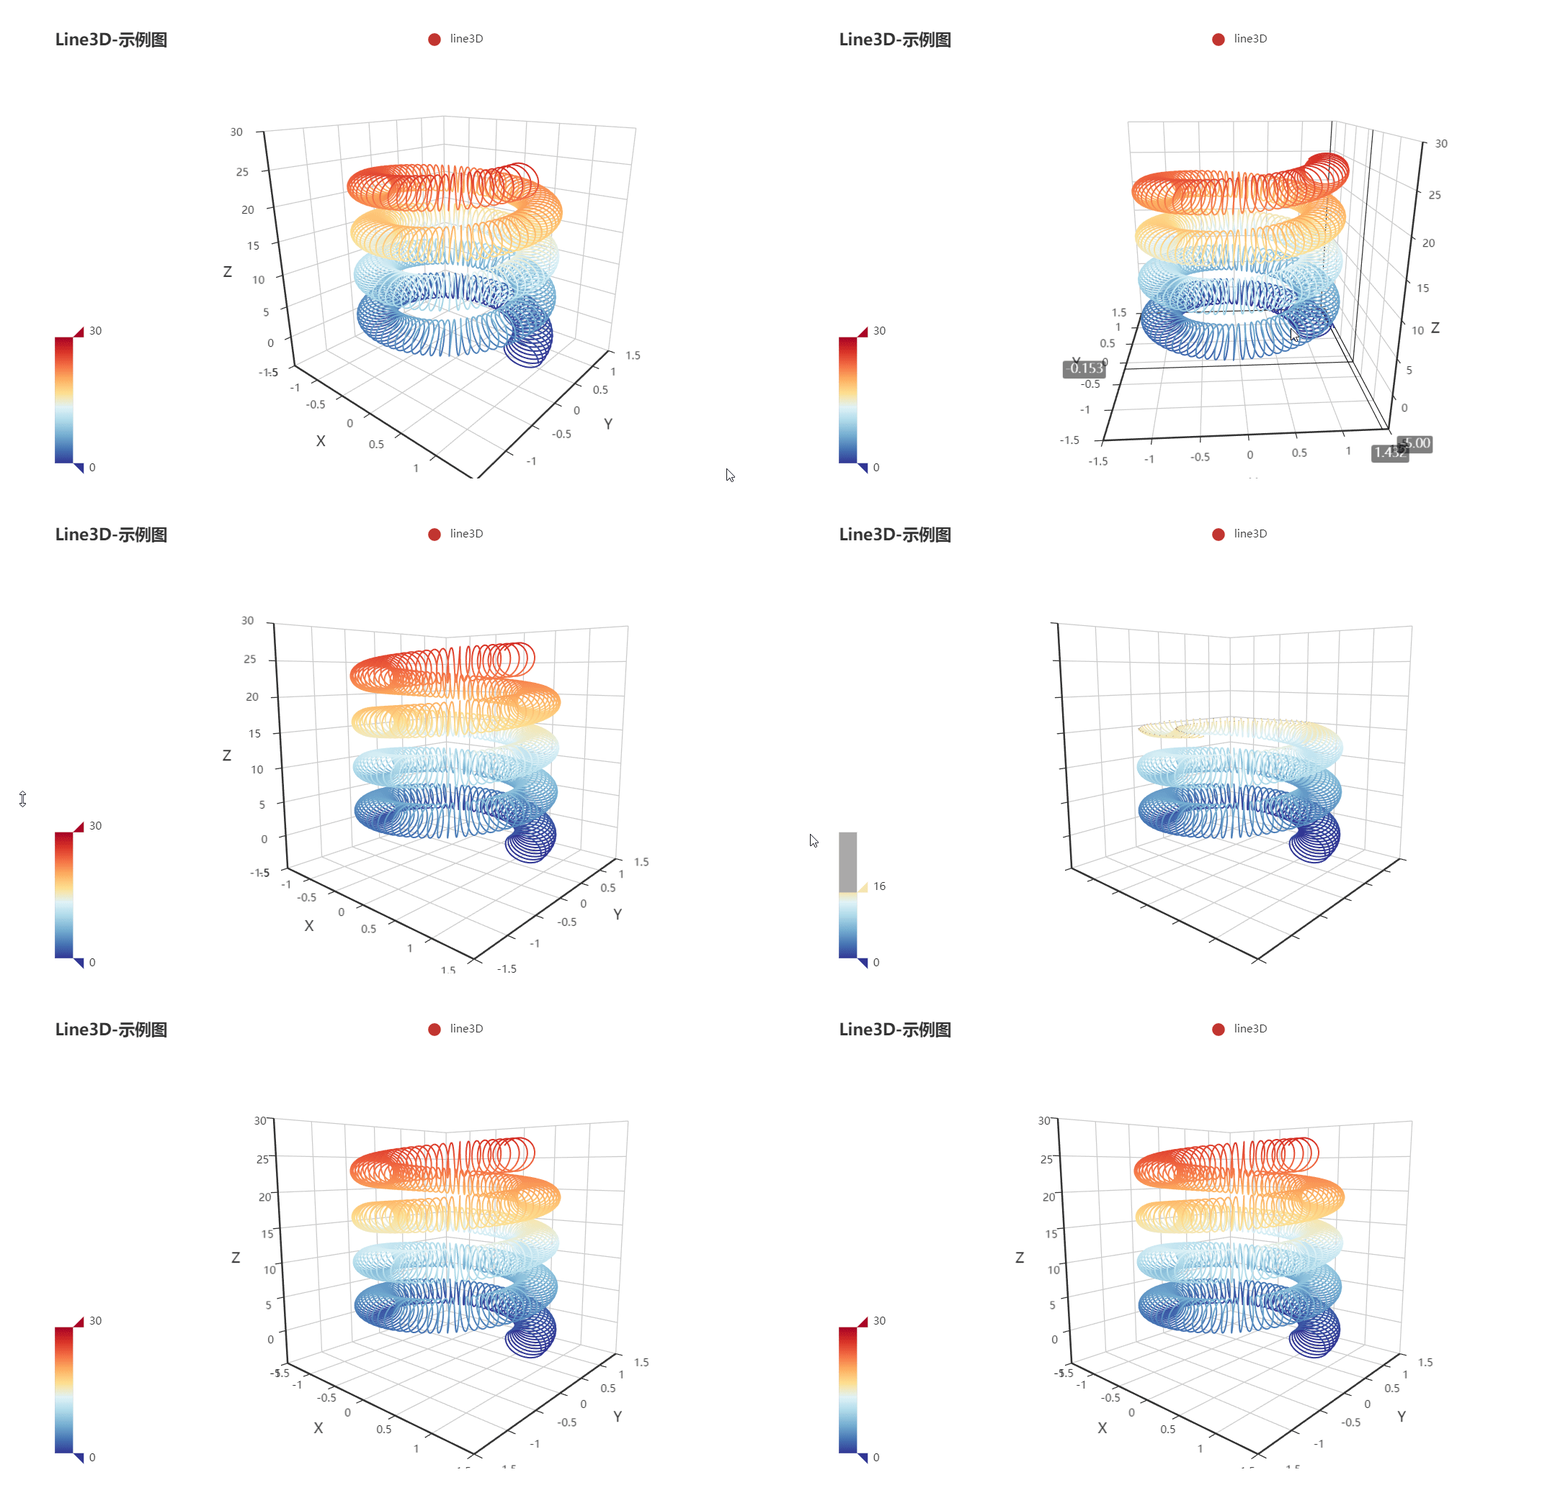
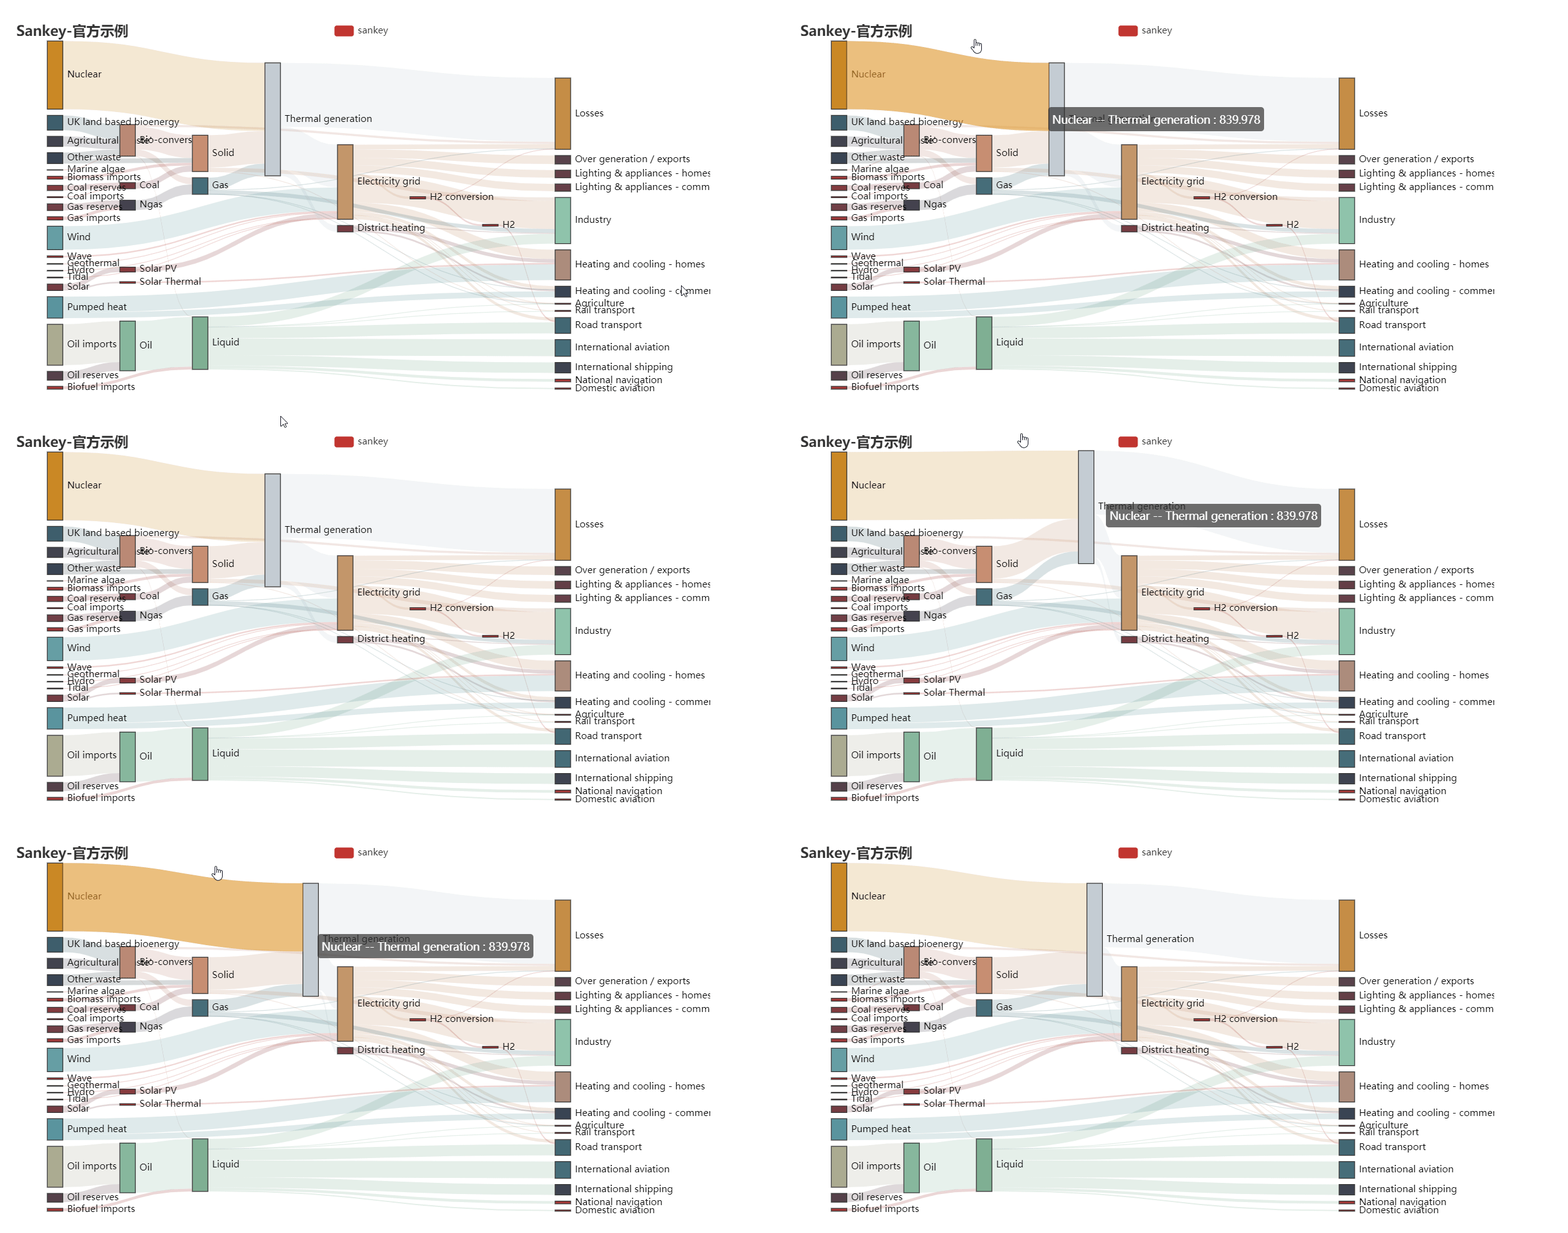
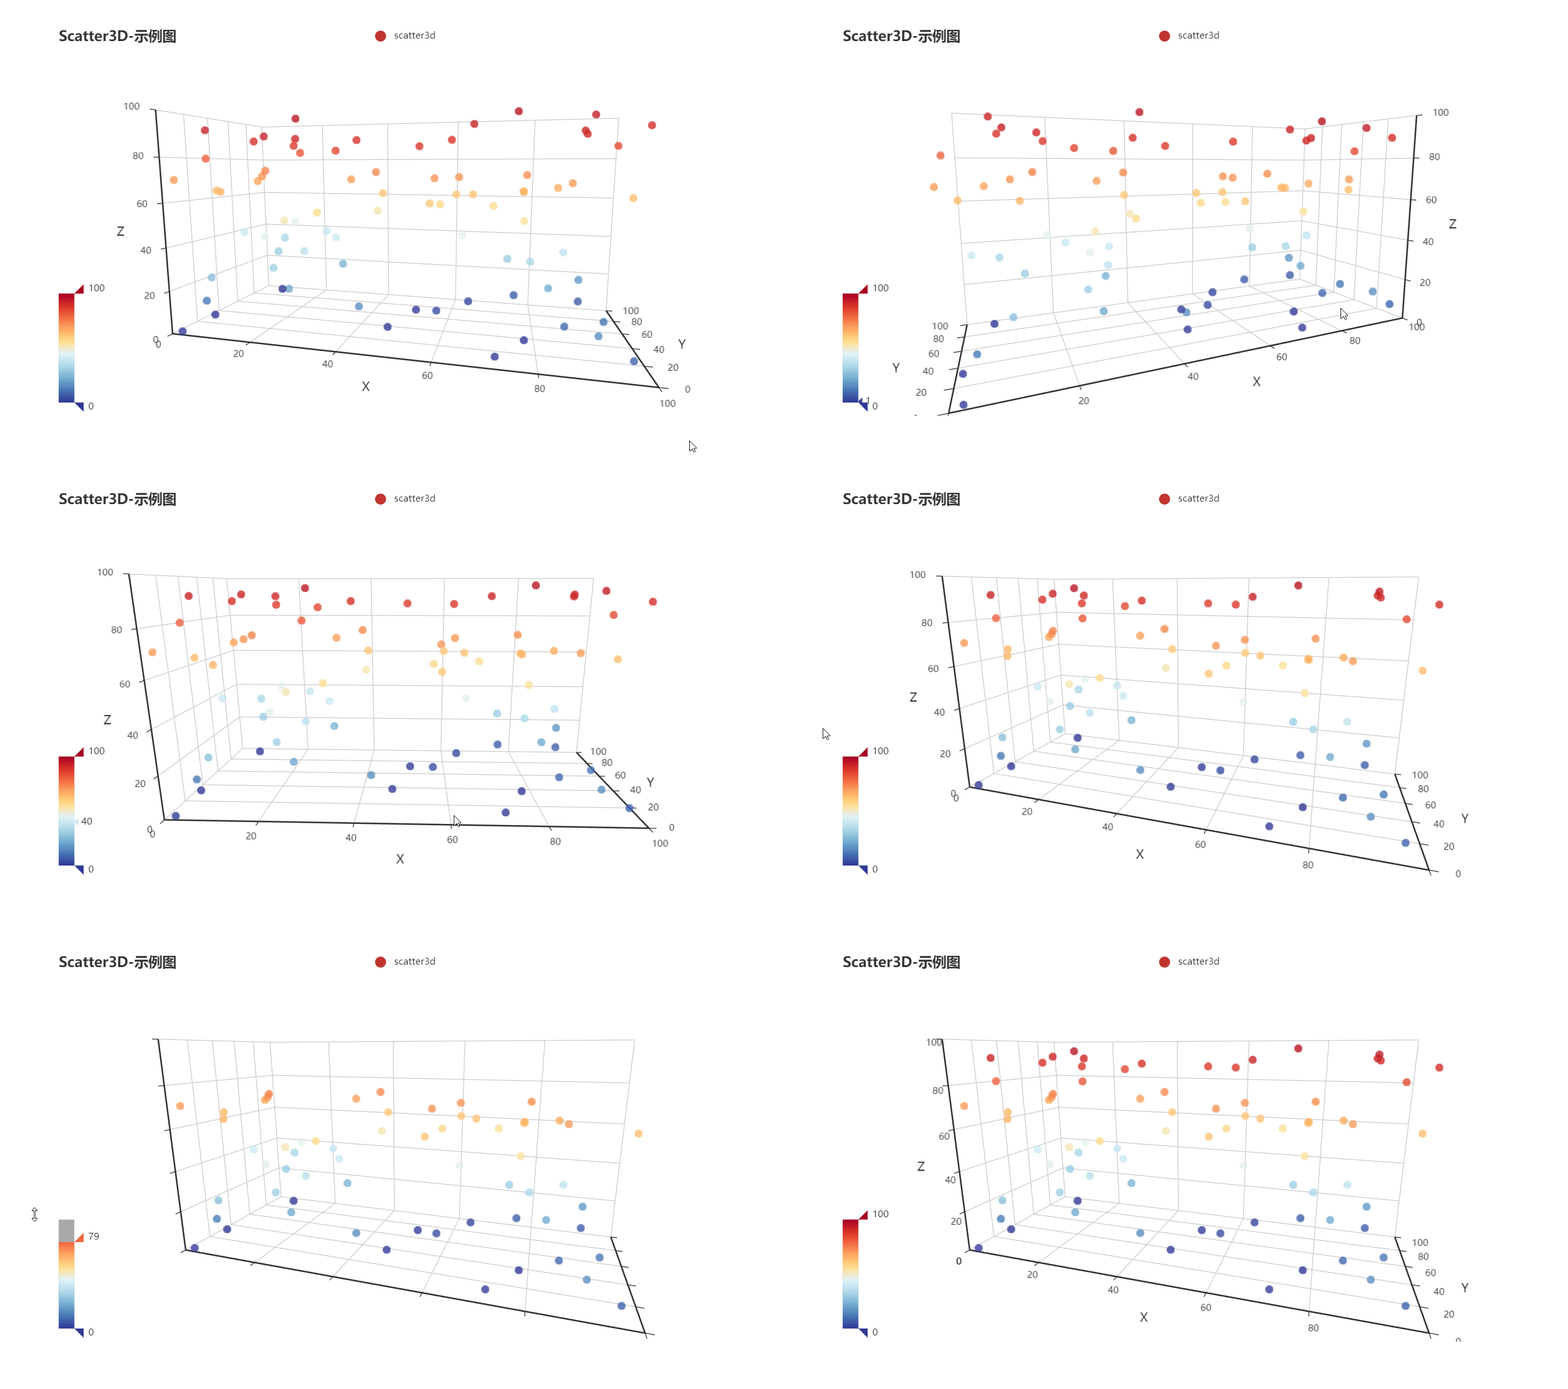
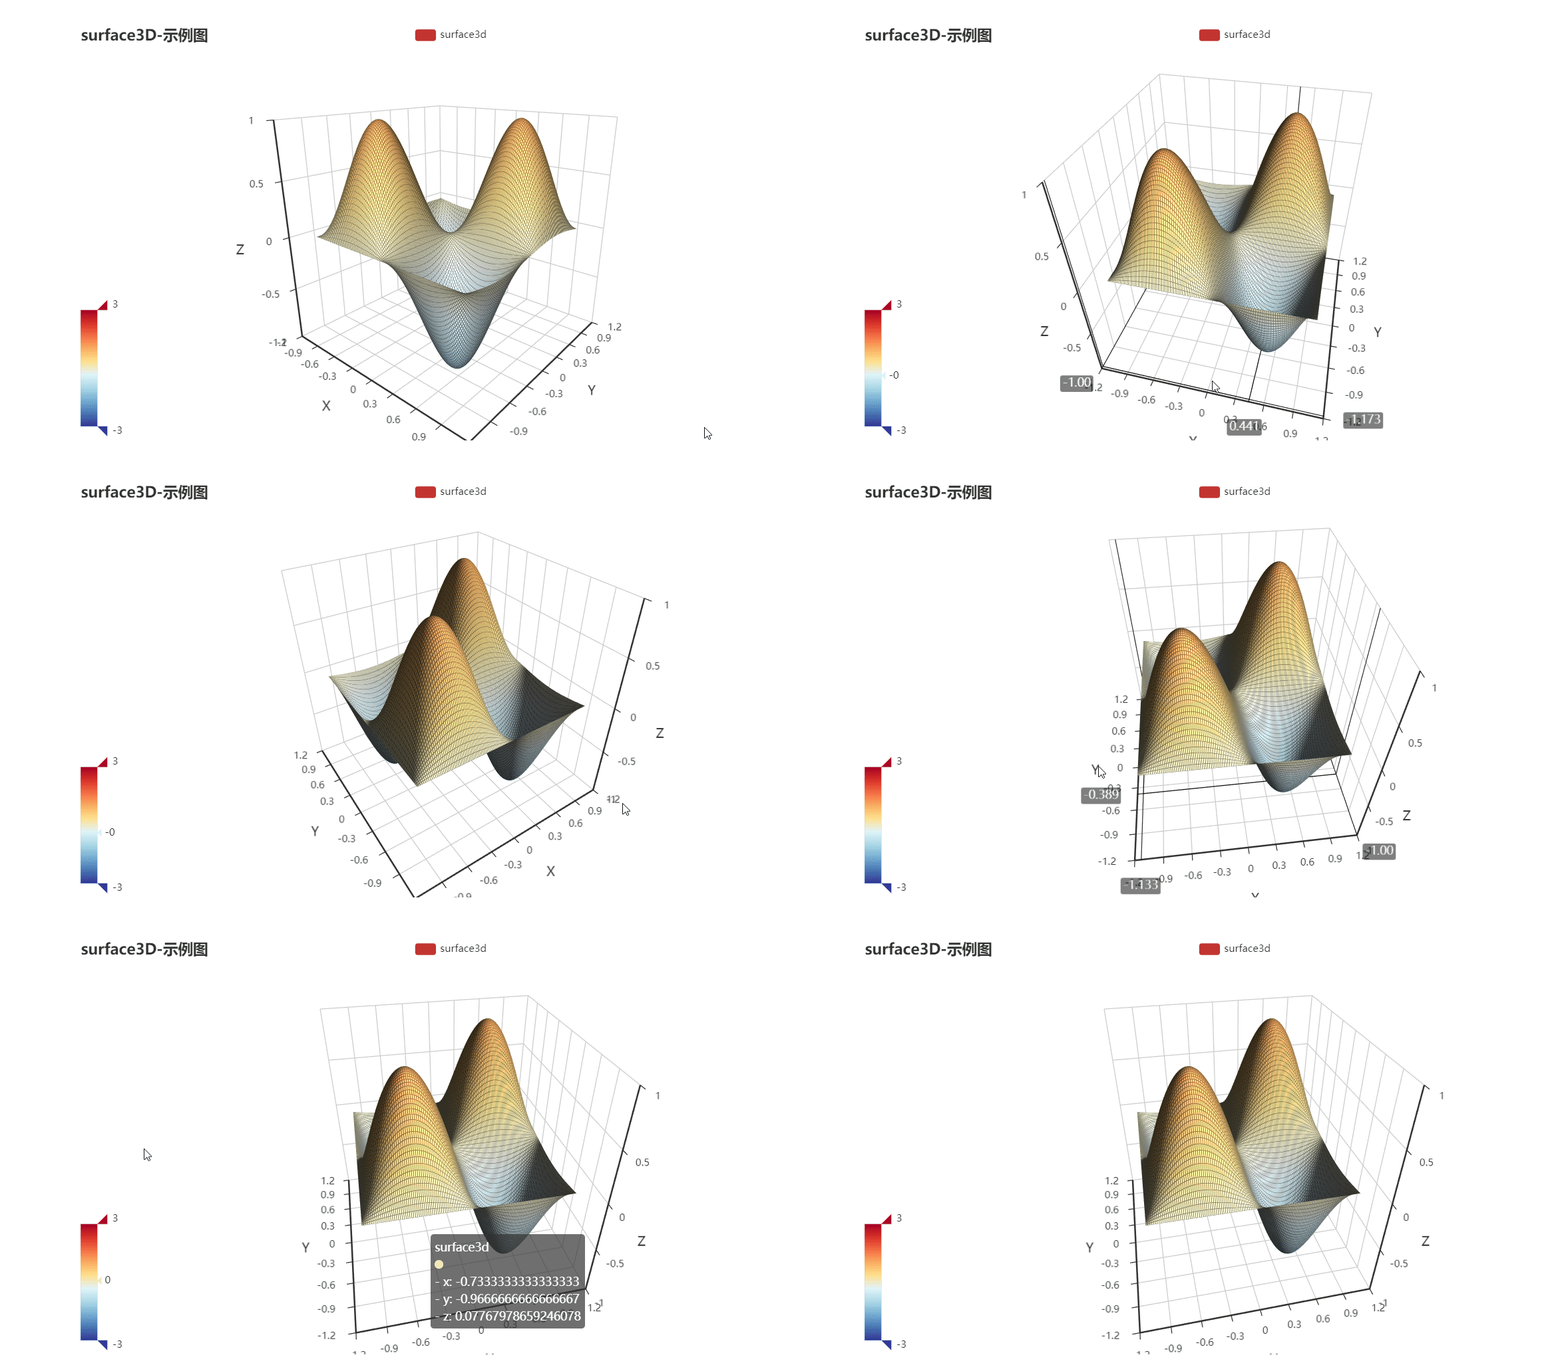
bar boxplot effectScatter funnel gague geo graph heatmap kline line liquid map parallel pie radar scatter wordCloud bar3D line3D sankey scatter3D surface3D themeRiver overlap

For more information, please refer to handbook, go-echarts/examples and the GoDoc.

Ecosystem

The section lists awesome projects which integrate with go-echarts specially.

  • templ A language for writing HTML user interfaces in Go. You can use go-echarts as its components.
  • GoNB A Go Notebook Kernel for Jupyter. You can run go-echarts inside of it smoothly, see examples.

💡 Contribution

go-echarts is an open source project and built on the top of other open-source projects. Welcome all the kinds of contributions. No matter it is for typo fix, bug fix or big new features. Please do not hesitate to ask a question or send a pull request.

We strongly value documentation and integration with other projects, so we are very glad to accept improvements for these aspects.

❤️ Contributors

contributors

📃 License

MIT ©go-echarts
go-echarts's People

Contributors

andreziviani avatar bestgopher avatar chenjiandongx avatar chutommy avatar dependabot[bot] avatar dermetfan avatar dominc8 avatar dzen-it avatar electricbubble avatar evangwt avatar geange avatar ignotas avatar ilvsx avatar james-zhang-gb avatar koooooo-7 avatar l-we avatar live77 avatar lj-software avatar maribowman avatar mitar avatar nikhaild avatar pasdam avatar r2p2 avatar simachri avatar susiwen8 avatar updogliu avatar yangrq1018 avatar yuankunzhang avatar zengyifei avatar zzhang27 avatar

Stargazers

 avatar  avatar  avatar  avatar  avatar  avatar  avatar  avatar  avatar  avatar  avatar  avatar  avatar  avatar  avatar  avatar  avatar  avatar  avatar  avatar  avatar  avatar  avatar  avatar  avatar  avatar  avatar  avatar  avatar  avatar  avatar  avatar  avatar  avatar  avatar  avatar  avatar  avatar  avatar  avatar  avatar  avatar  avatar  avatar  avatar  avatar  avatar  avatar  avatar  avatar  avatar  avatar  avatar  avatar  avatar  avatar  avatar  avatar  avatar  avatar  avatar  avatar  avatar  avatar  avatar  avatar  avatar  avatar  avatar  avatar  avatar  avatar  avatar  avatar  avatar  avatar  avatar  avatar  avatar  avatar  avatar  avatar  avatar  avatar  avatar  avatar  avatar  avatar  avatar  avatar  avatar  avatar  avatar  avatar  avatar  avatar  avatar  avatar  avatar  avatar

Watchers

 avatar  avatar  avatar  avatar  avatar  avatar  avatar  avatar  avatar  avatar  avatar  avatar  avatar  avatar  avatar  avatar  avatar  avatar  avatar  avatar  avatar  avatar  avatar  avatar  avatar  avatar  avatar  avatar  avatar  avatar  avatar  avatar  avatar  avatar  avatar  avatar  avatar  avatar  avatar  avatar  avatar  avatar  avatar  avatar  avatar  avatar  avatar  avatar  avatar  avatar  avatar  avatar  avatar  avatar  avatar  avatar  avatar  avatar  avatar  avatar  avatar  avatar  avatar  avatar  avatar  avatar  avatar  avatar  avatar  avatar  avatar  avatar  avatar  avatar  avatar  avatar  avatar  avatar  avatar  avatar  avatar  avatar  avatar  avatar  avatar  avatar  avatar  avatar  avatar  avatar  avatar

go-echarts's Issues

add gauge

可以考虑添加echart的汽车仪表盘吗?
echart 的汽车仪表盘支持3个仪表显示

copy example to others,packr load templates error:CreateFile D:\...

Compile example and test the exe file on others

packr load templates error:CreateFile D:\Go\src\github.com\chenjiandongx\go-echarts\templates\routers.html

the Path in others PC "...\go-echarts\templates\routers.html" cannot find .
Why is absolute path rather than relative path?
Can't I copy the past together and run it locally?

package templates

import (
	"io/ioutil"
	"log"
	"net/http"

	"github.com/gobuffalo/packr"
)

var BaseTpl, ChartTpl, HeaderTpl, PageTpl, RoutersTpl string

func init() {
	box := packr.NewBox(".")

	var err error
	BaseTpl, err = box.FindString("base.html")
	ChartTpl, err = box.FindString("chart.html")
	HeaderTpl, err = box.FindString("header.html")
	PageTpl, err = box.FindString("page.html")
	RoutersTpl, err = box.FindString("routers.html")

	if err != nil {
		log.Printf("packr load templates error: %v", err)
	}
}

ps: Tracing request for /favicon.ico
I didn't find this icon on the page. Does it work?

multiline-line title 过多遮盖line图

使用line类型画图,同张图上线太多,线的title铺满了整个line的坐标图。请问这个有什么处理方法吗?或者有设置项让其和river图似得,移动鼠标会显示各个线的x值和y值?

TooltipOpts僅提供中文嗎?Are TooltipOpts only available in Chinese?

––––– English version below ––––

你好 !

感謝您提供的精彩庫,到目前為止,我發現它非常有幫助。

image

的文字疊加層是否僅提供中文? 是否可以將它們配置為使用瀏覽器語言或英語?

如果可以為我提供適當的代碼,我可以考慮向您發送拉取請求以添加該功能(如果該功能今天不存在)。

謝謝。

Hello!

Thank you for the wonderful library, so far I've found it very helpful.

image

Are the text overlays for TooltipOpts only available in Chinese? Is it possible to configure them to use the browser language or English?

If you could point me to the appropriate code, I can look into sending you a pull request to add the feature if it doesn't exist today.

Thank you!

执行 ./doPackr.sh 出错

[root@localhost go-echarts]# ./doPackr.sh
sed:无法读取 /.go"/d:没有那个文件或目录

前端代码是否耦合度太高

您好:
现在是基于golang 的echarts类型将结果直接write成html file ,能否新增其他的output 类型,例如:svg image 甚至struct数据结构(交由js自行load)
期待您的更新

Feature Request: workflow diagram

Hi

Firstly this project is great.

I am after a feature of a workflow diagram.

Currently, the most matching chart is the sankey chart, but I'd like the chart to use arrow instead of stream.

Also,it would be great to have these:

  1. make the bar shape flexible, can be a round circle
  2. allow a selected colour for a node

I am attaching the example. Let me know if you need more explanation.

image

Requested Feature workflow diagram:

image

谢谢

Please add support for directed graphs

Hello would you please consider adding the following variables to the graph chart functionality so that directed graphs can be visualized clearly.

Add to series.go > singleSeries struct (line 201) > Graph Charts (line 219)

EdgeSymbol []string json:"edgeSymbol,omitempty"
EdgeSymbolSize []float32 json:"edgeSymbolSize,omitempty"

// GraphOpts is the option set for graph chart.
type GraphOpts struct {
	//图的布局。可选:
	// "none" 不采用任何布局,使用节点中提供的 x, y 作为节点的位置。
	// "circular" 采用环形布局
	// "force" 采用力引导布局
	Layout string
	// "force", "circular" 布局详细配置项
	Force GraphForce
	// 是否开启鼠标缩放和平移漫游。默认不开启。
	Roam bool
	// 是否在鼠标移到节点上的时候突出显示节点以及节点的边和邻接节点
	FocusNodeAdjacency bool
	//
	Categories []GraphCategory
	// slice of edge symbols for directed graph support [source, target]
	// ["circle","arrow"] for directed link source -> target
	// ["arrow","circle"] for directed link source <- target
	EdgeSymbol []string
	// slice for edge symbol sizes in [source, target] link order
	// [5, 20]
	EdgeSymbolSize []float32

Add to graph.go > GraphOpts struct (line 74)

EdgeSymbol []string
EdgeSymbolSize []float32

// Graph charts
	Links              interface{}     `json:"links,omitempty"`
	Layout             string          `json:"layout,omitempty"`
	Force              GraphForce      `json:"force,omitempty"`
	Categories         []GraphCategory `json:"categories,omitempty"`
	Roam               bool            `json:"roam,omitempty"`
	FocusNodeAdjacency bool            `json:"focusNodeAdjacency,omitempty"`
	EdgeSymbol         []string        `json:"edgeSymbol,omitempty"`
	EdgeSymbolSize     []float32       `json:"edgeSymbolSize,omitempty"`

How to get e-chart compatitable Options as JSON from chart object ?

As I understood from exploring china docs (khe, khe....), the are possibilities to render your chart to the predefined templates.

In my project I need to get only JSON data that represents whole chart and save it as string.

I understands that i can rewrite templates, but with current architecture I would need to refactor whole library or write my own.

Is it possible to get JSON chart representation or not?

charts: renderToWriter signature

instead of:

func renderToWriter(chart interface{}, renderName string, removeStr []string, w ...io.Writer) error {...}

func renderToWriter(chart interface{}, renderName string, removeStr []string, w ...io.Writer) error {

I believe it would be better written as:

func renderToWriter(w io.Writer, chart interface{}, renderName string, removeStr []string) error

leaving users to call it with: io.MultiWriter(w1, w2, w3) if they want to.

drill down

Awesome library, thank you.

I am trying on the radar to be able to click on item and create and go to link. Can i use javascript func ( func AddJSFuncs(fn ...string) ), and you have any example how that looks?

pie扇区颜色无法固定

指定了颜色后 每次刷新 扇区的颜色都会随机变化 看了下源码是因为 range map无序的原因导致的
建议Add方法增加一个数组key 来保证顺序

func (c *Pie) Add(name string, data map[string]interface{},keys []string, options ...seriesOptser) *Pie {
nvs := make([]datatypes.NameValueItem, 0)
if keys==nil{
keys= make([]string, 0)
for k, _ := range data {
keys = append(keys, k)
}
}
for _, v := range keys {
nvs = append(nvs, datatypes.NameValueItem{Name: v, Value: data[v]})
}
series := singleSeries{Name: name, Type: ChartType.Pie, Data: nvs}
series.setSingleSeriesOpts(options...)
c.Series = append(c.Series, series)
c.setColor(options...)
return c
}

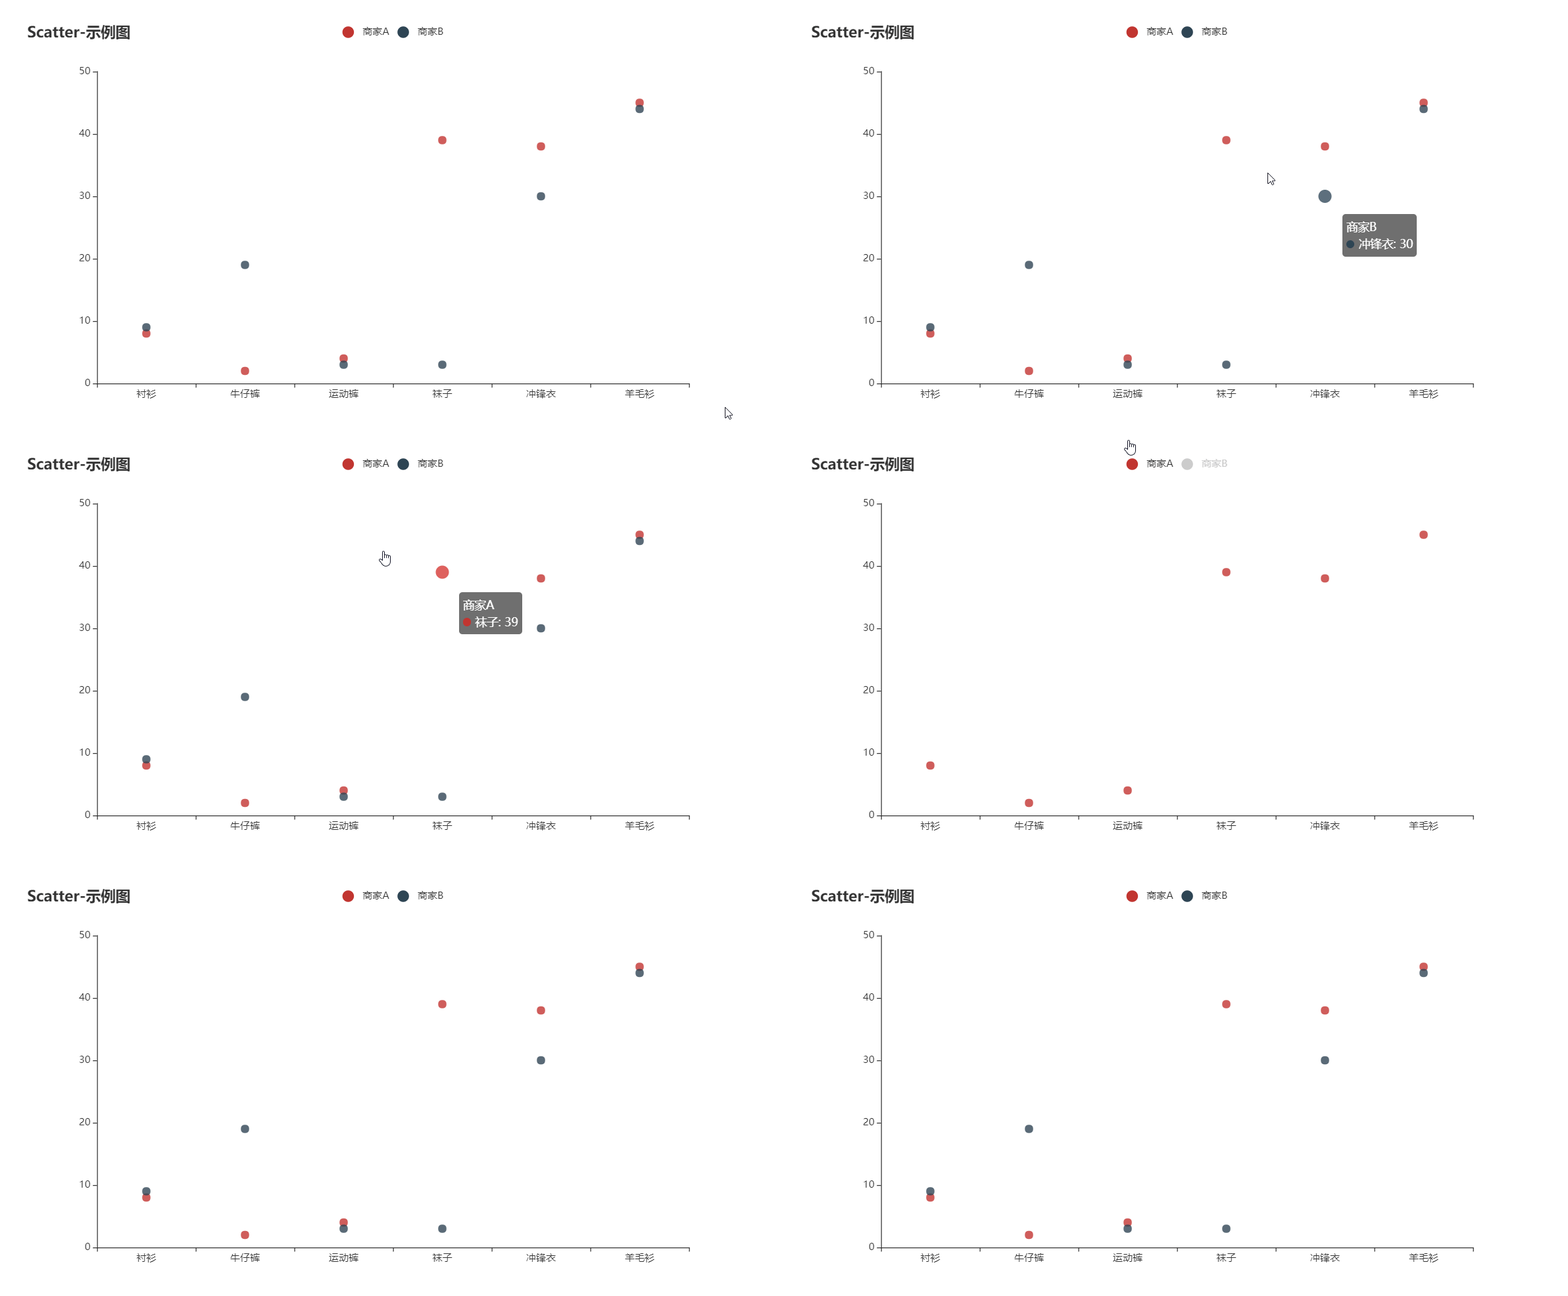
The method name `Scatter.AddYAxis` is misleading.

The method name Scatter.AddYAxis is misleading. It actually adding a data series.
For example, one can add (x, y) coordinates as two-element slices

zs := [][]float64{
	[]float64{1, 5},
	[]float64{2, 1},
	[]float64{8, 2},
	[]float64{9, 10},
	[]float64{15, 20},
}
scatter.AddYAxis("My Points", zs)

image

Feature request: Graph Gravity Map

Hi - Great library. Thank you.

Just wondering if there's any way to do a graph-based chart using this library? See the attached as an example.

20191129 Commercial Overview - anon

拆线图x轴type:"value"问题

我想设置x轴为value类型,如下,出来的图各点的x,y值是一样的,给定的x轴没有起作用。请问这是怎么回事?谢谢
line := charts.NewLine()
line.AddXAxis([]float32{1, 2, 5, 10, 15, 16, 17, 18}).
AddYAxis("map", []float32{19.9, 16.8, 19.9, 29.4, 61.3, 77.3, 93.0, 10},
charts.LabelTextOpts{Show: true, Position: "bottom"})
line.SetGlobalOptions(
charts.TitleOpts{Title: "折线图示例"},
charts.YAxisOpts{Name: "y(A)", SplitLine: charts.SplitLineOpts{Show: false}},
charts.XAxisOpts{Name: "x(s)", Type: "value"})

image

如果改成charts.XAxisOpts{Name: "x(s)", Type: "category"},如下图,这时x轴间隔是一样的,和标签值不致
image

Is 13'000'000 data points too much ?

I'm trying to load a simple line chart but with over 13'000'000 data points. The html file is created with 250 MB, then when I load in Chrome it finally ends up in error, just the "aw..snap" error message
IS 13'000'000 data points too much ?

多Y轴显示数据

你好,项目真不错。
不过翻编了文档,不知如何显示多Y轴,因为数据单位不一致,显示在一个Y轴下,看得很别扭。
比如折线图
func ExtendYAxis(yAxis ...YAxisOpts)
这个函数是如何使用,如何与func SetSeriesOptions(options ...seriesOptser)对应上y轴
可否有实例说明一下,谢谢
BTW,是不是一个html只能显示一个图?

当X轴是实值类型数据时,go-echarts画折线图有点问题

以下是我的核心代码

func lineArea() *charts.Line {
	X := []int{1,2,3,4,5,6,7,8,9,10,
			   11,12,13,14,15,16,17,18,19,20,
	           21,22,23,24,25,26,27,28,29,30,
	           31,32,33,34,35,36,37,38,39,40,
	           41,42,43,44,45,46,47,48,49,50,
	           51,52,53,54,55,56,57,58,59,60,
	           61,62,63,64,65,66,67,68,69,70,
	           71,72,73,74,75,76,77,78,79,80,
	           81,82,83,84,85,86,87,88,89,90,
	           91,92,93,94,95,96,97,98,99,100}
	Y := []float64{6.501961478, 7.28124402, 7.43207301, 5.963564232, 6.10160435, 5.84105499, 6.527692501, 6.581008444, 7.884540048, 7.457513959,
		           8.116463271, 6.994479316, 8.15453963, 11.572463241, 8.350149299, 7.007977781, 7.755351977, 6.625311875, 6.817208783, 6.887334014,
		           7.049202577, 7.376438491, 7.349611018, 7.038083694, 7.696284768, 6.555981493, 7.311792856, 7.885447347, 8.919789993, 9.036001867,
		           7.207733477, 7.243258769, 7.352062037, 7.09670508, 8.980034987, 13.35148914, 35.241174317, 9.14462537, 7.621769464, 12.158038208,
		           7.193858444, 8.633570432, 10.221565021, 8.171143957, 7.283215496, 7.718808239, 10.530668911, 7.325329045, 6.826321025, 7.448282469,
		           7.213455213, 7.051853182, 7.561779143, 7.428601659, 10.625508171, 7.265423041, 6.802577125, 7.902731347, 7.33257968, 6.944358234,
		           7.152601782, 6.80524939, 8.923304316, 6.764954847, 6.906378431, 7.304272649, 6.953830016, 7.389779643, 8.951032819, 8.09645485,
		           14.211963528, 8.567287544, 8.075336613, 7.199309977, 7.909694457, 7.006648081, 7.126869203, 7.164616894, 6.972288569, 9.286821708,
		           8.996441664, 10.511622025, 9.71786897, 7.823661257, 17.097368334, 8.550714888, 8.306312038, 8.642949588, 7.085142337, 8.540082558,
		           9.350456873, 9.483410599, 12.409771022, 10.404290999, 15.216416895, 10.413740501, 23.310586568, 22.896463445, 19.919574362, 23.220096621,
	}
	line := charts.NewLine()
	line.SetGlobalOptions(charts.TitleOpts{Title: "折线图"}, charts.XAxisOpts{Type: "value"})
	line.AddXAxis(X).AddYAxis("运行时间", Y, charts.AreaStyleOpts{Opacity: 0.4})
	line.SetGlobalOptions(charts.YAxisOpts{SplitLine: charts.SplitLineOpts{Show: true}})
	return line
}

下面是该代码画出来的图像:
wechatimg29
画出来的图像有如下问题:
第一:X轴的区间是[1,100],实际显示[0,40];第二:y的取值并不是均匀增长,随着X的增加,即:最终不应该是一条直线,而应该是一条折线的。
请问:我的程序哪里写错了,帮忙指出一下,可以吗?

go-echarts 开发讨论群
想参与到 go-echarts 到开发中来的同学或者对 go-echarts 感兴趣的同学可以扫码加群哈
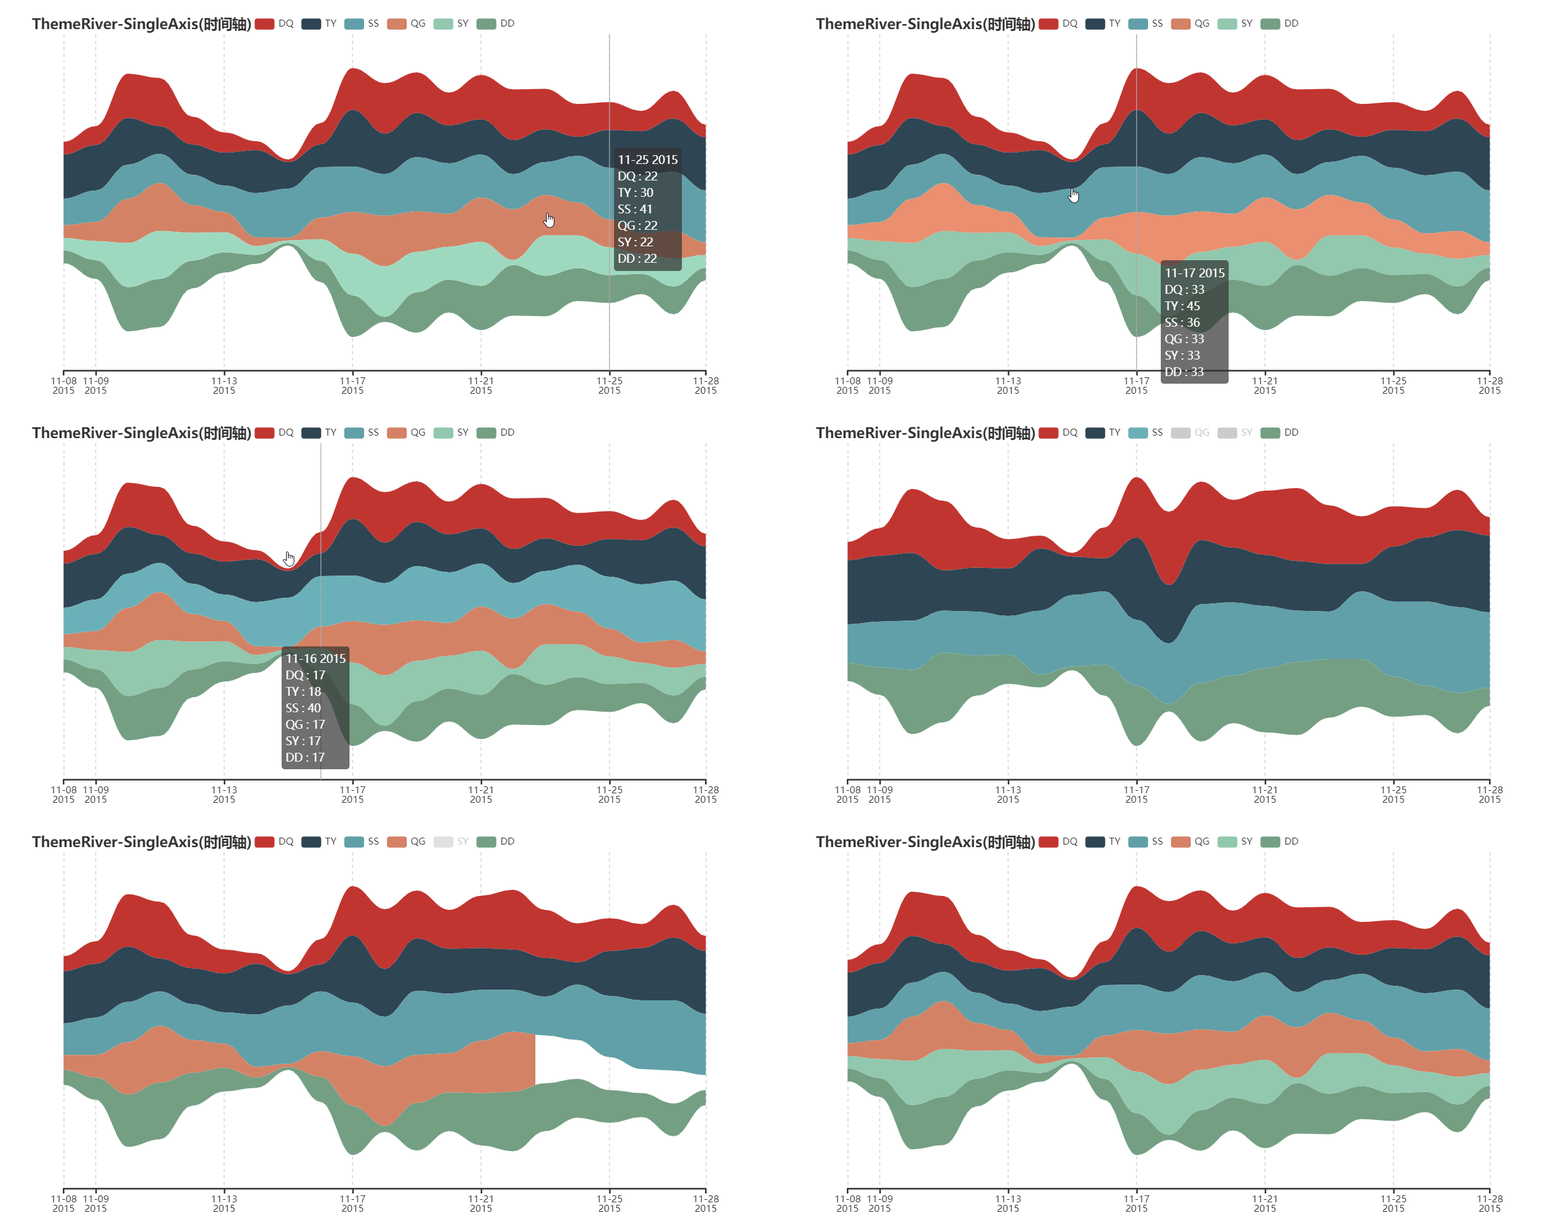
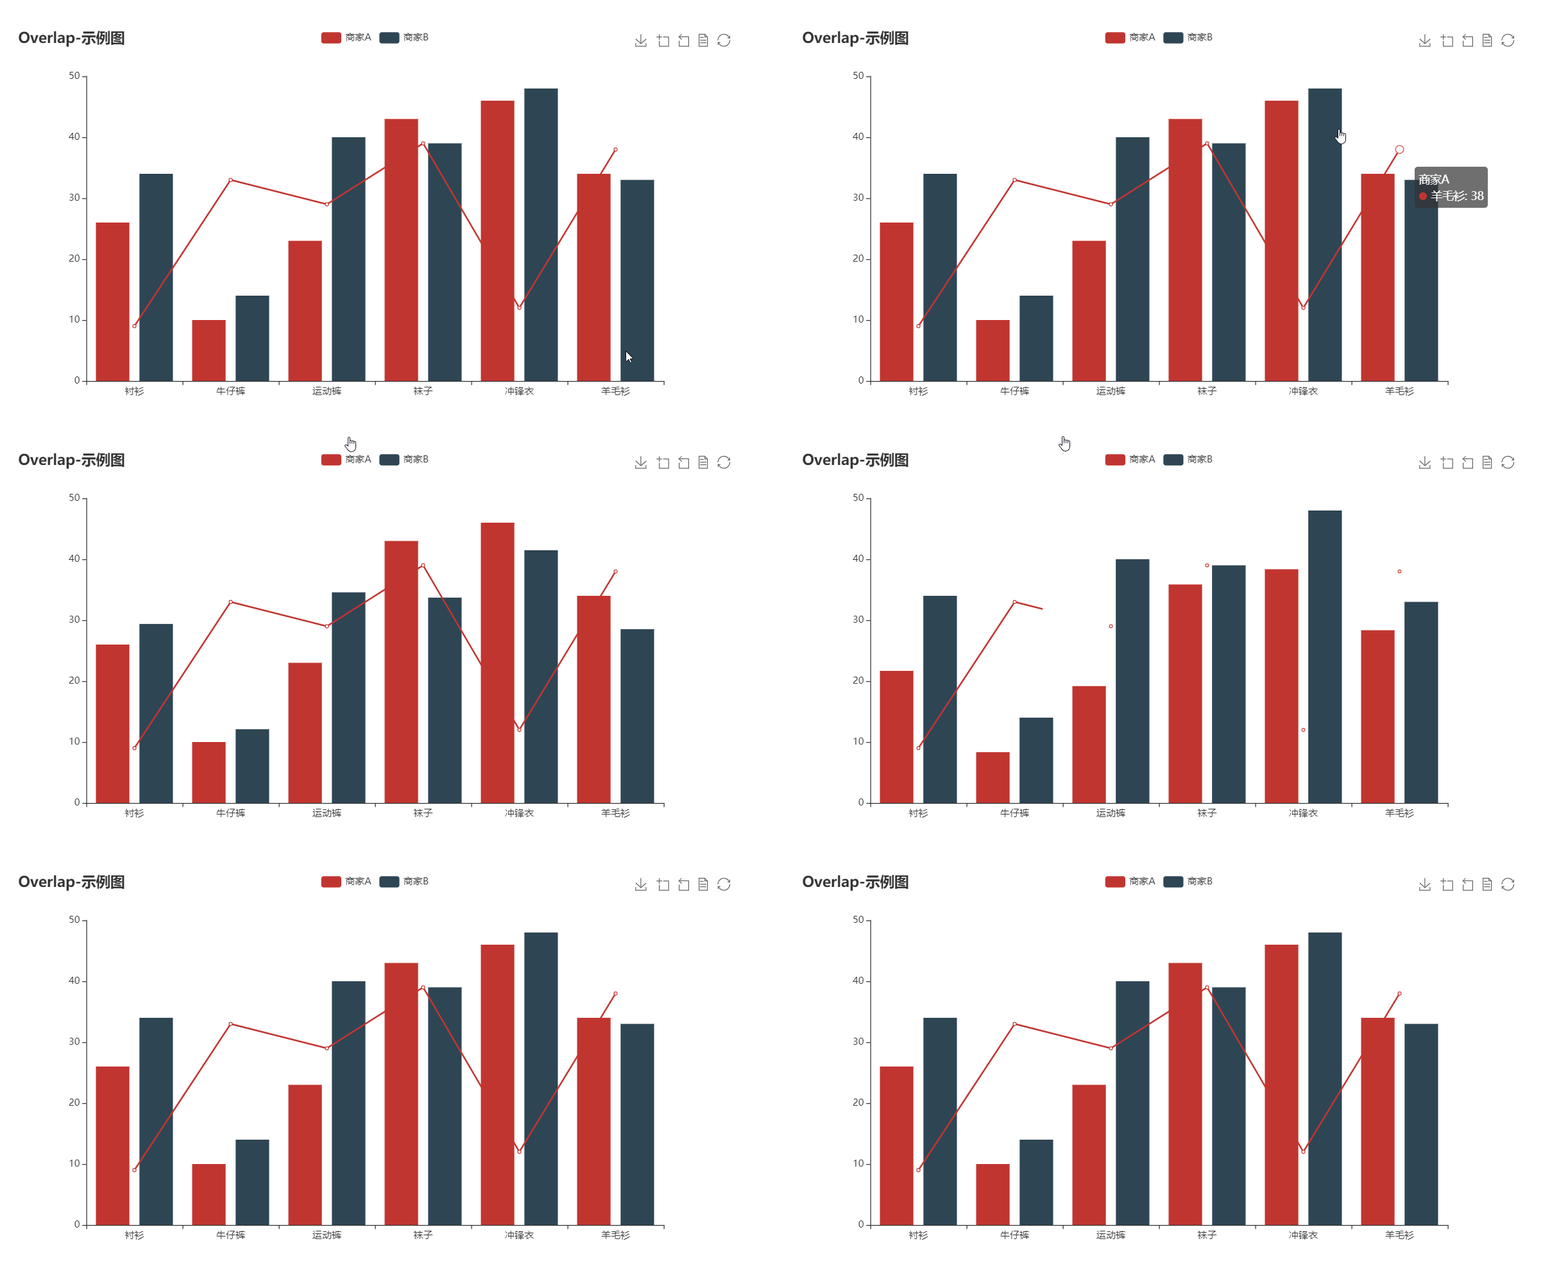
image_1

正在尝试将该库引入金融类app展示k线,但遇到两个问题求咨询

1. 在绘制K线图时按照文档, 如下处理时不能将时间戳精确到秒

// klineData ...
type klineData struct {
	date string
	data [4]float32
}

p.klineChart = charts.NewKLine()
	x := make([]string, 0)
	y := make([][4]float32, 0)
	for i := 0; i < len(p.kline); i++ {
		x = append(x, p.kline[i].date)
		y = append(y, p.kline[i].data)
	}
	p.klineChart.AddXAxis(x).AddYAxis("kline", y)
	p.klineChart.SetGlobalOptions(
		charts.TitleOpts{Title: "KLine"},
		charts.XAxisOpts{SplitNumber: 20},
		charts.YAxisOpts{Scale: true},
		charts.DataZoomOpts{XAxisIndex: []int{0}, Start: 50, End: 100},
	)

x坐标我输入的是 "2018/6/13 23:09:11" 发现不能精确到时分秒去展示k线,求咨询如何配置才能支持到这种精度的时间戳

2.在k线基础上我想引入折线来展示均线等,使用overlap重叠两图后发现失败

p.lineChart = charts.NewLine()
	x := make([]string, 0)
	y := make([]float32, 0)
	//p.lineChart.SetGlobalOptions(charts.TitleOpts{Title: "Line多线"}, charts.InitOpts{Theme: "shine"})
	for k, v := range p.line {
		for i := 0; i < len(v); i++ {
			x = append(x, v[i].date)
			y = append(y, v[i].data)
		}
		p.lineChart.AddXAxis(x).AddYAxis(k, y)
	}


p.klineChart.Overlap(p.lineChart) <---这样重叠后无法显示

求指导如何配置才能将两个以同样时间戳为x轴的k线图和折线图合并,达到展示需求

Remove packr dependency?

Hi,
this is a fantastic project and I love how simple it is to start building interactive charts!

However, I think that the code is quite opinionated about some dependencies, like buffalo/packr. Would you consider removing those hard dependencies in favor of more generic approach?

Ideally, the go-echarts would require the user to pass the assets in an object implementing the http.FileSystem interface, which could be packr.Box or vfsgen.FS or http.FileServer(http.Dir()) from stdlib or anything else implementing the interface.

Example:

Instead of the below init() function
https://github.com/chenjiandongx/go-echarts/blob/c166f45970c9f3194b6cefc5e6dbc044d8f49618/datasets/datasets.go#L13-L24

let the caller initiate this package explicitly with datasets.LoadAssets(assets), where assets implements http.FileSystem interface.. and might be the packr.Box or something else.

Let me know if you'd have interest in this work

Array of charts.MPNameCoordItem

Hi, I want to add some mark points to a graph like this:

func lineMarkPoint() *charts.Line {
	line := charts.NewLine()
	line.SetGlobalOptions(charts.TitleOpts{Title: "Line-Test"})
	line.AddXAxis(hours).AddYAxis("Hours", randInt(),
		charts.MPNameCoordItem{Name: "Test1", Coord: []interface{}{"5", "12"}},
		charts.MPNameCoordItem{Name: "Test2", Coord: []interface{}{"6", "20"}},
	return line
}

But the coordinates are not known at compile time so I want add them as an array to AddYAxis(), like this:

func lineMarkPoint() *charts.Line {
	items := []charts.MPNameCoordItem{}
	items = append(items, charts.MPNameCoordItem{Name: "Test1", Coord: []interface{}{"5", "12"}})
	items = append(items, charts.MPNameCoordItem{Name: "Test1", Coord: []interface{}{"8", "20"}})

	line := charts.NewLine()
	line.SetGlobalOptions(charts.TitleOpts{Title: "Line-Test"})
	line.AddXAxis(hours).AddYAxis("Hours", randInt(), items...)
	return line
}

But this does not work, I get a compile error:
cannot use items (variable of type []charts.MPNameCoordItem) as []charts.seriesOptser value in argument to line.AddXAxis(hours).AddYAxis
Is there any way I can get around this limitation?

`RectChart.Render` is not re-entrant

RectChart.Render is not re-entrant, which means a chart variable c cannot be call with c.Render(w) more than once.

It would be nice if the Render function is reentrant. For example, when serving a chart via http, one could construct the chart for only once, and call Render on it in the http handler (instead of constructing the chart inside the http handler). Example code:

s := charts.NewScatter()
// setup s ...
http.HandleFunc("/", func(w http.ResponseWriter, _ *http.Request) { s.Render(w) })

How difficult to make Render re-entrant?

Looking for Maintainer

Hi, guys

I'm @chenjiandongx , author of go-echarts. Cause of the busy working stuff, I already have no bandwidth to maintain this project. Thus I hope there is somebody to join the go-echarts dev-team to make it better.

If you are interested in it, please let me know or just contact me [email protected]

Recommend Projects

  • React photo React

    A declarative, efficient, and flexible JavaScript library for building user interfaces.

  • Vue.js photo Vue.js

    🖖 Vue.js is a progressive, incrementally-adoptable JavaScript framework for building UI on the web.

  • Typescript photo Typescript

    TypeScript is a superset of JavaScript that compiles to clean JavaScript output.

  • TensorFlow photo TensorFlow

    An Open Source Machine Learning Framework for Everyone

  • Django photo Django

    The Web framework for perfectionists with deadlines.

  • D3 photo D3

    Bring data to life with SVG, Canvas and HTML. 📊📈🎉

Recommend Topics

  • javascript

    JavaScript (JS) is a lightweight interpreted programming language with first-class functions.

  • web

    Some thing interesting about web. New door for the world.

  • server

    A server is a program made to process requests and deliver data to clients.

  • Machine learning

    Machine learning is a way of modeling and interpreting data that allows a piece of software to respond intelligently.

  • Game

    Some thing interesting about game, make everyone happy.

Recommend Org

  • Facebook photo Facebook

    We are working to build community through open source technology. NB: members must have two-factor auth.

  • Microsoft photo Microsoft

    Open source projects and samples from Microsoft.

  • Google photo Google

    Google ❤️ Open Source for everyone.

  • D3 photo D3

    Data-Driven Documents codes.