Giter VIP home page Giter VIP logo

grafolean's Introduction

Grafolean

Easy to use monitoring system


Highlights

screenshot

Installation

Before starting, make sure that both Docker (installation instructions) and Docker Compose (installation instructions) are installed.

  1. save install/docker-compose.yml to a local file:

    $ curl https://raw.githubusercontent.com/grafolean/grafolean/master/install/docker-compose.yml > docker-compose.yml
    
    Trying to run Grafolean on Raspberry PI? Read more...

    The default build is for x86 architecture only. If you would like to run Grafolean on an ARM (Raspberry Pi), there is a build available for it, but it is not yet included in the default branch. Use this command to fetch docker-compose.yml instead:

    $ curl https://raw.githubusercontent.com/grafolean/grafolean/feature/multi-arch/install/docker-compose.yml > docker-compose.yml
    

    Everything else works the same.

    Note that constant writing to SD cards (which is what databases do) is in general not a good idea and might cause them to fail. If you have an option, consider using an SSD drive.

  2. save .env.example to a local file and rename it to .env:

    $ curl https://raw.githubusercontent.com/grafolean/grafolean/master/install/.env.example > .env
    
  3. edit .env, for example with nano:

    $ nano .env
    

    and change the settings:

    • mandatory: EXTERNAL_HOSTNAME (set to the IP/hostname of the server as seen from the outside - for example grafolean.example.com or 198.51.100.12),
    • optional but recommended: DB admin credentials and the path where the DB data will be saved locally (/grafolean-db/ by default).
  4. run:

    $ docker-compose up -d
    
  5. point your browser to http://<IP or domain>/ (where <IP or domain> should be the same as EXTERNAL_HOSTNAME in step 3)

Congratulations, you are done! 🚀

If you wish to setup HTTPS, see doc/HOWTO-HTTPS.md for instructions.

Upgrading

$ docker-compose pull
$ docker-compose down
$ docker-compose up -d

Sending values to Grafolean (custom bots)

You can send data to Grafolean from your own scripts ("custom bots") or you can use one of the existing bots, which can even be configured from within the Grafolean (like ICMP ping, SNMP or Netflow - see Grafolean User Guide).

When you just want to send values to Grafolean, create a custom bot (via UI) and obtain its token. Then you can use a regular POST request to send values:

$ curl -X POST 'https://app.grafolean.com/api/accounts/1/values/?p=myhouse.livingroom.humidity&v=57.3&b=<BotAPIToken>'

The values can now be shown through dashboards.

User Guide explains the core concepts and guides you further. See also backend/API.md for more info on API.

Guides

Privacy

We do our best to make sure no 3rd party receives any data from your installation of Grafolean or from your users.

Frontend uses Content Security Policy (CSP) to disallow loading of resources from anywhere except from the host itself. The limit also applies to external plugins.

The backend should make no requests to the external services, except:

  • https://app.grafolean.com/ - reporting telemetry if enabled (see below), and
  • https://github.com/ - downloading external plugins when admin installs / upgrades them.

Note that this list might be updated in the future, however, we will make an effort to avoid any tracking that is not strictly necessary.

Telemetry

Telemetry can be disabled by setting TELEMETRY=none in the .env file when starting Grafolean (as indicated in .env.example). The default telemetry is basic and allows us to determine active installations of the app (app start, daily "ping"). We would appreciate if you leave the telemetry enabled as it helps us to focus our efforts on what matters the most, but we understand if you have concerns about it and decide to turn it off. We will not allow 3rd parties access to telemetry data, but we might publish aggregated data through public channels (blogs,...).

License

This software is free to use for any purpose, to inspect, modify and share, except to sell to third parties.

License is Commons Clause license (on top of Apache 2.0), which means that source is available and you can use it free-of-charge forever (both non-commercially and commercially), modify it and share modifications. The license limits the ability to sell Grafolean to third parties (for example as product, offering support,...), as you would need a commercial license for that (not yet available, contact us if interested). Open an issue or ask directly if in doubt.

grafolean's People

Contributors

grafolean avatar

Stargazers

 avatar  avatar  avatar  avatar  avatar  avatar  avatar  avatar  avatar  avatar  avatar  avatar  avatar  avatar  avatar  avatar  avatar  avatar  avatar  avatar  avatar  avatar  avatar  avatar  avatar  avatar  avatar  avatar  avatar  avatar  avatar  avatar  avatar  avatar  avatar  avatar  avatar  avatar  avatar  avatar  avatar  avatar  avatar  avatar  avatar  avatar  avatar  avatar  avatar

Watchers

 avatar  avatar  avatar  avatar  avatar  avatar  avatar

grafolean's Issues

Nothing listening on port 80?

Hello, apologies for the beginner nature of my question. I followed all of the instructions on the site til the point where it says to load the web page on port 80. There is no response.

If I run a docker container ls command, I do not see any containers listening on port 80:
Screen Shot 2021-02-23 at 8 12 43 PM

I am trying to set up a Raspberry Pi based monitor. Many thanks in advance.

Issue starting mosquitto error: unable to create websockets listener on port 9883

Steps To Reproduce
Steps to reproduce the behavior:
docker-compose up -d (using the included docker-compose.yml)

Whan went wrong
Stack fails to start, docker opens port 80 but due to mosquitto in a restart loop, never responds to traffic.

Expected behavior
All containers to start up healthy.

Software versions:

  • Docker version [Docker version 26.0.0, build 2ae903e
  • Docker Compose version v2.25.0
  • Browser [e.g. firefox, chrome, safari] - if applicable
  • Grafolean Version latest

Additional context
mosquitto | time="2024-03-29T19:24:33Z" level=info msg="log_dest unknown, using default stderr"
mosquitto | time="2024-03-29T19:24:33Z" level=warning msg="unknown or empty hasher, defaulting to PBKDF2"
mosquitto | time="2024-03-29T19:24:33Z" level=info msg="Backend registered: JWT"
mosquitto | time="2024-03-29T19:24:33Z" level=info msg="redisCache activated"
mosquitto | time="2024-03-29T19:24:33Z" level=info msg="started go-cache"
mosquitto | time="2024-03-29T19:24:33Z" level=info msg="flushed go-cache"
mosquitto | 1711740273: Error: Unable to create websockets listener on port 9883.

UDP packets not passing to container

I can see UDP packets of Netflow being received at my docker host using tcpdump however the docker containing the netflow-collector does not see any of the packets. This seems to be a long-standing issue with UDP packets and Docker. Any ideas here? I am running this on an Ubuntu instance virtualized on ESXI.

netflow-writer errors

Running docker version 19.03.13 build 4484c46d9d and docker-compose version 1.25.5, build 8a1c60f6 on Ubuntu 20.04, no netflow data is displaying on dashboard. Grafolean does detect initial netflow source and allows me to assign a sensor.

Netflow source is routerOS 6.47.4 with netflow version 9 being sent.

docker logs grafolean-netflow-writer output is a continuous result of

2020-10-11 16:18:22.463 | ERR | Error writing line, skipping...
Traceback (most recent call last):
  File "./netflowwriter.py", line 117, in process_named_pipe
  File "./netflowwriter.py", line 255, in write_buffer
  File "./netflowwriter.py", line 211, in _get_data
KeyError: 'DIRECTION'

Dashboard is completely white!

Hi There,

Thanks for this cool project, sadly i just can't get it to work :(

I have installed it locally on my Linux PC to collect netflow data from a MikroTik router which is the router for this LAN.

The netflow exporter showed up automatically. I have enabled the netflow sensor and the logs show netflow data coming in to Grafolean.

When I add a dashboard using netflow template I get a completely white browser window. clicking refresh VERY briefly shows Grafolean web page and then reverts to completely white. I have tried various different browsers and disabled ad blockers etc etc.

Please help!

Thanks

Issues creating db

Not sure where I'm going wrong here but on multiple instances of attempting to deploy grafolean (using Portainer) I am unable to deploy the DB. I am constantly getting this error out of the Postgres DB log as soon as the grafolean container starts up (I ensure that the Postgres container has already said it is ready to receive connections):

11/23/2023
02:07:45 PM
2023-11-23 19:07:45.970 UTC [56] STATEMENT: SELECT schema_version FROM runtime_data;
11/23/2023
02:07:45 PM
2023-11-23 19:07:45.970 UTC [56] ERROR: relation "runtime_data" does not exist at character 28

Then, I open the grafolean web page and click create DB and the following happens on the DB:
11/23/2023
02:11:06 PM
2023-11-23 19:11:06.292 UTC [112] STATEMENT: COPY netflow_flows2 FROM STDIN WITH BINARY
11/23/2023
02:11:06 PM
2023-11-23 19:11:06.294 UTC [112] ERROR: relation "netflow_flows2" does not exist

On the grafolean docker: 2023-11-23 19:07:59 | INF | Migrating DB schema from 0 to 1

Another refresh of the webpage prompts to me to upgrade the DB now. Grafolean logs show:

11/23/2023
02:14:41 PM
2023-11-23 19:14:41 | INF | Migrating DB schema from 1 to 2
11/23/2023
02:14:42 PM
2023-11-23 19:14:42 | INF | Migrating DB schema from 1 to 3
11/23/2023
02:14:47 PM
2023-11-23 19:14:47 | ERR | relation "dashboards" does not exist
11/23/2023
02:14:47 PM
Traceback (most recent call last):

And that's about as far as I get.

Grafolean behind reverse Proxy

Hi,
I want grafolean to run behind a traefik reverse proxy. I've configured the grafolean domain to my public domain. When I try to login it tells me wrong password. The password reset button displays the following error: CORS not allowed for this origin

No netflow data found for job - Mikrotik IPv6 Enabled

Hi,

Thanks for this useful tool.

This is a follow up on issue netflow-writer errors

If the IPv6 package is enabled on Mikrotik, the data gets sent to the netflowbot, but nothing is displayed on the dashboard and the log display that there is no netflow data found. The error on the writer looks something like this:

Sequence number (17) does not follow (15), some records might have been skipped

Disabling IPv6 on the Mikrotik, rebooting and sending the data again, everything works fine. I do, however, run IPv6 natively and it would be nice to be able to use your tool.

I am using the latest versions in the docker-compose file.

# grep "image: grafolean/" docker-compose.yml

image: grafolean/grafolean
image: grafolean/mosquitto
image: grafolean/grafolean-ping-bot
image: grafolean/grafolean-snmp-bot
image: grafolean/grafolean-netflow-bot
image: grafolean/grafolean-netflow-bot`

Database errors on startup

Firstly, thanks for writing and sharing this - it looks like it would be a great way to keep an eye on my network at home.

I just tried deploying this on an Ubuntu 20.04 virtual machine. Docker version is "19.03.13, build 4484c46d9d", and docker-compose is "version 1.22.0, build f46880fe".

Only customisation was to configure the .env file as follows (hostname changed to protect the innocent):

EXTERNAL_HOSTNAME=flows.example.com
DB_DIR=./data/grafolean-db/
DB_NAME=grafolean
DB_USER=grafusr
DB_PASS=randomised-password-here
HTTP_PORT=8002

# Options: full, none or basic (default).
TELEMETRY=basic

The containers all start up successfully but I do note a number of database errors in the logs:

postgres            | 2023-01-19 23:25:59.970 UTC [101] ERROR:  relation "runtime_data" does not exist at character 28
postgres            | 2023-01-19 23:25:59.970 UTC [101] STATEMENT:  SELECT schema_version FROM runtime_data;
postgres            | 2023-01-19 23:25:59.973 UTC [101] ERROR:  relation "runtime_data" does not exist at character 28
postgres            | 2023-01-19 23:25:59.973 UTC [101] STATEMENT:  SELECT schema_version FROM runtime_data;

Loading the actual site I see a message saying "The database is empty and must be initialized before we can proceed." with a button "Create DB". Clicking it does nothing, but in the docker logs I see it corresponds with this entry:
grafolean | 192.168.0.1 - - [19/Jan/2023:23:29:07 +0000] "POST /api/admin/migratedb HTTP/1.1" 403 33 "https://flows.example.com/" "Mozilla/5.0 (Macintosh; Intel Mac OS X 10_15_7) AppleWebKit/537.36 (KHTML, like Gecko) Chrome/108.0.0.0 Safari/537.36" rt=0.007 urt=0.008

Any ideas?

Cannot login - Safari

Got Grafolean installed without issues and set it to port 8080. Access the webpage and input information for Admin user. Then I get to the login screen and is asked for credentials. Use the admin username and password from the previous page. I am immediately returned to an empty login form... No error message or anything. Can you help?

NetFlow-Writer Error

Didn't know if I should comment on the last issue reported or start a new one.
I have everything installed and pretty much working but I am not getting NetFlow data into the Dashboard. When looking at the Docker logs for netflow-writer I get the following logs as well as Template Sequence numbering issues.

2021-02-13 16:30:14.792 | ERR | [EXPORTERIPHERE] Error decoding v9 flow. Contents: {'IN_BYTES': 7200, 'OUT_BYTES': 7200, 'IN_PKTS': 120, 'OUT_PKTS': 120, 'FIRST_SWITCHED': 3363530250, 'LAST_SWITCHED': 3363590270, 'INPUT_SNMP': 0, 'OUTPUT_SNMP': 7, 'ICMP_TYPE': 2048, 'PROTOCOL': 1, 'APPLICATION_TAG': 368934934542806941696, 'UNKNOWN_FIELD_TYPE': 2, 'FORWARDING_STATUS': 64, 'IPV4_SRC_ADDR': 'SOURCEIPHERE', 'IPV4_DST_ADDR': 'DESTINATIONIPHERE'}
Traceback (most recent call last):
File "./netflowwriter.py", line 217, in _get_data
KeyError: 'L4_DST_PORT'

I assume it is some odd field that Fortinet has on it's netflows that is unable to be parsed but I am not a programmer. More than happy to help get you the information to help with this error.

Error on creating first user; no config options on login

Sorry, new issue with me creating a first user.

I got the web server up and it asks me to create a user. I enter the information and it returns an error.
Screen Shot 2021-02-25 at 10 52 55 AM

If I refresh the browser, it DOES ask me to login and I am able to, BUT the options are very limited in terms of what I can do. I do not see any options for Dashboards, Managed entities, etc.
Screen Shot 2021-02-25 at 10 56 03 AM

docker-compose logs -f on grafolean for this time period show:
Screen Shot 2021-02-25 at 10 52 30 AM

Sorry I keep troubling you - Appreciate all of the help!

will not start with PhotonOS

Hey,

nice project, but on my fresh installed PhotonOS x86_64 VM, plain, just with docker-compose ) I see this in the grafolean logfile on a fresh start

docker-compose up
[+] Running 4/0
 ⠿ Container grafolean-ping-bot  Created                                                                                                                   0.0s
 ⠿ Container postgres            Created                                                                                                                   0.0s
 ⠿ Container mosquitto           Created                                                                                                                   0.0s
 ⠿ Container grafolean-autoheal  Created                                                                                                                   0.0s
Attaching to grafolean, grafolean-autoheal, grafolean-netflow-bot, grafolean-netflow-collector, grafolean-netflow-writer, grafolean-ping-bot, grafolean-snmp-bot, mosquitto, postgres
postgres                     |
postgres                     | PostgreSQL Database directory appears to contain a database; Skipping initialization
postgres                     |
postgres                     | 2022-12-11 10:14:59.549 UTC [1] LOG:  starting PostgreSQL 12.4 on x86_64-pc-linux-musl, compiled by gcc (Alpine 9.3.0) 9.3.0, 64-bit
postgres                     | 2022-12-11 10:14:59.575 UTC [1] LOG:  listening on IPv4 address "0.0.0.0", port 5432
postgres                     | 2022-12-11 10:14:59.576 UTC [1] LOG:  listening on IPv6 address "::", port 5432
postgres                     | 2022-12-11 10:14:59.595 UTC [1] LOG:  listening on Unix socket "/var/run/postgresql/.s.PGSQL.5432"
postgres                     | 2022-12-11 10:14:59.904 UTC [21] LOG:  database system was shut down at 2022-12-11 10:11:57 UTC
postgres                     | 2022-12-11 10:15:00.367 UTC [1] LOG:  database system is ready to accept connections
postgres                     | 2022-12-11 10:15:00.539 UTC [27] LOG:  TimescaleDB background worker launcher connected to shared catalogs
mosquitto                    | time="2022-12-11T10:15:01Z" level=info msg="log_dest unknown, using default stderr"
mosquitto                    | time="2022-12-11T10:15:01Z" level=warning msg="unknown or empty hasher, defaulting to PBKDF2"
mosquitto                    | time="2022-12-11T10:15:01Z" level=info msg="Backend registered: JWT"
mosquitto                    | time="2022-12-11T10:15:01Z" level=info msg="redisCache activated"
mosquitto                    | time="2022-12-11T10:15:01Z" level=info msg="started go-cache"
mosquitto                    | time="2022-12-11T10:15:01Z" level=info msg="flushed go-cache"
grafolean-ping-bot           | 2022-12-11 10:15:05 | INF | Checking Grafolean status...
grafolean-ping-bot           | 2022-12-11 10:15:05 | DBG | Starting new HTTP connection (1): grafolean:80
grafolean-ping-bot           | 2022-12-11 10:15:05 | INF | Grafolean backend not available / initialized yet, waiting.
grafolean-ping-bot           | 2022-12-11 10:15:15 | INF | Checking Grafolean status...
grafolean-ping-bot           | 2022-12-11 10:15:16 | DBG | Starting new HTTP connection (1): grafolean:80
Error response from daemon: transport is closing: unavailable

.env is:

EXTERNAL_HOSTNAME=192.168.64.5
DB_DIR=/grafolean-db/
DB_NAME=grafolean
DB_USER=admin
DB_PASS=admin
HTTP_PORT=80

Unable to login on fresh deployment

I just deployed Grafolean using the directions. The error I am getting in the browser console is unable to connect to MQTT. Console logs below, grafolean.unimax.local does point to the correct IP in our DNS.

paho-mqtt-min.js:37 WebSocket connection to 'ws://grafolean.unimax.local/mqtt' failed:
d._doConnect @ paho-mqtt-min.js:37
d.connect @ paho-mqtt-min.js:31
G.connect @ paho-mqtt-min.js:69
(anonymous) @ MQTTFetcherSingleton.js:128
ensureMqttConnected @ MQTTFetcherSingleton.js:115
t.ensureSubscribed @ withMqttConnected.js:50
value @ withMqttConnected.js:15
ks @ react-dom.production.min.js:251
t.unstable_runWithPriority @ scheduler.production.min.js:18
Yi @ react-dom.production.min.js:120
Bs @ react-dom.production.min.js:244
As @ react-dom.production.min.js:223
(anonymous) @ react-dom.production.min.js:121
t.unstable_runWithPriority @ scheduler.production.min.js:18
Yi @ react-dom.production.min.js:120
Ji @ react-dom.production.min.js:121
Qi @ react-dom.production.min.js:120
bs @ react-dom.production.min.js:214
enqueueSetState @ react-dom.production.min.js:133
v.setState @ react.production.min.js:13
s.onStateChange @ connectAdvanced.js:207
notify @ Subscription.js:23
t.notifyNestedSubs @ Subscription.js:62
s.onStateChange @ connectAdvanced.js:204
b @ createStore.js:172
(anonymous) @ index.js:68
u @ runtime.js:45
(anonymous) @ runtime.js:271
forEach.e. @ runtime.js:97
u @ runtime.js:45
t @ runtime.js:135
(anonymous) @ runtime.js:145
paho-mqtt-min.js:37 WebSocket connection to 'ws://grafolean.unimax.local/mqtt' failed:
d._doConnect @ paho-mqtt-min.js:37
d._disconnected @ paho-mqtt-min.js:58
d._on_socket_error @ paho-mqtt-min.js:52
(anonymous) @ paho-mqtt-min.js:17
MQTTFetcherSingleton.js:135 Error connecting to MQTT broker via WebSockets
onFailure @ MQTTFetcherSingleton.js:135
d._disconnected @ paho-mqtt-min.js:58
d._on_socket_error @ paho-mqtt-min.js:52
(anonymous) @ paho-mqtt-min.js:17
error (async)
d._doConnect @ paho-mqtt-min.js:38
d._disconnected @ paho-mqtt-min.js:58
d._on_socket_error @ paho-mqtt-min.js:52
(anonymous) @ paho-mqtt-min.js:17
error (async)
d._doConnect @ paho-mqtt-min.js:38
d.connect @ paho-mqtt-min.js:31
G.connect @ paho-mqtt-min.js:69
(anonymous) @ MQTTFetcherSingleton.js:128
ensureMqttConnected @ MQTTFetcherSingleton.js:115
t.ensureSubscribed @ withMqttConnected.js:50
value @ withMqttConnected.js:15
ks @ react-dom.production.min.js:251
t.unstable_runWithPriority @ scheduler.production.min.js:18
Yi @ react-dom.production.min.js:120
Bs @ react-dom.production.min.js:244
As @ react-dom.production.min.js:223
(anonymous) @ react-dom.production.min.js:121
t.unstable_runWithPriority @ scheduler.production.min.js:18
Yi @ react-dom.production.min.js:120
Ji @ react-dom.production.min.js:121
Qi @ react-dom.production.min.js:120
bs @ react-dom.production.min.js:214
enqueueSetState @ react-dom.production.min.js:133
v.setState @ react.production.min.js:13
s.onStateChange @ connectAdvanced.js:207
notify @ Subscription.js:23
t.notifyNestedSubs @ Subscription.js:62
s.onStateChange @ connectAdvanced.js:204
b @ createStore.js:172
(anonymous) @ index.js:68
u @ runtime.js:45
(anonymous) @ runtime.js:271
forEach.e. @ runtime.js:97
u @ runtime.js:45
t @ runtime.js:135
(anonymous) @ runtime.js:145
Promise.then (async)
t @ runtime.js:144
(anonymous) @ runtime.js:145
Promise.then (async)
t @ runtime.js:144
(anonymous) @ runtime.js:170
o @ runtime.js:169
_invoke @ runtime.js:192
forEach.e. @ runtime.js:97
e.async @ runtime.js:216
a.handleLoginSubmit @ index.js:34
m @ react-dom.production.min.js:15
A @ react-dom.production.min.js:15
(anonymous) @ react-dom.production.min.js:16
z @ react-dom.production.min.js:16
T @ react-dom.production.min.js:17
S @ react-dom.production.min.js:17
L @ react-dom.production.min.js:17
wn @ react-dom.production.min.js:81
ue @ react-dom.production.min.js:285
Tn @ react-dom.production.min.js:83
qn @ react-dom.production.min.js:84
Ln @ react-dom.production.min.js:84
t.unstable_runWithPriority @ scheduler.production.min.js:18
Yi @ react-dom.production.min.js:120
ce @ react-dom.production.min.js:285
Sn @ react-dom.production.min.js:82
withMqttConnected.js:57 Could not connect to MQTT undefined
(anonymous) @ withMqttConnected.js:57
Promise.catch (async)
t.ensureSubscribed @ withMqttConnected.js:56
value @ withMqttConnected.js:15
ks @ react-dom.production.min.js:251
t.unstable_runWithPriority @ scheduler.production.min.js:18
Yi @ react-dom.production.min.js:120
Bs @ react-dom.production.min.js:244
As @ react-dom.production.min.js:223
(anonymous) @ react-dom.production.min.js:121
t.unstable_runWithPriority @ scheduler.production.min.js:18
Yi @ react-dom.production.min.js:120
Ji @ react-dom.production.min.js:121
Qi @ react-dom.production.min.js:120
bs @ react-dom.production.min.js:214
enqueueSetState @ react-dom.production.min.js:133
v.setState @ react.production.min.js:13
s.onStateChange @ connectAdvanced.js:207
notify @ Subscription.js:23
t.notifyNestedSubs @ Subscription.js:62
s.onStateChange @ connectAdvanced.js:204
b @ createStore.js:172
(anonymous) @ index.js:68
u @ runtime.js:45
(anonymous) @ runtime.js:271
forEach.e. @ runtime.js:97
u @ runtime.js:45
t @ runtime.js:135
(anonymous) @ runtime.js:145
Promise.then (async)
t @ runtime.js:144
(anonymous) @ runtime.js:145
Promise.then (async)
t @ runtime.js:144
(anonymous) @ runtime.js:170
o @ runtime.js:169
_invoke @ runtime.js:192
forEach.e. @ runtime.js:97
e.async @ runtime.js:216
a.handleLoginSubmit @ index.js:34
m @ react-dom.production.min.js:15
A @ react-dom.production.min.js:15
(anonymous) @ react-dom.production.min.js:16
z @ react-dom.production.min.js:16
T @ react-dom.production.min.js:17
S @ react-dom.production.min.js:17
L @ react-dom.production.min.js:17
wn @ react-dom.production.min.js:81
ue @ react-dom.production.min.js:285
Tn @ react-dom.production.min.js:83
qn @ react-dom.production.min.js:84
Ln @ react-dom.production.min.js:84
t.unstable_runWithPriority @ scheduler.production.min.js:18
Yi @ react-dom.production.min.js:120
ce @ react-dom.production.min.js:285
Sn @ react-dom.production.min.js:82

ERR log messages when using invalid auth tokens

Accessing Grafolean with invalid auth tokens results in the following log message:

grafolean           | 2020-10-26 19:17:54 | ERR | Exception while checking access rights
grafolean           | Traceback (most recent call last):
grafolean           |   File "./auth.py", line 55, in forge_from_authorization_header
grafolean           |   File "/usr/local/lib/python3.6/site-packages/jwt/api_jwt.py", line 104, in decode
grafolean           |     self._validate_claims(payload, merged_options, **kwargs)
grafolean           |   File "/usr/local/lib/python3.6/site-packages/jwt/api_jwt.py", line 134, in _validate_claims
grafolean           |     self._validate_exp(payload, now, leeway)
grafolean           |   File "/usr/local/lib/python3.6/site-packages/jwt/api_jwt.py", line 175, in _validate_exp
grafolean           |     raise ExpiredSignatureError('Signature has expired')
grafolean           | jwt.exceptions.ExpiredSignatureError: Signature has expired
grafolean           | 
grafolean           | During handling of the above exception, another exception occurred:
grafolean           | 
grafolean           | Traceback (most recent call last):
grafolean           |   File "./api/admin.py", line 146, in admin_mqttauth_plug
grafolean           |   File "./auth.py", line 60, in forge_from_authorization_header
grafolean           |   File "/usr/local/lib/python3.6/site-packages/jwt/api_jwt.py", line 104, in decode
grafolean           |     self._validate_claims(payload, merged_options, **kwargs)
grafolean           |   File "/usr/local/lib/python3.6/site-packages/jwt/api_jwt.py", line 134, in _validate_claims
grafolean           |     self._validate_exp(payload, now, leeway)
grafolean           |   File "/usr/local/lib/python3.6/site-packages/jwt/api_jwt.py", line 175, in _validate_exp
grafolean           |     raise ExpiredSignatureError('Signature has expired')
grafolean           | jwt.exceptions.ExpiredSignatureError: Signature has expired

Authentication errors are errors from the user point of view, not from system; they should be logged with INFO log level.

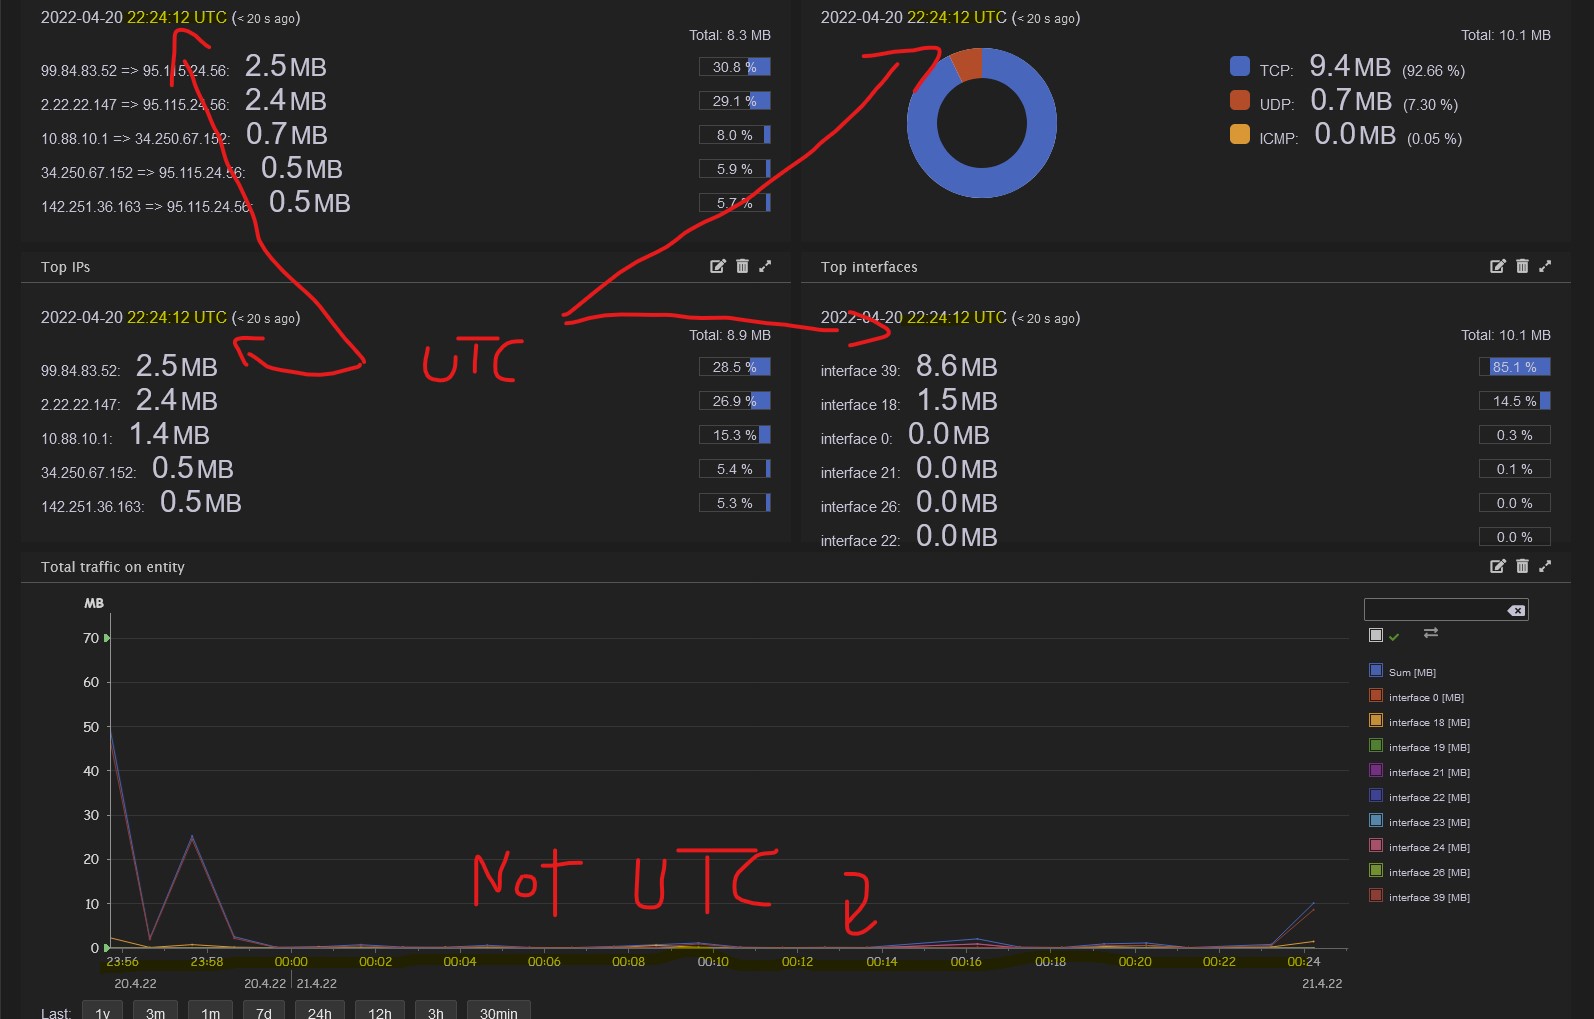
different Timezones

Hi,

I am using the docker-compose-version on an RPi. Unfortunately, the TImezones dont match.

I live in Germany and Id like to see the Europe/Berlin-Timezone. The time in the lower graph is local, the time in the 4 "Top-Boxes" is UTC. Any chance to have all times set to local time?

Screenshot 2022-04-21 002559

Egress Netflow Data

I am not seeing any egress data within the Netflow dashboard. I assume it is partially related to the issue you resolved with the netflow issues I was seeing in the previous issue.

Screen Shot 2021-02-25 at 8 19 48 PM

Different port

Hello,

Is it possible to assign a different port for grafolean - for example port 8080?

Thanks

How to configure Netflow for this software?

Do we still use port 2055 when configuring a CISCO router?
Do we specify a version like 5 or 9?
There is no mention in the documentation about how to configure the router side..
Thanks

ERROR: for grafolean-netflow-collector "host" network_mode is incompatible with port_bindings

I've done this a couple of times now and I get stuck at the same spot each time.. Same error..

~ $ docker-compose up -d

grafolean-autoheal is up-to-date
grafolean-ping-bot is up-to-date
postgres is up-to-date
mosquitto is up-to-date
grafolean is up-to-date
grafolean-snmp-bot is up-to-date
grafolean-netflow-bot is up-to-date
Creating grafolean-netflow-collector ...
grafolean-netflow-writer is up-to-date

ERROR: for grafolean-netflow-collector  "host" network_mode is incompatible with port_bindings

ERROR: for netflowcollector  "host" network_mode is incompatible with port_bindings

docker.errors.InvalidArgument: "host" network_mode is incompatible with port_bindings

I do not do much with Docker.. I apologize if there is a simple fix, but web searches are coming up empty.

Detailed SNMP overflow detection log message

The log message for SNMP counter overflow detection does not tell which entity the offending sensor belongs to, which means that it is difficult to determine what needs to be fixed:

Counter overflow detected for oid .1.3.6.1.4.1.2021.13.15.1.1.4, oid index 10, discarding value - if this happens often, consider using OIDS with 64bit counters (if available) or decreasing polling interval.

Bonus: it would be nice if such warnings were displayed within the UI.

Web UI allows login, shows dashboard for a minute, then goes back to the login page

I just deployed this via docker in Portainer. Everything appears to be running correctly. After going through the setup pages I am presented with a login screen. I enter the appropriate login and password, the screen disappears and the dashboard begins to load, then I am again presented with the login screen. I have tried Firefox and Chrome with the same issue. What additional info can I get you to help me?

Error fetching entities for both entities and sensors

  • I have an Ubuntu 20 server setup with grafolean as per the instructions, on 192.168.100.157:

  • A MikroTik on 192.168.100.3 and PFSense firewall on 192.168.100.1. Both are setup to send their Netflow traffic to 192.168.100.157.

Now, when I goto entities, or sensors, I get an " Error fetching entities" erro.
image

image

Any suggestions for this?

Ubuntu 22.04 - The database must be upgraded before we can proceed.

I followed the installation instructions on a newly installed Ubuntu Ubuntu 22.04.3 LTS VM, with Docker version 24.0.6, build ed223bc installed.

The only change I made to the .env file was add the IP address
`user@grafolen:~$ more .env
EXTERNAL_HOSTNAME=192.168.100.156
DB_DIR=/grafolean-db/
DB_NAME=grafolean
DB_USER=admin
DB_PASS=admin
HTTP_PORT=80

Options: full, none or basic (default).

TELEMETRY=basic
rudi@grafolen:~$
`

Upon opening http://192.168.100.156 I get a message, "The database must be upgraded before we can proceed." Clicking on the Upgrade button doesn't do anything.

WebUI not loading with nginx FATAL state

I've deployed my first setup of Grafolean and the web GUI does not load on port 80 (even though I know it's open). In the grafolean container, the errors are pictured below. Any ideas?
Screenshot 2023-09-30 at 10 07 43 AM

Recommend Projects

  • React photo React

    A declarative, efficient, and flexible JavaScript library for building user interfaces.

  • Vue.js photo Vue.js

    🖖 Vue.js is a progressive, incrementally-adoptable JavaScript framework for building UI on the web.

  • Typescript photo Typescript

    TypeScript is a superset of JavaScript that compiles to clean JavaScript output.

  • TensorFlow photo TensorFlow

    An Open Source Machine Learning Framework for Everyone

  • Django photo Django

    The Web framework for perfectionists with deadlines.

  • D3 photo D3

    Bring data to life with SVG, Canvas and HTML. 📊📈🎉

Recommend Topics

  • javascript

    JavaScript (JS) is a lightweight interpreted programming language with first-class functions.

  • web

    Some thing interesting about web. New door for the world.

  • server

    A server is a program made to process requests and deliver data to clients.

  • Machine learning

    Machine learning is a way of modeling and interpreting data that allows a piece of software to respond intelligently.

  • Game

    Some thing interesting about game, make everyone happy.

Recommend Org

  • Facebook photo Facebook

    We are working to build community through open source technology. NB: members must have two-factor auth.

  • Microsoft photo Microsoft

    Open source projects and samples from Microsoft.

  • Google photo Google

    Google ❤️ Open Source for everyone.

  • D3 photo D3

    Data-Driven Documents codes.