I am Ben Dickson from Arlington, VA. I go to school at Lehigh University in Bethlehem, PA, where I am double majoring in International Relations and Journalism. I am an avid ultimate frisbee player, and I am the assistant captain of the Lehigh Men's Ultimate Frisbee A team. In my free time, I love to be outside and stay updated on current events.

I am a very passionate NFL fan and hope to be a sports journalist when I am older, so I chose to look at this year's NFL Playoff QB's and compare them by using their passer scores. Passer score uses data from every pass attempt by a quarterback and analyzes it, giving it a score from 50 (lowest) to 99 (highest). The interesting finding in this infographic is that most quarterbacks were only separated by a small margin. However, there was one huge outlier, which was Steelers' quarterback Ben Roethlisberger. This was an interesting find, as he was harshly criticized during the season. The data was provided by ESPN

This timeline depicts the timeline of the historic football rivalry between Lehigh and Lafayette. The source for this was Lehigh University Archives. This is the longest going college football rivalry in the whole US. While they may not be the strongest football teams anymore, there storied rivalry is still known by the masses.
<iframe src='https://cdn.knightlab.com/libs/timeline3/latest/embed/index.html?source=10s-pWapfU0fSHXilstki6ZV-D5uxLhBrB1Rohmv1Eyg&font=Default&lang=en&initial_zoom=2&height=650' width='100%' height='650' webkitallowfullscreen mozallowfullscreen allowfullscreen frameborder='0'></iframe>This timeline depicts the story of how the Baltimore Ravens came to be. The source of this information was the NFL. The Ravens became a team in 1996, and have since became one of the most dominant teams in the league. It is truly remarkable how quickly they rose to success from their creation in the mid-1990's.
<iframe src='https://cdn.knightlab.com/libs/timeline3/latest/embed/index.html?source=1EH6ghA-e9DJazhHz0Xsfwn5vAyjbtV3gVv0WAEgX59g&font=Default&lang=en&initial_zoom=2&height=650' width='100%' height='650' webkitallowfullscreen mozallowfullscreen allowfullscreen frameborder='0'></iframe>This graph depicts undergraduate enrollment in Lehigh's different undergraduate colleges. This data was provided by Lehigh University. As seen in the graph, the Arts and Sciences school has by far the largest undergraduate population, and has for years. This is surprising, as Lehigh was founded as an engineering school.

This graph depicts the NFL's 2021-2022 season interception leaders. This data was provided by the NFL. Matthew Stafford and Trevor Lawrence led the NFL this season with 17 interceptions a piece. However, Lawrence actually played far fewer games, as his team did not make the playoffs. Because of this, Lawrence had the worst interception to game ratio in the league.

This graph depicts enrollment in Lehigh's different undergraduate colleges over the past five years. This data was orivuded by Lehigh University. Unsurprisingly, the engineering school is in the lead of student population. However, that lead is dwindling, as Lehigh diversifies the educational programs that they offer.

The AFC North is clearly one of the most competitive divisions in the NFL, as shown in this chart. These teams are known for playing tough and physical football and always giving it their all on the field. As seen in the chart, the biggest movers are the CLeveland Browns. They had a win total 0f 0 at one point, moving all the way up to 11 a couple of years late.

This map depicts the best cities to ride bikes in in the world. This data was provided by Wired. As seen on the map, most of these cities are in Europe. Europe offers much infrastructure for bicyclists, something that many other cities around the world do not do as much of.
<iframe src="https://www.google.com/maps/d/u/1/embed?mid=1T-1S16niOeC0W9xpBZ6DTqsl6ZE6MrmM&ehbc=2E312F" width="640" height="480"></iframe>)This map depicts the five most populated cities in the world. This data was provided by Newsweek. The five most populated cities in the world are Tokyo, Delhi, Shanghai, Sao Paulo, and Mexico City. These cities all are home to millions upon millions of people. The mopst populated cities in the world often change over time, but these are well ahead of the curve as of now.
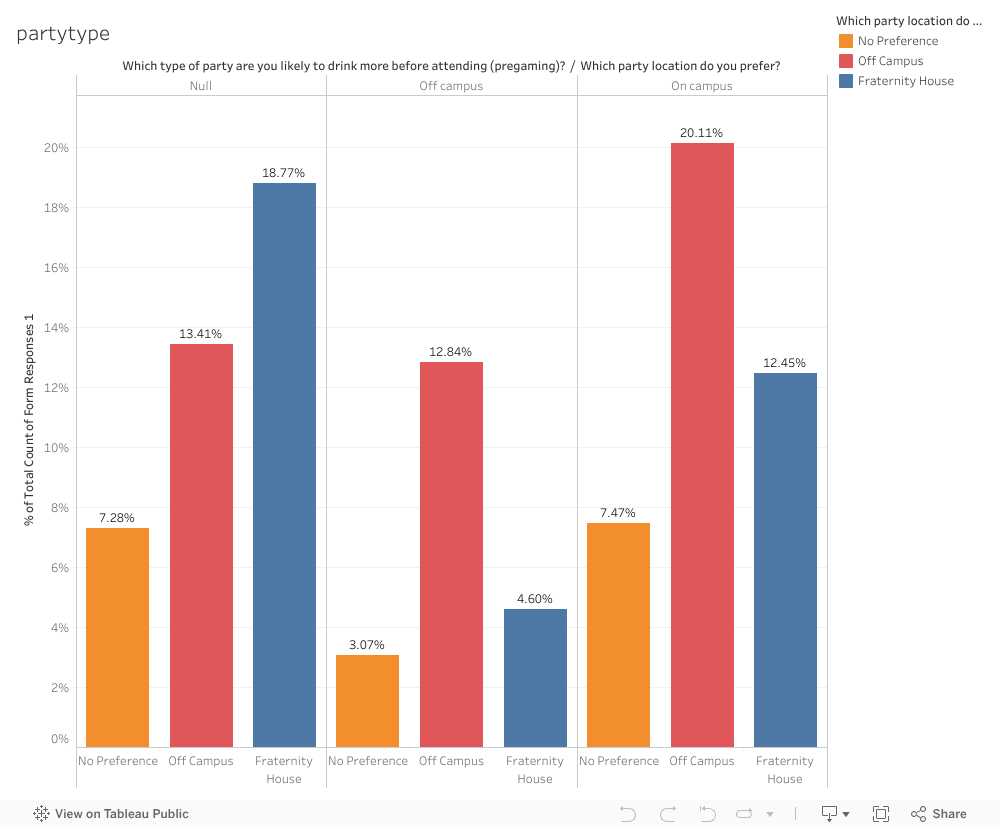
<iframe src="https://www.google.com/maps/d/u/1/embed?mid=1SFAKYw4eSxl_ArVl1J2ZUUQF8o0U1y4z&ehbc=2E312F" width="640" height="480"></iframe>This graphic depicts Lehigh party locations and how much people pregame before going to parties at those locations. This data was provided through the class. As seen in the graphic, Lehigh students love to pregame regardless of the party location. The party location does not have too large an effect on the amount of pregaming.
This graphic depicts the amount of the population between 0-14 and the life expectancy in countries around the world. This data was provided by the CIA. Less developed countries on average have a higher percent of the population under 14 years old, while the life expectancy of those same nations tend to be lower than those of fully developed countries.

