highcharts / highcharts-vue Goto Github PK
View Code? Open in Web Editor NEWLicense: Other
License: Other
Hi, I'm using highcharts-vue, stock. If I try to trigger the redraw event anywhere in my code, no event gets fired to the chart. Any help? Here's a full example of my code
 <template>
            <highcharts ref="chart" :constructor-type="'stockChart'" :options="chartOptions" :callback="chartLoaded" ></highcharts>
</template>

<script type="text/babel">

    import Highcharts from 'highcharts'
    import {Chart} from 'highcharts-vue'
    import stockInit from 'highcharts/modules/stock'
    stockInit(Highcharts)

    export default {
        components: {
            highcharts: Chart
        },
        created() {

        },
        computed: {

        },
        data() {
            return {
                chartOptions: {
                    events: {
                        load: function(event) {
                            console.log("EVENT " + event)
                        },
                        redraw: function (event) {
                            console.log("EVENT " + event)
                        }
                    },
                    tooltip: {
                        xDateFormat: '%b %e %I:%M:%S %p',
                        shared: true
                    },
                    scrollbar: {
                        enabled: true
                    },
                    credits: {
                        enabled: false
                    },
                    xAxis: {
                        type: 'datetime',
                        minRange: 3200000,
                        dateTimeLabelFormats: {
                            day: '%b %e',
                            minute:  '%I:%M %p',
                            hour: '%I:%M %p'
                        },
                        title: {
                            text: 'Date and Time'
                        },
                        gridLineWidth: 1,
                        minorGridLineWidth: 1,
                        lineColor: 'gray',
                        tickLength: 0.5
                    },
                    yAxis: {
                        title: {
                            text: 'Data'
                        },
                        min: 0
                    },
                    navigator: {
                        xAxis: {
                            type: 'datetime',
                            dateTimeLabelFormats: {
                                day: '%b %e',
                                minute:  '%I:%M %p',
                                hour: '%I:%M %p'
                            },
                        },
                    },
                    gridLineWidth: 1,
                    minorGridLineWidth: 1,
                    lineColor: 'transparent',
                    tickLength: 1,
                    plotOptions: {
                        spline: {
                            dataGrouping: {enabled: false },
                            lineWidth: 3,
                            states: {
                                hover: {
                                    enabled: true,
                                }
                            },
                        },
                        series: {
                            marker: {
                                states: {
                                    hover: {
                                        enabled: true
                                    }
                                }
                            }
                        },
                        scatter: {
                            dataGrouping: {enabled: false },
                            enabled: true,
                            marker: {
                                class: 'guttered'
                            }
                        },
                    },
                    rangeSelector:{
                        enabled: false
                    },
                    title: {
                        text: ''
                    },
                    legend: {
                        enabled: true
                    },
                    series: [
                        {
                            name: 'Data',
                            data: [...data],
                            color: '#999',
                            showSymbol: true,
                        } ],
                },
                loading: false,
            }
        },
        methods: {
            chartLoaded(chart) {
                 console.log("Trigger redraw")
                 chart.redraw()
            }
        },
        mounted() {

            }
        },
        props: ['],
        watch: {

        },

    }
</script>

var series = this.chartOptions.series[0]
setInterval(function () {
var x = (new Date()).getTime(), // 当前时间
y = Math.random() // 随机值
series.addPoint({x, y}, true, true)
}, 1000)
when i am developing bubble chart in vue it showing error, please see below link
Hi,
I'm trying to dynamically add a Y axis to the chartOptions object, but I keep getting errors.
Dynamically creating series works (if there is already an existing X and Y axis in the chartOptions from the start).
I created a sandbox: codesandbox.io which shows the problem I'm having.
In src/components/Chart.vue is the code. I gave every new axis it's own ID and inserted it with:
this.chartOptions.yAxis.push(newAxis);
In this sandbox, every new series is added to the highest X and Y axis.
(if you remove the ID of the axis, the push method will run into an infinite loop, strange)
Maybe I'm adding the axis in a wrong way. In the DEMO app was no example of dynamically adding series or axis.
Kind regards
I already use this configuration to set global options to Highcharts:
import Highcharts from 'highcharts';
Highcharts.setOptions({
    lang: {
        decimalPoint: '.',
        drillUpText: '<<',
        noData: '...',
        resetZoom: 'R.Z.',
        thousandsSep: ' '
    }
});
Now how can I access to Highcharts after rendering the charts like the numberFormat method in tooltips ?
chart.vue
...
tooltip:{
        formatter: function(){
        return this.key //+ ' : ' + Highcharts.numberFormat(this.y,2);
    }
},
...
I've seen other people with this issue, but the fixes I've seen don't work for me.
Essentially, I want to set a max-width on the chart. I tried applying a style="max-width" to the component, but that ends up setting the width, not a max-width. I've tried doing...
        chart: {
          events: {
            load() {
              setTimeout(this.reflow.bind(this))
            }
          }
        },
How would I call reflow outside of this event definition? Say, when the open modal button was pressed?
You can see what I'm talking about on at this URL by clicking "Forecast" in green in the top right: http://moon.bitcorns.com/harvests/1. I am getting this issue on Google Chrome.

I want to use the hideLoading and showLoading functions of the chart using vue wrapper.
Any suggestions on how could I use this while still remaining in Highcharts wrapper component for vue?
Million thanks in advance.
When I was using Highcharts without Vue, we had something like so:
 xAxis: {
    categories: daysArray,
    labels: {
        align:'center',
        formatter: function () {
            return toPersianNum(this.axis.defaultLabelFormatter.call(this));
        }
    },
},
While in vue this refers to current vue instance.
How to access this.axis.defaultLabelFormatter or this.points and etc... while we are in vue instance ?
Please add type definitions.
I don't know what the correct way to reproduce this in a shareable way yet, but I was having a strange problem where all the charts are drawn beyond the width of their parent containers. Resizing the page causes them to snap back to the correct size.
Unfortunate, since it implemented super easily.
What more can I provide to help dig into the issue?
I try to change tooltip with chartOptions when I clicked button but it can't render correctly. Can you help me?
Hi,
It that possible to use highcharts plugins especially the motion plugin with highcharts-vue ?
my chart has a array included 50 date,if the array has null , it cant reset the chart it keep old chart and render new data that not null,how can i reset the chart with new array that has null
How does this wrapper integrate highcharts with the Vue virtual dom? Does Highcharts.js manipulate the dom directly?
I've created a wrapper component that has the highcharts tag in its template:
<highcharts :options='chartOptions' ref='lineCharts'></highcharts>
The parent component is using that wrapper like so:
<planned-vs-actual-graph chosenMetric='metricID' />
I've got a VueX store that maintains global query parameters, and the chart does an Axios based API call when certain VueX store params change. All this works fine.
My problem appears when I add another wrapper onto the parent component:
<planned-vs-actual-graph chosenMetric='metric1' />
<planned-vs-actual-graph chosenMetric='metric2' />
The first time both graphs render fine, and the chosenMetric is being used properly to populate the title, the Y axis and as an API query parameter. Data comes back correctly, and clearly populates correctly upon the first API query. Both graphs render as intended.
The problem is that the second time around, one of the graphs only updates its data points, but does not update its axis x and axis y. Also the tooltip hover looks broken. The error in my console:
TypeError: d[h].update is not a function
at eval (highcharts.js?e74e:288)
at Array.forEach ()
at a.each (highcharts.js?e74e:28)
at e.updateData (highcharts.js?e74e:288)
at e.setData (highcharts.js?e74e:289)
at e.update (highcharts.js?e74e:336)
at eval (highcharts.js?e74e:330)
at Array.forEach ()
at a.each (highcharts.js?e74e:28)
at eval (highcharts.js?e74e:330)
This error is not consistent, the disappearing axis jumps between graph1 and graph 2.
import Vue from 'vue'
import HighchartsVue from 'highcharts-vue'

Vue.use(HighchartsVue)
Highcharts.setOptions({
	lang: {
		months: [
			'Janvier', 'Février', 'Mars', 'Avril',
			'Mai', 'Juin', 'Juillet', 'Août',
			'Septembre', 'Octobre', 'Novembre', 'Décembre'
		],
		weekdays: [
			'Dimanche', 'Lundi', 'Mardi', 'Mercredi',
			'Jeudi', 'Vendredi', 'Samedi'
		]
	}
})
How use setOptions to all component
How use momentjs next to highchart-vue?
Error:
Highcharts Error #25
Can't find Moment.js library
Using the global.timezone option requires the Moment.js library to be loaded.
Changing out the series data plots the new points correctly, but it draws the lines incorrectly. Instead of drawing a line from the last point in the series to the new point, it draws the line from the first point to the new point without erasing the old line in between. Is there a way to force a complete redraw?

Hi,
When I use the Exporting module and the default export server from HighCharts, I get two Y-axis in the exports, even when I added just one Y-axis.
You can see a working example here: codesandbox.io/s/8zm10144l2
Just Click on button (1), (2) and then create an PNG export.
It seems that the SVG in the webpage and the SVG that is POSTed to the Export server are not the same. Probably another effect because of Vue. Or am I doing something wrong?
Kind regards
I'm trying to format the label on the yAxis with the value and a dynamic value from the data object. But in the function I've only the this which is attached to the Vue component, how do I get the unit value from data ?
<template>
    <div>
        <highcharts :options="chartOptions" ref="chart"></highcharts>
    </div>
</template>

<script>
    import {Chart} from 'highcharts-vue'
    import Highcharts from 'highcharts';

    export default {
        components: {
            highcharts: Chart
        },
        data() {
            return {
                data: {},
                unit: 'kWh',
                chartOptions: {
                    chart:
                        {
                            type: 'column',
                            backgroundColor: '',
                        },
                    yAxis:
                        {
                            gridLineColor: '#197F07',
                            labels: {
                                useHTML: true,
                                formatter:  function()
                                            {
                                                return Highcharts.numberFormat(this.value, 2, ",", ".") + this.unit;
                                            }
                            },
                            title: {
                                text: null
                            }
                        },
                    navigation: {
                        buttonOptions: {
                            enabled: false
                        }
                    },
                    loading: {
                        style: {
                            "opacity": 1
                        }
                    },
                    tooltip: {
                        formatter:  function()
                        {
                            return this.key + this.unit;
                        }
                    },
                }
            }
        },
    }
</script>Googlebot uses Chrome 41 for rendering websites.
I decided to check how the component works in Chrome 41. Download can be here.
I installed Demo app. In the latest browsers, everything works fine.
In chrome 41, the component does not work.
[Vue warn]: Error in mounted hook: "TypeError: undefined is not a function"
found in
--->
at src/components/Chart.vue
at src/App.vue
Hi,
I would like to add a datepicker for a highcharts range selector in Vue.js. The only example I found is using Jquery datepicker but I failed to apply it in Vue.js (link to example : http://jsfiddle.net/BWEm5/542/)
How can I do the same think properly in Vue.js ?
Hello,
I can't find any way to specifically set the chart's height. I want it to use the full width of the enclosing div, but only a height of 200px. This is my current code:
<template>
    <div class="mdl-cell mdl-cell--12-col chart-container">
        <highcharts class="chart" :options="chartOptions"></highcharts>
    </div>
</template>

<script>
    import { Chart } from "highcharts-vue"
    import * as axios from "axios"

    export default {
        props: ['token'],
        components: {
            highcharts: Chart
        },
        created: function() {
            let currentTime = (new Date()).getTime();

            for (let i = 0; i < steps; i++) {
                this.chartOptions.series[0].data.push([currentTime - (steps - i) * refreshRate, 0]);
                this.chartOptions.series[1].data.push([currentTime - (steps - i) * refreshRate, 0]);
                this.chartOptions.series[2].data.push([currentTime - (steps - i) * refreshRate, 0]);
            }

            setInterval(this.updateGraph, 1000);
        },
        methods: {
            updateGraph() {
                let cpuSeries = this.chartOptions.series[0];
                let memSeries = this.chartOptions.series[1];
                let storageSeries = this.chartOptions.series[2];

                let config = {
                    headers: {
                        'Accept': 'application/json',
                        'Authorization': 'Bearer ' + this.token
                    }
                };

                axios.get("/api/system-resources", config)
                    .then(response => {
                        let x = (new Date()).getTime();
                        // First shift all points to the left
                        cpuSeries.data.shift();
                        memSeries.data.shift();
                        storageSeries.data.shift();

                        cpuSeries.data.push([x, response.data.cpu]);
                        memSeries.data.push([x, response.data.memory]);
                        storageSeries.data.push([x, response.data.storage]);
                    });
            }
        },
        data() {
            return {
                steps: 20,
                chartOptions: {
                    animation: false,
                    type: 'spline',
                    title: {
                        text: ''
                    },
                    xAxis: {
                        type: 'datetime',
                        labels: {
                            enabled: false
                        }
                    },
                    yAxis: {
                        title: {
                            text: '%'
                        }
                    },
                    plotOptions: {
                        series: {
                            marker: {
                                enabled: false
                            }
                        }
                    },
                    series: [{
                        name: "CPU",
                        data: [],
                        pointInterval: 1000

                    }, {
                        name: "Memory",
                        data: [],
                        pointInterval: 1000
                    }, {
                        name: "Storage",
                        data: [],
                        pointInterval: 1000
                    }]
                }
            }
        }
    }
</script>
I tried Chart.chartHeight, Chart.plotHeight or setting the height explicitly on the enclosing div, or by using the :height-property on the highcharts-component. None of these seem to work.
Thanks in advance
I'm trying to add stockChart from your demo app but i get this error.
stock.js?37d8:105 Uncaught TypeError: Cannot set property 'top' of undefined
at a.Chart.eval (stock.js?37d8:105)
at eval (highcharts.js?ea7f:31)
at Array.forEach ()
at Object.a.each (highcharts.js?ea7f:28)
at a.fireEvent (highcharts.js?ea7f:30)
at a.Chart.setChartSize (highcharts.js?ea7f:261)
at a.Chart.setSize (highcharts.js?ea7f:258)
at eval (highcharts.js?ea7f:257)
And this one:
webpack-internal:///./node_modules/vue/dist/vue.runtime.esm.js:588 [Vue warn]: Error in callback for watcher "options": "TypeError: Cannot set property 'top' of undefined"
found in
--->
at src\components\BurndownChart.vue
at src\App.vue
I added all this to main.js
import HighchartsVue from 'highcharts-vue'
import Highcharts from 'highcharts'
import stockInit from 'highcharts/modules/stock'
stockInit(Highcharts)
Vue.use(HighchartsVue)
and have proper values. Tried your example and other data.
I am trying to update highcharts from vuex store but the data change is only reflected when i make changes to the code and save it. Maybe because the server restarts thats why so i can i make it reactive. Below is my code.
<template>
  <div>
    <vue-highcharts :options="options" ref="lineCharts"></vue-highcharts>
    <v-btn>{{parts}}</v-btn>
  </div>
</template>

<script>
import VueHighcharts from 'vue2-highcharts';
import Vue from 'vue';

export default {

  components: {
    VueHighcharts,

  },
  data() {
    return {

      options: {
        chart: {
          type: 'spline',
          title: 'Hassaan',
        },
        xAxis: {
          categories: ['Jan', 'Feb', 'Mar', 'Apr', 'May', 'Jun',
            'Jul', 'Aug', 'Sep', 'Oct', 'Nov', 'Dec'],
        },
        yAxis: {
          title: {
            text: '',
          },
          labels: {
            formatter() {
              return `${this.value}°`;
            },
          },
        },
        tooltip: {
          crosshairs: true,
          shared: true,
        },
        credits: {
          enabled: false,
        },
        plotOptions: {
          spline: {
            marker: {
              radius: 4,
              lineColor: '#666666',
              lineWidth: 1,
            },
          },
        },
        series: [],
      },
    };
  },


  created() {
    Vue.set(this.options, 'series', this.$store.state.parts);
  },

};
</script>
Hi!
How do add a dynamic series of data properly? Sorry for the basic question but all of the examples assume static data.
Seeing that highcharts-more is deprecated and I can't find boxplots etc under /modules, how do I include this functionality?
Thanks
From @bensladden on September 13, 2018 2:25
It is expected that the charts will animate as shown in this example:
http://jsfiddle.net/0wp4ngy9/
No animation, the pie chart instantly changes to the most recent values. This also appears to be the case for bar and column charts
https://codesandbox.io/s/y0x2561vk9
Highcharts 6.1.0
highcharts-vue 1.0.4
vue ^2.5.2
Copied from original issue: highcharts/highcharts#8942
Hello
I was wondering if it was possible to access the chart object directly to for example call redraw?
I am having issues with my solid gauge component where every time it receives new data it re-draws from 0. Please see sandbox link below:
https://codesandbox.io/s/n0no0jky1l
The desired behavour im trying to achieve is shown here:
https://www.highcharts.com/demo/gauge-solid
afterSetExtremes function called multiple times on navigator mousemove with setExtremes event. There is no way to detect start/end of navigator change.
And afterSetExtremes doesn't call at all if navigator.adaptToUpdatedData = false;
Does anyone have another example of an active Vue or Vuetify project that has an active HighCharts chart in it? It would be helpful to see it in a project to see what I am doing wrong, or how to improve the current project that I have.
Thank you
Hi,
I'm using the default setup generated with Vue CLI 3 of VueJS and while trying your example I ran into an issue with the worldmap.js-file:
I got the error:
"export 'default' (imported as 'addWorldMap') was not found in './js/worldmap.js'
I fixed it by changing the worldmap.js to:
export const worldmap = {'title': 'World, Miller projection, medium resolution', ...
and in the main.js import it as such:
import {worldmap} from './js/worldmap'
and then load it to the corresponding map as such:
Highcharts.maps['myMapName'] = worldmap
I don't know if this is the proper way, but it works!
Maybe it would be an idea to update this example to use the default VueJS setup?
I noticed that after updating to Highcharts 7, nested options (ie. label), were being replaced with an empty object if the computed options object (I was passing as a prop), was updated. I, therefore, drew the conclusion that something on the chart.update was mutating the options deeply.
I noticed that there was an update to highcharts-vue made where you fixed errors on updating, caused by mutating data. I believe a possible solution to this issue could be that instead of using Object.assign to do a shallow clone, a deep clone could be done instead.
My app has an off canvas menu. When I open and close the menu I would like for my stock chart to automatically resize to fit the available space. I have not been able to get anything to work and am wondering if maybe chart.reflow() would work. I am not sure how to use it within Vue, though, or if the highcharts-vue wrapper even allows us to use chart.reflow(). The first example from reflow API is exactly what I am looking for.
Please let me know if there is some way that I can get the stock chart to auto resize to fit the available space in my scenario.
Thank you!
I was wondering if its possible to create an organization chart with this project?
Something similar to the following chart:
image
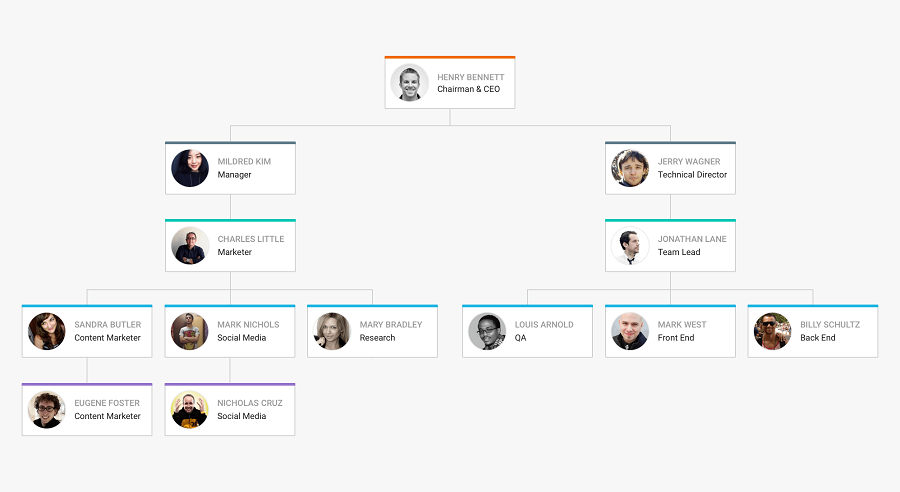
If the answer is yes, where can I see an example or a demo?
Thank you
I tried setExtremes () and afterSetExtremes () on this sample.
http://jsfiddle.net/DktpS/85/
Why afterSetExtremes () twice on load,
Is setExtremes (), afterSetExtremes () called twice at zoom event?
https://jsfiddle.net/tw96vL2d/
However Your demo did not happen the above.
What's the difference?
I exec the command below:
yarn add highcharts
yarn add highcharts-vue
and then:
import Highcharts from 'highcharts'
import highchartsVue from 'highcharts-vue'
Vue.use(HighchartsVue)
it show the errors below:
 Could not find a declaration file for module 'highcharts-vue'. '/Users/jcmac/TC/fms-front-v2/node_modules/highcharts-vue/dist/module/highcharts-vue.min.js' implicitly has an 'any' type.
  Try `npm install @types/highcharts-vue` if it exists or add a new declaration (.d.ts) file containing `declare module 'highcharts-vue';`
How to solve this problem please?
Im using nuxt with latest highchart lib
I setup highcharts-vue as nuxt plugin
import Vue from 'vue'
import HighchartsVue from 'highcharts-vue'

Vue.use(HighchartsVue)
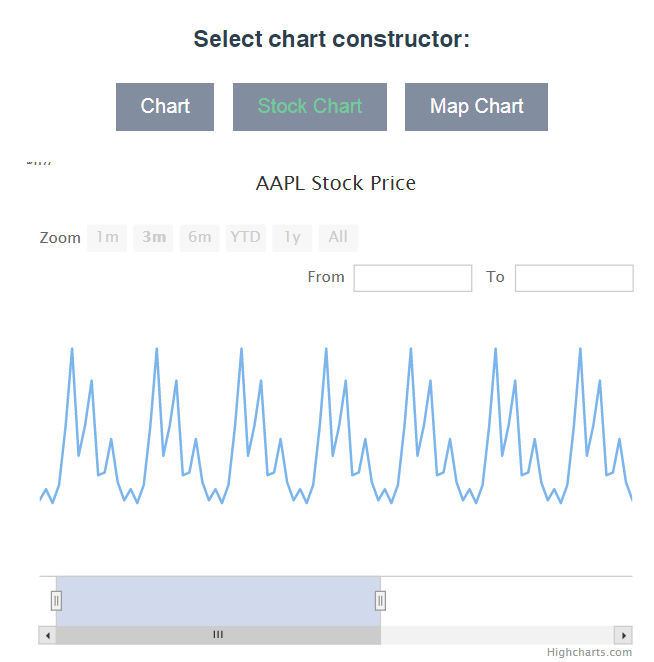
there is my options
        testOptions: {
          rangeSelector: {
            selected: 1
          },
          title: {
            text: 'AAPL Stock Price'
          },
          series: [{
            name: 'AAPL',
            data: [10, 20, 10, 23, 65, 121, 44, 66, 98, 30, 32, 56, 25, 12, 53],
            pointStart: Date.UTC(2018, 1, 1),
            pointInterval: 1000 * 3600 * 24,
            tooltip: {
              valueDecimals: 2
            }
          }]
        },
im trying to init in mounted callback
mounted () {
      StockInit(Highcharts)
}
on mounted i catched this error
Currently, it is not possible to add series dynamically if they are not initialised as empty object in the chart options.
Component code:
<template>
  <highcharts class="chart" :options="chartOptions">
  </highcharts>
</template>

<script>

import axios from 'axios';

export default {
  name: 'BarChart',
  data () {
    return {
      chartOptions: {
        chart: {
          type: 'column'
        },
        series: []
      }
    }
  },
  created () {
    this.fetchData()
  },
  methods: {
    fetchData: function () {
        this.chartOptions.series = [{ data: [1,2,3] })
    }
  }
}
</script>
The component above does not render series. However, they are rendered if the series is initialised as an empty object:
data () {
    return {
      chartOptions: {
        chart: {
          type: 'column'
        },
        series: [{}]
      }
    }
  }
This behaviour can be reproduced in pure Highcharts when oneToOne option is disabled:
I can't seem to find a way to get the chart to draw when I have to calculate the series data from an ajax call. The ajax call works fine and I get the data just fine but can't seem to draw/update the chart with this data.
Hello,
I have tried your demo last week and Stock Chart was working as expected, today, after I had to reinstall dependencies it returns error:
[Vue warn]: Error in callback for watcher "options": "TypeError: Cannot set property 'top' of undefined" found in
---> <Highcharts>
       <StockChart> at src\components\StockChart.vue
         <App> at src\App.vue
           <Root>
and seems that zoom do not work (link to print screen below)
https://i.gyazo.com/dd0000506fb02393d01bf483f4031c6e.png
May you tell, if you are experiencing same error?
highcharts-vue does not support ie11. All your examples are not shown in ie11.
I think this issue needs to be solved quickly.
Hello, I am having difficulty with drawing stockchart after axios request.
On main.js, I set the "Vue.prototype.$http = axios".
And this is a simplified version of my code.
The StockChart should be updated when the "code" from "updateInfo" props, which is updated on App.js, is updated.
When I run this code, it only shows just the frame of the chart with date fields empty.
<template>
  <div id="chartPanel">
    <StockChart :code="code"></StockChart>
  </div>
</template>

<script>
import StockChart from 'chart/StockChart.vue'
export default {
  props: ['updateInfo'],
  data() {
    return {
      code: ''
    }
  },
  mounted() {
    this.code = this.updateInfo.code;
  },
  components: {
    'StockChart': StockChart
  }
}
<template>
  <div class="stock-chart">
    <highcharts class="stock" :constructor-type="'stockChart'" :options="stockOptions" :updateArgs="updateArgs"></highcharts>
  </div>
</template>

<script>
export default {
  props: ['code'],
  data() {
    return {
      points: [],
      animationDuration: 1000,
      updateArgs: [true, true, {duration: 1000}]
      stockOptions: {
        rangeSelector: {
          selected: 1
        },
        title: {
           text: 'AAPL Stock Price'
        },
        series: [{
          name: 'AAPL',
          type: 'candlestick',
          data: this.points,
          pointStart: Date.UTC(2018, 1, 1),
          pointInterval: 1000 * 3600 * 24,
          tooltip: {
            valueDecimals: 2
          }
        }]
      }
    }
  },
  watch: {
    code: function(newValue) {
      this.reqStockChart()
    }
    // I tried watch to "points" value with serveral ways, but this didn't work either.
    // I tried like this: "this.stockOptions.series[0].data = newValue"
    // And I tried to put stockOptions in computed but it didn't work.
  },
  methods: {
    reqStockChart: function() {
      var self=this;
      this.$http.get('url', parameters).then(function(result) {
        self.updateStockChart(result);
      }).catch(function(e) { console.log(e) });
    },
    updateStockChart: function(result) {
      // result format is [[date,open,high,low,close], ...]
      // I will just put data same as the result
      this.points = [
        [Date.UTC(2018, 3, 4), 10, 15, 5, 12],
        [Date.UTC(2018, 3, 12), 20, 30, 10, 12],
        [Date.UTC(2018, 3, 23), 10, 15, 5, 9],
        [Date.UTC(2018, 4, 2), 23, 35, 12, 30],
        [Date.UTC(2018, 4, 15), 65, 90, 35, 75],
        [Date.UTC(2018, 4, 27), 121, 160, 80, 101],
        [Date.UTC(2018, 5, 6), 44, 60, 44, 48],
        [Date.UTC(2018, 5, 19), 66, 66, 50, 52],
        [Date.UTC(2018, 5, 28), 98, 120, 98, 118],
        [Date.UTC(2018, 6, 9), 30, 39, 28, 39],
        [Date.UTC(2018, 6, 21), 32, 32, 30, 30]
      ]
    }
}
I use drilldown(Highcharts) but it doesn't work.
Do you have any opinions?
Hi,
Are there any changelog for highcharts-vue?
Because it would be really convenience if we could track on what changes historically each releases.
Thanks
I'm getting the error "t.component is not a function" on render for this component, and it points to at n (highcharts-vue.min.js:1)
<template>
    <div>
      <highcharts-vue :options="chartOptions" ref="lineCharts"></highcharts-vue>
    </div>
</template>

<script>
import HighchartsVue from 'highcharts-vue'
import Highcharts from 'highcharts'

import { feedStatsService } from '../../_services';

export default {
  components: {
      HighchartsVue
  },
  props: ['feedID'],
  data () {
    return {
      points: [],
      chartOptions: {
        xAxis: {
            type: 'datetime'
        },
        chart: {
          type: 'line'
        },
        title: {
          text: 'Total Number of Listens'
        },
        series: [{
          data: this.points,
          color: '#6fcd98'
        }]
      }
    }
  },
  created () {
    feedStatsService.getListens(this.feedID)
        .then(
            results => {
              this.points = results.map(function(e){
                return [moment.utc(e.date).valueOf(), e.total_first_listens]
              });
            },
            error => {
                // dispatch('alert/error', error, { root: true });
                console.error(error);
            }
        )
  },
  watch: {
    points (newValue) {
      this.chartOptions.series[0].data = newValue
    }
  }
}
</script>
I have code that change chartOption series and drilldown dynamicly. Series work but drilldown does not work.
I have import your demo code in codesandbox to demonstrate this issue. Basicly I just change the first chart component that allow series to be changed dynamicly by filling up numbers into inputbox.
My change is to apply the same points to a working drilldown in chart Option.
Before that dynamic change happen, drilldown is working. After putting any number into the input box, it stop working.
Appreciate it if you can have a look at bellow url
EDIT: Wow! CodeSandbox is so not user friendly. I make some changes to your demo code. Tested to be working but then what? I have no way to save it to my sandbox and share the url here. I can only paste some picture.
Both codes in src\components\chart.vue


I've been struggling to get the indicators series to work on the highstock example. Still no luck. Please add indicators to the highstock example.
A declarative, efficient, and flexible JavaScript library for building user interfaces.
🖖 Vue.js is a progressive, incrementally-adoptable JavaScript framework for building UI on the web.
TypeScript is a superset of JavaScript that compiles to clean JavaScript output.
An Open Source Machine Learning Framework for Everyone
The Web framework for perfectionists with deadlines.
A PHP framework for web artisans
Bring data to life with SVG, Canvas and HTML. 📊📈🎉
JavaScript (JS) is a lightweight interpreted programming language with first-class functions.
Some thing interesting about web. New door for the world.
A server is a program made to process requests and deliver data to clients.
Machine learning is a way of modeling and interpreting data that allows a piece of software to respond intelligently.
Some thing interesting about visualization, use data art
Some thing interesting about game, make everyone happy.
We are working to build community through open source technology. NB: members must have two-factor auth.
Open source projects and samples from Microsoft.
Google ❤️ Open Source for everyone.
Alibaba Open Source for everyone
Data-Driven Documents codes.
China tencent open source team.