Giter VIP home page Giter VIP logo

iseepathways's Introduction

iSEE - The interactive SummarizedExperiment Explorer

GitHub issues GitHub pulls Lifecycle: stable R-CMD-check-bioc Codecov test coverage

Bioconductor release status

Branch R CMD check Last updated
devel Bioconductor-devel Build Status
release Bioconductor-release Build Status

Overview

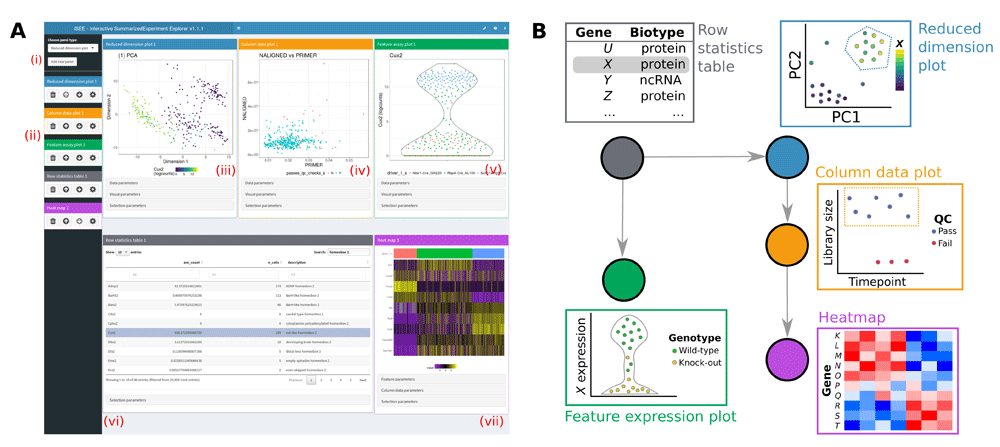
The iSEE package provides an interactive user interface for exploring data in objects derived from the SummarizedExperiment class. Particular focus is given to single-cell data stored in the SingleCellExperiment derived class. The user interface is implemented with RStudio's Shiny, with a multi-panel setup for ease of navigation.

This initiative was proposed at the European Bioconductor Meeting in Cambridge, 2017. Current contributors include:

Figure 1. iSEE uses a customisable multi-panel layout.

Installation

iSEE can be easily installed from Bioconductor using BiocManager::install():

if (!requireNamespace("BiocManager", quietly = TRUE))
    install.packages("BiocManager")
BiocManager::install("iSEE")
# or also...
BiocManager::install("iSEE", dependencies = TRUE)

Setting dependencies = TRUE should ensure that all packages, including the ones in the Suggests: field of the DESCRIPTION, are installed - this can be essential if you want to reproduce the code in the vignette, for example.

Functionalities

Click to expand the list of features available in iSEE applications.

General

  • Multiple interactive plot types with selectable points.

  • Interactive tables with selectable rows.

  • Coloring of samples and features by metadata or expression data.

  • Zooming to a plot subregion.

  • Transmission of point selections between panels to highlight, color, or restrict data points in the receiving panel(s).

  • Lasso point selection to define complex shapes.

Sample-level visualization

The iSEE user interface currently contains the following components where each data point represents a single biological sample:

  • Reduced dimension plot: Scatter plot of reduced dimensionality data.

  • Column data plot: Adaptive plot of any one or two sample metadata. A scatter, violin, or square design is dynamically applied according to the continuous or discrete nature of the metadata.

  • Feature assay plot: Adaptive plot of expression data across samples for any two features or one feature against one sample metadata.

  • Column data table: Table of sample metadata.

Feature-level visualization

The iSEE user interface currently contains the following components where each data point represents a genomic feature:

  • Row data plot: Adaptive plot of any two feature metadata. A scatter, violin, or square design is dynamically applied according to the continuous or discrete nature of the metadata.

  • Sample assay plot: Adaptive plot of expression data across features for any two samples or one sample against one feature metadata.

  • Row data table: Table of feature metadata.

Integrated visualization

The iSEE user interface contains the following components that integrate sample and feature information:

  • Complex heatmap plot: Visualize multiple features across multiple samples annotated with sample metadata.

Custom panels

The iSEE API allows users to programmatically define their own plotting and table panels. See the section Extending iSEE further below.

Miscellaneous

  • The iSEE user interface continually tracks the code corresponding to all visible plotting panels. This code is rendered in a shinyAce text editor and can be copy-pasted into R scripts for customization and further use.

  • Speech recognition can be enabled to control the user interface using voice commands.

Want to try iSEE?

We set up instances of iSEE applications running on diverse types of datasets at those addresses:

Please keep in mind that those public instances are for trial purposes only; yet they demonstrate how you or your system administrator can setup iSEE for analyzing or sharing your precomputed SummarizedExperiment/SingleCellExperiment object.

Extending iSEE

If you want to extend the functionality of iSEE, you can create custom panels which add new possibilities to interact with your data. Custom panels can be defined in independent R packages that include iSEE in the Imports: sections of their DESCRIPTION file. You can find a collection of working examples of how to do it in iSEEu. Feel free to contact the developing team, should you need some clarifications on how iSEE works internally.

Code of Conduct

Please note that the iSEE project is released with a Contributor Code of Conduct. By contributing to this project, you agree to abide by its terms.

iseepathways's People

Contributors

csoneson avatar kevinrue avatar

Stargazers

 avatar

Watchers

 avatar  avatar  avatar  avatar  avatar

iseepathways's Issues

[BUG] rcmdcheck warnings and notes

Fix the various warnings and notes below.

❯ checking whether package ‘iSEEpathways’ can be installed ... WARNING
  See below...

❯ checking for missing documentation entries ... WARNING
  Undocumented code objects:
    ‘featuresStats’ ‘pathways’
  Undocumented S4 methods:
    generic '.defineInterface' and siglist 'FgseaEnrichmentPlot'
    generic '.defineInterface' and siglist 'PathwaysTable'
    generic '.defineOutput' and siglist 'FgseaEnrichmentPlot'
    generic '.generateOutput' and siglist 'FgseaEnrichmentPlot'
    generic '.renderOutput' and siglist 'FgseaEnrichmentPlot'
    generic 'featuresStats' and siglist 'iSEEfgseaResults'
    generic 'pathways' and siglist 'iSEEfgseaResults'
  All user-level objects in a package (including S4 classes and methods)
  should have documentation entries.
  See chapter ‘Writing R documentation files’ in the ‘Writing R
  Extensions’ manual.

❯ checking for code/documentation mismatches ... WARNING
  Warning in formals(fun) : argument is not a function
  Warning in formals(fun) : argument is not a function

❯ checking whether the namespace can be loaded with stated dependencies ... NOTE
  Warning: no function found corresponding to methods exports from ‘iSEEpathways’ for: ‘.defineInterface’
  
  A namespace must be able to be loaded with just the base namespace
  loaded: otherwise if the namespace gets loaded by a saved object, the
  session will be unable to start.
  
  Probably some imports need to be declared in the NAMESPACE file.

❯ checking dependencies in R code ... NOTE
  Namespace in Imports field not imported from: ‘BiocGenerics’
    All declared Imports should be used.
  ':::' call which should be '::': ‘iSEE:::.organizationHeight’
    See the note in ?`:::` about the use of this operator.

❯ checking R code for possible problems ... NOTE
  Warning in formals(fun) : argument is not a function
  Warning in body(fun) : argument is not a function
  Warning in formals(fun) : argument is not a function
  Warning in body(fun) : argument is not a function
  .createObservers,FgseaEnrichmentPlot: no visible global function
    definition for ‘slot<-’
  .createObservers,FgseaEnrichmentPlot: no visible global function
    definition for ‘updateSelectizeInput’
  .defineDataInterface,FgseaEnrichmentPlot: no visible global function
    definition for ‘.selectizeInput.iSEE’
  .defineOutput,FgseaEnrichmentPlot: no visible global function
    definition for ‘.getPanelColor’
  .defineOutput,FgseaEnrichmentPlot: no visible global function
    definition for ‘brushOpts’
  .defineOutput,FgseaEnrichmentPlot: no visible global function
    definition for ‘plotOutput’
  Undefined global functions or variables:
    .getPanelColor .selectizeInput.iSEE brushOpts plotOutput slot<-
    updateSelectizeInput
  Consider adding
    importFrom("methods", "slot<-")
  to your NAMESPACE file (and ensure that your DESCRIPTION Imports field
  contains 'methods').

0 errors ✔ | 3 warnings ✖ | 3 notes ✖

[BUG] Fix GO mapping function in vignette integration

On branch fgsea-plot, update vignette to define a GO mapping function that uses the gene_id to perform accurate pathway analysis (do not use the hybrid uniquified feature name). The function should still return the uniquified feature name (because it is in rownames) but mapping to unique gene identifiers first is necessary to make sure that uniquified feature names are not missed during the mapping

Please briefly describe your problem and what output you expect. If you have a question, please don't use this form. Instead, ask on https://support.bioconductor.org/ using the appropriate tag(s) including one for this package.

Context

Provide some context for your bug report or feature request. This could be the:

Code

Include the code you ran and comments

## prompt an error
stop('hola')

## check the error trace
traceback()

Small reproducible example

If you copy the lines of code that lead to your error, you can then run reprex::reprex() which will create a small website with code you can then easily copy-paste here in a way that will be easy to work with later on.

## prompt an error
stop('hola')
#> Error in eval(expr, envir, enclos): hola

## check the error trace
traceback()
#> No traceback available

R session information

Remember to include your full R session information.

options(width = 120)
sessioninfo::session_info()

The output of sessioninfo::session_info() includes relevant GitHub installation information and other details that are missed by sessionInfo().

[BUG] implement remaining brush events

As this is a direct Panel derivative, it needs reimplementing of the same brush events as DotPlot derivatives.


Please briefly describe your problem and what output you expect. If you have a question, please don't use this form. Instead, ask on https://support.bioconductor.org/ using the appropriate tag(s) including one for this package.

Context

Provide some context for your bug report or feature request. This could be the:

Code

Include the code you ran and comments

## prompt an error
stop('hola')

## check the error trace
traceback()

Small reproducible example

If you copy the lines of code that lead to your error, you can then run reprex::reprex() which will create a small website with code you can then easily copy-paste here in a way that will be easy to work with later on.

## prompt an error
stop('hola')
#> Error in eval(expr, envir, enclos): hola

## check the error trace
traceback()
#> No traceback available

R session information

Remember to include your full R session information.

options(width = 120)
sessioninfo::session_info()

The output of sessioninfo::session_info() includes relevant GitHub installation information and other details that are missed by sessionInfo().

Recommend Projects

  • React photo React

    A declarative, efficient, and flexible JavaScript library for building user interfaces.

  • Vue.js photo Vue.js

    🖖 Vue.js is a progressive, incrementally-adoptable JavaScript framework for building UI on the web.

  • Typescript photo Typescript

    TypeScript is a superset of JavaScript that compiles to clean JavaScript output.

  • TensorFlow photo TensorFlow

    An Open Source Machine Learning Framework for Everyone

  • Django photo Django

    The Web framework for perfectionists with deadlines.

  • D3 photo D3

    Bring data to life with SVG, Canvas and HTML. 📊📈🎉

Recommend Topics

  • javascript

    JavaScript (JS) is a lightweight interpreted programming language with first-class functions.

  • web

    Some thing interesting about web. New door for the world.

  • server

    A server is a program made to process requests and deliver data to clients.

  • Machine learning

    Machine learning is a way of modeling and interpreting data that allows a piece of software to respond intelligently.

  • Game

    Some thing interesting about game, make everyone happy.

Recommend Org

  • Facebook photo Facebook

    We are working to build community through open source technology. NB: members must have two-factor auth.

  • Microsoft photo Microsoft

    Open source projects and samples from Microsoft.

  • Google photo Google

    Google ❤️ Open Source for everyone.

  • D3 photo D3

    Data-Driven Documents codes.