Giter VIP home page Giter VIP logo

arcgis-rgb-to-z-tool's Introduction

ArcGIS-RGB-to-Z-Tool

Created by James M Roden

Version==0.2.0 // Jan 2019

An ArcGIS toolbox to convert RGB values to their corresponding z-values as denoted in the map’s legend. Input: georectified RGB image. Output: Z-value raster & point shapefile.

DOWNLOAD

RGB IMAGE Figure 1: Georectified composite RGB image

Z IMAGE Figure 2: Z-Value raster derived from composite RGB image

Index

  1. Background
  2. How to Use

Background

Composite images, like that in figure 1, more often than not contain three channels: red, green, blue (RGB). In a 24-bit RGB image each channel has 8-bits – in other words the image is composed of three images (one for each channel). Each of these channels has varying intensities between 0 and 255. The combination of these 3 channels results in a possible 16,777,216 colours.

When the original map was created in GIS software however, the raster (the bathymetry in figure 1) would have been a single channel raster where its values would not have been representing intensities of red, green or blue; but representing the sea floor depth in meters (z-value). The map creator will have chosen a colour-ramp to stretch over the raster’s z-values, in this example where red corresponds to a z-value of 0, yellow corresponds to a z-value of -50 and so on. Only when the map was exported to an image format did it become an RGB composite image, but this means we don’t have access to the original z-values to use in GIS or 3D modelling software. This tool aims to reverse engineer the image to its original single band z-value raster by mapping the pixels RGB value to its z-value equivalent by using the map legend as a guide.

How to Use

  1. Georectify the RGB composite image in ArcMap
  2. Using the eye-dropper tool carefully select RGB colours along the grids colour ramp in the legend. Copy and paste the RGB value into a new line in a blank text document followed by its corresponding Z value. Each new RGB-to-Z pairing needs to be on a new line as in figure 3 below. If you do not have the eye-dropper available in your toolbar already, please find instructions here
  3. Once all RGB to Z values are ready and your text file is saved, follow the instructions in the ArcGIS Toolbox.
  4. Output: A z-value raster & point dataset.

Text File

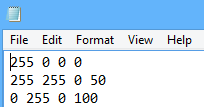
Figure 3: Text File Example

arcgis-rgb-to-z-tool's People

Stargazers

 avatar  avatar  avatar  avatar  avatar

Watchers

 avatar  avatar  avatar

Forkers

javinav

arcgis-rgb-to-z-tool's Issues

Failed to execute RasterToPoint, possible empty feature class (error 010151)

I'm processing a world map (from https://s3-eu-west-1.amazonaws.com/globalwindatlas/posters/World_PD.png) at 0.01 degree resolution, which I've georeferenced to WGS-84 (rectified). The code runs well up to "Numpy array re-stacked and z-value function ran across channel axis".

In the following step "Executing: RasterToPoint (...)RGBtoZ_Pnt.shp Value" it fails with error:

Failed to execute (RasterToPoint).

ArcPy ERRORS:
Executing: RasterToPoint C:\temp_javi\RGBtoZ_Ras C:\temp_javi\RGBtoZ_Pnt.shp Value
Start Time: Mon Jul 30 14:40:35 2018
ERROR 010151: No features found in C:\temp_javi\rgbtoz_pnt.shp. Possible empty feature class.
Failed to execute (RasterToPoint).
Failed at Mon Jul 30 14:40:35 2018 (Elapsed Time: 0.21 seconds)

in_memory intermediate files deleted.
Completed script RGB-to-Z...
Failed to execute (RGB-to-Z).
Failed at Mon Jul 30 14:40:35 2018 (Elapsed Time: 8 minutes 31 seconds)

I am running ArcGIS 10.3 in a Windows 7 enterprise machine. No other python installation in the machine.

Btw, this is a very nice tool.

Thanks,

Javi

Recommend Projects

  • React photo React

    A declarative, efficient, and flexible JavaScript library for building user interfaces.

  • Vue.js photo Vue.js

    🖖 Vue.js is a progressive, incrementally-adoptable JavaScript framework for building UI on the web.

  • Typescript photo Typescript

    TypeScript is a superset of JavaScript that compiles to clean JavaScript output.

  • TensorFlow photo TensorFlow

    An Open Source Machine Learning Framework for Everyone

  • Django photo Django

    The Web framework for perfectionists with deadlines.

  • D3 photo D3

    Bring data to life with SVG, Canvas and HTML. 📊📈🎉

Recommend Topics

  • javascript

    JavaScript (JS) is a lightweight interpreted programming language with first-class functions.

  • web

    Some thing interesting about web. New door for the world.

  • server

    A server is a program made to process requests and deliver data to clients.

  • Machine learning

    Machine learning is a way of modeling and interpreting data that allows a piece of software to respond intelligently.

  • Game

    Some thing interesting about game, make everyone happy.

Recommend Org

  • Facebook photo Facebook

    We are working to build community through open source technology. NB: members must have two-factor auth.

  • Microsoft photo Microsoft

    Open source projects and samples from Microsoft.

  • Google photo Google

    Google ❤️ Open Source for everyone.

  • D3 photo D3

    Data-Driven Documents codes.